Single-domain shape anisotropy in near-macroscopic Ni80Fe20 thin-film rectangles
Abstract
Shape anisotropy provides a simple mechanism to adjust the local bias field in patterned structures. It is well known that for ellipsoidal particles m in size, a quasi-single domain state can be realized with uniform anisotropy field. For larger patterned ferromagnetic thin-film elements, domain formation is thought to limit the effectiveness of shape anisotropy. In our work we show that very soft lithographically patterned Ni80Fe20 films with control of induced magnetic anisotropy can exhibit shape anisotropy fields in agreement with single-domain models, for both hysteresis loop measurements at low field and ferromagnetic resonance measurements at high field. We show the superiority of the fluxmetric form over the magnetometric form of anisotropy estimate for thin films with control dimensions from 10 m to 150 m and in-plane aspect ratios above 10.
Micron- and submicron-scale patterned ferromagnetic thin films are of interest for applications in magnetoelectronicsscience1 ; science2 ; patternedreview . Shape anisotropy, through finite aspect ratios of length to width, provides a convenient mechanism to adjust the internal field in these structuresparkin1997 , independent of induced anisotropy. In nanometer-dimension patterned structures, estimates of the demagnetizing factor from uniform (ellipsoidal) formulaejaosbornPR1945 are considered to represent the anisotropic field wellcarossJAPnanoellipse2011 .
In uniformly magnetized thin-film structures of 10 m and greater lateral dimension, appropriate formulae to estimate demagnetizing fields are not as clear. Two forms for have been proposed since the earliest treatments of the topiccrmannPR1896 ; aharoniJAP1998 ; aharoniJAP2000 : ”magnetometric” and ”fluxmetric(ballistic)”, which are the volume average and area average over the midplane normal to , respectively. These two forms diverge for structures with very large aspect ratios of thickness to in-plane dimensions (thin-film limit)dxchenJAP2002 . Nevertheless, the magnetometric form is widely applied in the literaturecarossAPL2012 ; zerofieldFMR , typically without recognition that alternate forms exist. We are not aware of prior attempts to validate either form through comparison with the other in fitting experimental data.
In this paper, we show that the fluxmetric form is in fact the superior form for the demagnetizing factor N in the thin-film limit. We have evaluated this formula both in the limit of saturated magnetization in high field, using variable frequency ferromagnetic resonance (FMR), and in low-field hysteresis, using magnetic optic Kerr effect (MOKE) measurement. We find agreement of to 20% with a simple analytic limit of the formulae shown in Ref. 9. We find, on the other hand, that the magnetometric form is a very poor estimate for thin films, disagreeing with experimental data by a factor of four for the structures considered in this study.
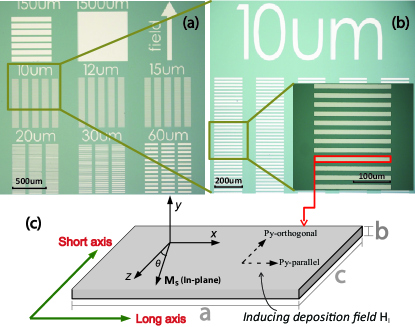
Patterned Py films (Ni80Fe20) were deposited on Si substrates using magnetron sputtering with base pressure better than Torr. The structure of the films was Si/SiO2 substrate/ Ta(5 nm)/ Ni80Fe20(40 nm)/ Ta(3 nm). Laser-direct-write photolithography at a resolution of 1 m was used to fabricate rectangular stripe patterns (Fig. 1a,b), with short dimensions ranging from 10 m to 150 m. A 1500 m 1500 m square was used as the unpatterned comparison. Induced magnetic anisotropy was introduced using an in-situ quadrupole electromagnet setupelectromagnet in UHV. A rotating field of Oe was applied in phase to the rotating sample holder at 0.25 Hz during sputtering. The Py films were deposited together on two identically patterned substrates. The first substrate, denoted as ”Py-parallel” (PP), was oriented such that is parallel to the long axes of the elements. The second substrate, ”Py-orthogonal” (PO), has the orthogonal orientation. The films were post-annealed at 250 in vacuum of Torr for 1 h under a field of 4.0 kOe along the deposition field to strengthen the induced anisotropy.
The hysteresis loops of the stripe arrays on PP and PO were characterized via MOKE with the biasing field applied along the short axes. The size of the laser spot is close to the array dimension (1.5 mm). The two substrates were then cut into individual arrays using a dicing saw. The in-plane shape anisotropy of the arrays was then characterized by FMR. The samples were scanned along their long and short axes. The dispersion curves of each array were acquired with rf frequency varying from 2 Ghz to 26 Ghz. The curves were fitted by the Kittel function:
| (1) |
where is the external biasing field, is the anisotropy field, , and is the saturation inductance. The differences of the anisotropic fields () on the two axes are recorded in order to determine the shape anisotropy.
To estimate and analyze the experimental data, consider a rectangular stripe with coordinate system defined in Fig. 1(c), with a, b, c as the long dimension, thickness, and short dimension along , and axes, respectively. We present a greatly simplified formula, , of the fluxmetric demagnetizing factor from the full analytic form (Eq. (2) in Ref. 9), which could work as a substitute for under thin film limit () and when the stripe is uniformly magnetized along :
| (2) |
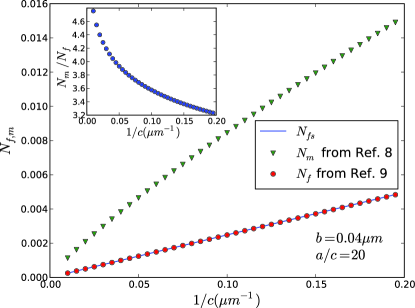
The second approximation is valid when the in-plane aspect ratio is large (). When the magnetization is along , is two orders of magnitude smaller than and does not contribute to the shape anisotropy. The full analytic formulae of and from Refs. 8 and 9 are compared in Fig. 2 along with for the thin film limit and a large in-plane aspect ratio (a/c=20). We highlight the significant difference between calculated magnetometric and fluxmetric forms and , disagreeing with each other in the analytic calculation by a factor greater than three, as plotted in the inset of Fig. 2. We also highlight the accuracy of to the full fluxmetric form : the filled circles are indistinguishable from the line in Fig. 2, disagreeing with each other by a maximum of 0.03% for the range considered in the calculation.
In an array of thin-film elements, additional dipolar fields arise from neighboring elements. The stray dipolar field from the magnetostatic interaction can be calculated by summing up all the dipolar fields from the neighboring elements on each element and then taking an average of all the local fields. The stray field factor is defined as , with the superscript denoting the magnetization direction. Parts of the calculated and are listed in Table 1, with definition of . In the structures is about a quarter of but with opposite sign, reducing the total demagnetizing field.
| array | ||||
|---|---|---|---|---|
| ”10m” | 23.4e-4 | 22.2Oe | -5.8e-4 | -5.5Oe |
| ”15m” | 15.6e-4 | 14.8Oe | -4.0e-4 | -3.8Oe |
| ”30m” | 8.5e-4 | 8.1Oe | -2.0e-4 | -1.9Oe |
| ”150m” | 1.6e-4 | 1.5Oe | -0.7e-4 | -0.7Oe |
When the rectangular stripe defined in Fig. 1(c) is under an external field along , the total energy can be expressed as:
| (3) |
where K is the induced anisotropy energy, is the angle between and , stands for either or . The sign of the induced anisotropy energy is positive for PP and negative for PO. In a classical model, , where is the induced anisotropy field. The new saturation field with shape anisotropy becomes:
| (4) |
One should notice that when the hysteresis loop will show easy-axis behavior.
In FMR the effective anisotropy field can be calculated by where stands for the second term in Eq. (3). The magnetization of the elements in an array will precess about with small amplitudes. However because the movements of different elements are not in phase, the stray dipolar fields are decoupled from the resonance precession and we approximate them as a constant field. So in Eq. (3) the term should be replaced by , where stands for the stray dipolar factor along the biasing field direction. The effective anisotropic fields along and are calculated to be:
| (5) |
At fixed frequency, the difference of the effective anisotropic field between and is:
| (6) |
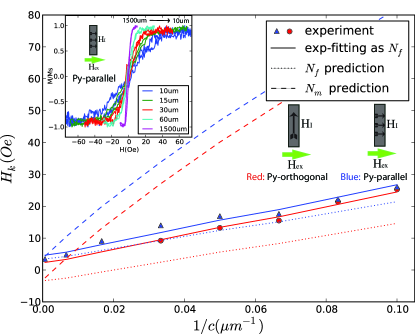
Figure 3 shows the experimental from MOKE, in comparison with the analytic (dot) and (dash) from Eq. (4), as a function of 1/c. The experimental of each array is obtained by extending the MOKE slopes at to saturation. For PO arrays (not shown), when the stripe width is larger than 30 m, cannot be determined. The inset shows the hysteresis loops of PO arrays, all of which show linear HA response with 1 Oe. The prediction curves are calculated taking the saturation inductance T measured in FMR, and induced saturation field Oe measured from the 1500 m1500 m square.
The best fits to the MOKE-derived are shown by the solid lines. Here we treat and as free parameters but fit the two curves simultaneously. We find that the MOKE values are close to the prediction, and far from the prediction. The data closely approximate the fitting lines to , validating the simple approximate form in Eq. (4). The fitted is 1.17 T, 23% larger than 0.948 T. The fitted are 4.5 Oe(PP) and -2.3 Oe(PO). The former result is close to the 3.4 Oe but the latter is with an opposite sign. This is due to the domain wall movement rather than domain rotation and has been discovered also in patterned spin valvesspinvalve .
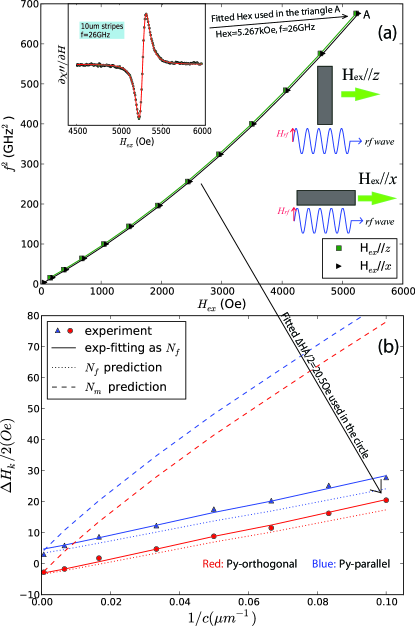
Figure 4 shows the result of FMR measurement. In Fig. 4(a) the relations with along and are fitted into Eq. (1) in order to extract , and . All the arrays can be fitted well by the the same of 0.948 T and of 2.115.
The differences in are summarized in Fig. 4(b), in comparison with the analytic (dot) and (dash) from Eq. (7), as a function of . The fitting into Eq. (7) is also completed with the same for the two series as the fitting parameters. Very close agreement between the experimental data and fits is seen, with the fitting curves (solid lines) very close to the prediction (dot). The fitted are 4.7 Oe for PP and 3.1 Oe for PO, both close to the induced saturation field 3.4 Oe. The fitted is 1.08 T, 14% larger than 0.948 T from FMR.
Summary: we have shown that the fluxmetric demagnetizing factor is superior to the magnetometric form for large-area thin film rectangles (length/thickness 200). Furthermore, we have shown a very simple analytical approximation, , to in Eq. (2), which is excellent over the full range studied. These results will facilitate magnetostatic biasing of thin-film structures for applications in magnetoelectronics.
We acknowledge support from the US Department of Energy grant No. DE-EE0002892 and National Science Foundation No. ECCS-0925829.
References
- (1) Gary A. Prinz, Science 282, 1660 (1998)
- (2) S. A. Wolf, D. D. Awschalom, R. A. Buhrman, J. M. Daughton, S. von Molnár, M. L. Roukes, A. Y. Chtchelkanova, D. M. Treger, Science 294, 1488 (2001)
- (3) C. A. Ross, S. Haratani, F. J. Castaño, Y. Hao, M. Hwang, M. Shima, J. Y. Cheng, B. Vogeli, M. Farhoud, M. Walsh, Henry I. Smith, J. Appl. Phys. 91, 6848 (2002)
- (4) Yu Lu, R. A. Altman, A. Marley, S. A. Rishton, P. L. Trouilloud, Gang Xiao, W. J. Gallagher, S. S. P. Parkin, Appl. Phys. Lett. 70, 2610 (1997)
- (5) J. A. Osborn, Phys. Rev. 67, 351 (1945)
- (6) M. Pardavi-Horvath, B. G. Ng, F. J. Castaño, H. S. Körner, C. Garcia, C. A. Ross, J. Appl. Phys. 110, 3921 (2011)
- (7) C. Riborg Mann, Phys. Rev. 3, 359 (1896)
- (8) Amikam Aharoni, J. Appl. Phys. 83, 3432 (1998)
- (9) Amikam Aharoni, Ladislav Pust, Mark Kief, J. Appl. Phys. 87, 6564 (2000)
- (10) D. X. Chen, C. Prados, E. Pardo, A. Sanchez, A. Hernando, J. Appl. Phys. 91, 5254 (2002)
- (11) G. Shimon, A. O. Adeyeye, C. A. Ross, Appl. Phys. Lett. 101, 083112 (2012)
- (12) Y. Zhuang, M. Vrouble, B. Rejaei, J. N. Burghartz, J. Appl. Phys. 99, 08C705 (2006)
- (13) C. Cheng, N. Sturcken, K. Shepard, W. E. Bailey, Rev. Sci. Instrum. 83, 3903 (2012)
- (14) Z. H. Qian, R. Bai, C. M. Yang, Q. L. Li, Y. C. Sun, D. X. Huo, L. W. Li, H. L. Zhan, Y. Li, J. G. Zhu, J. Appl. Phys. 109, 103904 (2011)