11email: nlodieu@iac.es 22institutetext: Departamento de Astrofísica, Universidad de La Laguna (ULL), E-38205 La Laguna, Tenerife, Spain 33institutetext: Centre for Astrophysics Research, Science and Technology Research Institute, University of Hertfordshire, Hatfield AL10 9AB, United Kingdom 44institutetext: Departamento de Astronomia, Universidad de Chile, Casilla 36-D, Santiago, Chile 55institutetext: Leibniz-Institut für Astrophysik Potsdam (AIP), An der Sternwarte 16, 14482, Potsdam, Germany 66institutetext: Institute of Astronomy, Madingley Road, Cambridge CB3 0HA, United Kingdom 77institutetext: Sternberg Astronomical Institute, Lomonosov Moscow State University, Universitetsky pr. 13, Moscow, 119992 Russia 88institutetext: Centro Astronómico Hispano Alemán, Calle Jesús Durbán Remón 2-2, 04004 Almería, Spain 99institutetext: Departamento de Astrofisica, Centro de Astrobiologia (INTA-CSIC), ESAC Campus, PO Box 78, E-28691 Villanueva de la Cañada, Spain 1010institutetext: Universidad Politécnica de Cartagena, Campus Muralla del Mar, Cartagena, Murcia E-30202, Spain 1111institutetext: School of Physics & Astronomy, Queen Mary University of London, Mile End Road, London E1 4NS, United Kingdom
First T dwarfs in the VISTA Hemisphere Survey ††thanks: Based on observations made with the Calar Alto 3.5-m telescope, the Magellan telescope at Las Campanas, the ESO Very Large Telescope at the Paranal Observatory, and the IAC80 at Teide Observatory
Abstract
Aims. The aim of the project is to improve our current knowledge of the density of T dwarfs and the shape of the substellar initial mass function by identifying a magnitude-limited sample of T dwarfs in the full southern sky.
Methods. We present the results of a photometric search aimed at discovering cool brown dwarfs in the Southern sky imaged at infrared wavelengths by the Visible and Infrared Survey Telescope for Astronomy (VISTA) and the Wide Infrared Survey Explorer (WISE) satellite mission. We combined the first data release (DR1) of the VISTA Hemisphere Survey (VHS) and the WISE preliminary data release to extract candidates with red mid-infrared colours and near- to mid-infrared colours characteristics of cool brown dwarfs.
Results. The VHS DR1 vs. WISE search returned tens of T dwarf candidates, 13 of which are presented here, including two previously published in the literature and five new ones confirmed spectroscopically with spectral types between T4.5 and T8. We estimate that the two T6 dwarfs lie within 16 pc and the T4.5 within 25 pc. The remaining three are 30–50 pc distant. The only T7 dwarf in our sample is the faintest of its spectral class with = 19.28 mag. The other six T dwarf candidates remain without spectroscopic follow-up. We also improve our knowledge on the proper motion accuracy for three bright T dwarfs by combining multi-epoch data from public databases (DENIS, 2MASS, VHS, WISE, Spitzer).
Key Words.:
Stars: low-mass stars and brown dwarfs — techniques: photometric — techniques: spectroscopic — Infrared: Stars — surveys1 Introduction
Brown dwarfs represent an important link between the coolest stars that burn hydrogen and exoplanets that orbit stars. Our knowledge of their photometric and spectroscopic properties will help us improve current state-of-the-art models and provide key information on the chemistry at play in cool atmospheres (Leggett et al., 2007, 2009; Burningham et al., 2009; Burgasser et al., 2010b; Burningham et al., 2010a; Leggett et al., 2012). Furthermore, brown dwarfs are important testing current star formation models via studying of the present-day mass function (Burgasser, 2004; Metchev et al., 2008; Bate, 2009; Bastian et al., 2010; Burningham et al., 2010b; Reylé et al., 2010; Bate, 2012; Kirkpatrick et al., 2012).
The T spectral class consists of brown dwarfs with cool effective temperatures (1400–500 K; Burgasser et al., 2006b; Burningham et al., 2008; Lucas et al., 2010; Cushing et al., 2011). The first T dwarf, Gl 229B, was announced as a companion to an M dwarf in 1995 by Nakajima et al. (1995). Since then, more than 300 T dwarfs are known in the solar vicinity with a variety of physical properties (Kirkpatrick, 2005). The largest bulk of T dwarfs has been discovered in large-scale optical and infrared surveys such as the Two Micron All sky Survey (2MASS; e.g. Burgasser et al., 1999), the Sloan digital Sky Survey (SDSS; e.g. Leggett et al., 2000), the UKIRT Infrared Deep Sky Survey (UKIDSS; Lawrence et al., 2007) Large Area Survey (Kendall et al., 2007; Lodieu et al., 2007; Pinfield et al., 2008; Chiu et al., 2008; Burningham et al., 2010a; Scholz, 2010; Scholz et al., 2012), the UKIDSS Galactic Clusters Survey (Lodieu et al., 2009a), the UKIDSS Deep Extragalactic Survey (Lodieu et al., 2009b), the CFHT Brown Dwarf Survey (Delorme et al., 2008a, b; Reylé et al., 2010; Albert et al., 2011), the Wide-F ield Infrared Survey Explorer (WISE; Mainzer et al., 2011; Kirkpatrick et al., 2011; Scholz et al., 2011; Wright et al., 2012), and more recently Pan-Starrs (Deacon et al., 2011; Liu et al., 2011; Deacon et al., 2012b, a). The frontier between T and Y dwarfs originally proposed by Kirkpatrick et al. (1999) has now been crossed with the recent announcement of 13 Y dwarfs by the WISE team (Cushing et al., 2011; Kirkpatrick et al., 2012).
The Visible and Infrared Survey Telescope for Astronomy (VISTA; Emerson, 2001; Emerson et al., 2004), located at the European Southern Observatory (ESO)’s Cerro Paranal Observatory in Chile, is a 4-m class telescope dedicated to imaging the southern sky. The telescope is equipped with the world’s largest infrared camera, VIRCAM (Dalton et al., 2006), which is composed of 67 million pixels offering an field-of-view 1.65 degrees in diameter, 0.6 square degrees of which are sampled by ’pawprints’ of 16 non-contiguous detectors with 0.34 arcsec pixels. Six suitably offset and jittered pawprints are combined into a filled 1.5 square degree ’tile’, in which each piece of sky has been sampled by at least two pixels (ignoring the jitters), together with two additional 5.588.5 arcmin strips at opposite sides of the tile that are just covered once. Five broad-band filters are available, similar to the installed on UKIRT/WFCAM (Hewett et al., 2006) except for the filter. Two narrow-band filters are also available. Seventy-five percent of the time available on VISTA is dedicated to public surveys, one of which is the VISTA Hemisphere Survey (VHS; PI McMahon, Cambridge, UK), with which it is planned to image the entire southern sky in (at least) and over five years. The main scientific aims of VHS include (1) examining the nearest and coolest stars and brown dwarfs, (2) studying the merger history of the Galaxy, (3) measuring the properties of dark energy through examining large-scale structure to a redshift of 1, and (4) discovery of high-redshift quasars.
The ultimate scientific aim of our consortium is to identify a magnitude-limited sample of T dwarfs to perform an initial mass function population analysis with robust statistics based on discoveries in the entire Southern Sky imaged within the framework of the VHS. Additional scientific interests include identifying rare T dwarfs within the large sample to study the effects of unusual properties (e.g. gravity and/or metallicity) on the observed spectra, conducting kinematic studies of populations over different temperature ranges to constrain formation models, and revealing substellar halo objects. In this paper we report the discovery of the first T dwarfs in the area (675 square degrees) common to the VHS DR1 (McMahon et al. 2012, in prep) and the WISE preliminary data release (Wright et al., 2010). In Sect. 2 we describe the photometric selection criteria designed to identify cool T dwarfs. In Sects. 3 and 4 we detail the photometric and spectroscopic follow-up conducted at optical- and near-infrared wavelengths with various telescopes and instruments available to our team. In Sect. 5 we present the analysis of the spectra and derive the main spectral types and spectroscopic distances of the newly identified T dwarfs. Finally, we conclude and present our future plans in Sect. 6.
2 Sample selection
We cross-correlated the WISE preliminary data release with the VHS DR1 using a matching radius of 6 arcsec to take into consideration the resolution of the WISE images and include potential high proper motion sources despite the short baseline ( 1 year) between VHS and WISE. The common area includes 675 square degrees imaged in by VHS, including 109 square degrees with Sloan coverage. Among those 675 square degrees, 276 and 186 are covered in and , respectively. The photometric and colour criteria detailed below were gathered into a structure query language query (Hambly et al., 2008) launched in the VISTA Science Archive (Cross et al. 2012)111The VISTA Science Archive is at http://horus.roe.ac.uk/vsa/. We selected only good-quality point sources outside the Galactic Plane (i.e. galactic latitudes higher than 15 degrees in absolute values) with at least ten WISE measurements (parameters w1m,w2m,w3m,w4m)222WISE provides at least eight frames over 99% of the sky and a minimum of ten frames over 90% of the sky (Wright et al., 2010) and high signal-to-noise detections in and to focus specifically on mid- to late-T dwarfs:
-
•
Signal-to-noise WISE detections in : w2snr7
-
•
Error on the and photometry less than 0.16 and 0.3 mag, respectively (if magnitudes are quoted in the VHS catalogue)
- •
- •
-
•
0.3 mag (Burgasser et al., 2006b) or non-detection in
The query returned 148 sources. The inspection of the WISE cut-outs allowed us to reduce the number of candidates to 64 sources after removing artefacts and rejecting sources clearly detected in and . Among the remaining 64 candidates, 18 were detected in SDSS DR8 within 5 arcsec: 17 harbour blue colours inconsistent with cool T dwarfs (most appear as blue or dark blue sources on the SDSS colour images, suggesting that they might be white dwarfs, but none have spectra) and one shows a faint -band detection ( = 20.870.21; AB system; Fukugita et al., 1996) and no flux in the other Sloan bands (VHS J023756.24063142.9).
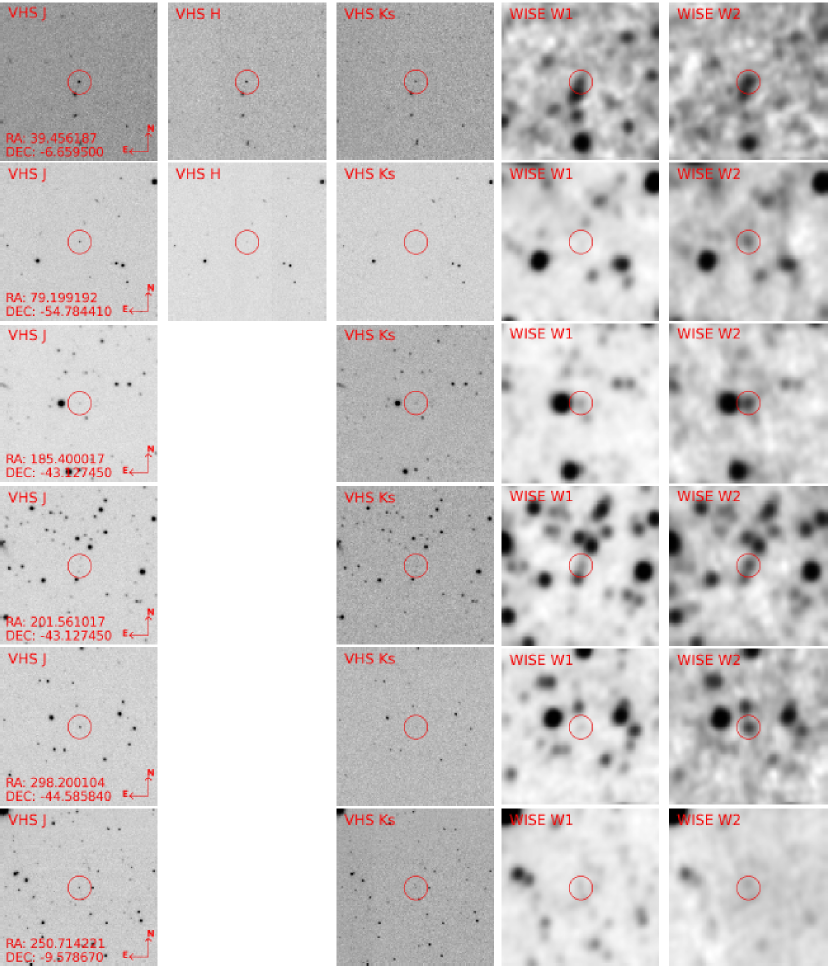
Twenty-two sources (6417) have USNO counterparts within 2 arcsec, reducing the final number of candidates to 25, including the 7 presented in this paper with spectroscopic confirmation and spectral types. None of the objects compiled in the USNO catalogue has significant proper motion nor spectral type quoted in the Simbad database, therefore they are either distant stars or extragalactic sources. Among the other candidates (257 = 18), four have colours redder than 0.1 mag (including two with 0.4 mag), two are detected only in (likely M dwarfs), one has 0.5 mag, one has 0.4 mag, two show no VHS detection at the WISE position although a magnitude is quoted in the catalogue, and two have VHS images affected by bad pixels, making their candidacy dubious. The remaining six candidates (including VHS J023756.24063142.9) remain interesting but we were unable to obtain spectra for them due to observing priorities and visibility issues. The coordinates (J2000) of the seven confirmed T dwarfs and the six candidates lacking spectroscopy are listed in Table LABEL:tab_VHS_dT:tab_new_dT along with the near-infrared magnitudes from VHS DR1 and mid-infrared photometry from the WISE Preliminary Release which has now been superseded by the WISE All-sky release. Table LABEL:tab_VHS_dT:tab_new_dT lists spectral types accurate to half a subclass, spectroscopic distances, and instruments (FIRE, XSH stands for X-shooter) used to obtain the spectrum for our confirmed T dwarfs. We emphasise that 2MASSI J0415195093506 was already known and has a trigonometric parallax suggesting a distance of of 5.7360.092 pc (Burgasser et al., 2002; Vrba et al., 2004) whereas VHS J162208.94095934.6 was discovered independently by Kirkpatrick et al. (2011). The last three columns of Table LABEL:tab_VHS_dT:tab_new_dT give the proper motions as well as the number of data points from UKIDSS, WISE, 2MASS, and DENIS used to derive those values for the three brightest T dwarfs in our sample. The finding charts of the objects presented in this paper are displayed in Figures 1 and 2.

| RA (J2000) | dec (J2000) | SpT | dist | Inst. | |||||||||||
|---|---|---|---|---|---|---|---|---|---|---|---|---|---|---|---|
| hh:mm:ss.ss | ∘:′:′′ | mag | mag | mag | mag | mag | mag | mag | mag | pc | mas/yr | mas/yr | |||
| 04:15:21.21 | 09:35:00.6 | — — | — — | 16.4380.009 | 15.3430.004 | 15.6660.012 | 15.6580.023 | 15.0950.042 | 12.2400.026 | T8.0 | 5.831.26 | — | — | — | — |
| 12:58:04.89 | 44:12:32.4 | — — | — — | — — | 15.9990.011 | — — | 16.1640.045 | 15.7390.071 | 14.0020.049 | T6.0 | 14.451.80 | FIRE | 113.106.1 | 178.409.1 | 11 |
| 14:33:11.46 | 08:37:36.3 | — — | — — | 20.1410.252 | 19.1390.154 | 19.2170.142d | — — | 18.229 — | 14.9710.114 | T8.0 | 33.4810.17 | FIRE | — | — | — |
| 15:43:52.78 | 04:39:09.6 | 22.020.15a | 20.950.27c | 17.6250.019 | 16.4450.009 | 16.4530.017 | 16.4340.040 | 15.9160.071 | 14.3510.063 | T4.5 | 22.091.21 | FIRE | 65.807.3 | 14.905.0 | 17 |
| 16:22:08.94 | 09:59:34.6 | 20.860.50b | 20.720.11c | — — | 16.2180.011 | — — | 16.4480.155 | 16.2510.102 | 14.0160.054 | T6.0 | 15.991.98 | XSHb | 76.911.5 | 59.509.5 | 11 |
| 19:29:34.18 | 44:25:50.5 | — — | — — | — — | 17.1290.022 | — — | 16.8410.076 | 16.3760.092 | 14.9580.083 | T4.0 | 31.581.72 | XSH | — | — | — |
| 20:51:59.38 | 55:08:43.9 | — — | — — | — — | 19.2800.083 | 19.7040.281 | 19.2160.380 | 17.791 — | 15.5240.150 | T7.0 | 51.1011.42 | FIRE | — | — | — |
| 02:37:56.24 | 06:31:42.9 | — — | — — | — — | 17.5550.019 | 17.5880.046 | 17.5490.080 | 17.0800.170 | 15.4810.152 | — | — | — | — | — | — |
| 05:18:59.64 | 54:49: 3.2 | — — | — — | — — | 18.5540.057 | 19.1160.220 | — — | 18.8530.427 | 15.7390.090 | — | — | — | — | — | — |
| 12:21:48.51 | 43:32:14.8 | — — | — — | — — | 18.8370.144 | — — | — — | 16.3210.092 | 14.7840.075 | — | — | — | — | — | — |
| 13:25:47.18 | 43:40:41.9 | — — | — — | — — | 18.7930.140 | — — | — — | 16.8410.170 | 15.2650.136 | — | — | — | — | — | — |
| 16:42:35.32 | 09:30:20.6 | — — | — — | — — | 18.6770.076 | — — | 18.5310.303 | 16.7060.163 | 15.1550.126 | — | — | —e | — | — | — |
| 19:55:50.12 | 44:15:14.2 | — — | — — | — — | 17.4050.042 | — — | — — | 17.3140.193 | 15.0430.096 | — | — | — | — | — | — |
a 2 confidence detection limit in Johnson (Vega system) from CAMELOT
b Marginal detection in Johnson (Vega system) from CAMELOT; the Sloan
detection is 21.480.12 mag (AB system)
c 2 confidence detection limit in SDSS (AB system) from CAMELOT
d Calar Alto 3.5-m/Omega2000 -band photometry (Vega system)
e A low signal-to-noise spectrum (30 minutes on-source integration)
obtained with the Gemini-North Near-Infrared Integral Field Spectrometer
(NIFS) indicates that it has a fairly flat spectrum that is not consistent
with a T dwarf or an L dwarf.
3 Multi-wavelength photometric follow-up
In this section, we describe the optical and near-infrared photometric follow-up carried out prior to spectroscopic observations to confirm the substellar status of our candidates (except for VHS J023756.24063142.9 which is covered by SDSS DR8).
3.1 Optical photometry
We carried out optical photometry of two of the brightest T dwarf candidates with the Johnson , and Sloan filters available on CAMELOT installed on the 0.82-m IAC80 telescope. CAMELOT (CAmara MEjorada del Observatorio del Teide or Improved Camera in the Teide Observatory in English) is a wide-field camera equipped with a 20482048 pixels Charge-Coupled Device (CCD) with 13.5 micron pixels, resulting in a pixel scale of 0.304 arcsec and a field-of-view of 10.6 arcmin squared.
We obtained two images of 20 min on-source integrations in the Sloan filter on 3 May 2011 for VHS J162208.94095934.6. Additionally, we observed this object in Johnson (315 min) and in Sloan (315 min) on 5 May 2011 along with a photometric standard star (G153-41; Landolt, 2009) to calibrate our Johnson image. The seeing was around 1.5–1.8 arcsec. Note that neither our objects nor G153-41 are covered by Sloan so we do not have any photometric zero points for the Sloan filter on that specific night. The data reduction of the optical images taken with CAMELOT was standard and made automatically by a pipeline at the end of each observing night. It includes bias subtraction and flat-field correction. No astrometry was performed because we are primarily interested in the photometry (detection or lower limit).
We did not detect any object in the combined -band image of VHS J162208.95095934.6 down to a 3 detection limit of 21.480.12 mag (AB system), implying an colour redder than 5.260.12 mag, consistent with a spectral type later than L6–L7 (Schmidt et al., 2010). This detection limit is taken from the rms of the number counts at the expected position of the object and compared to nearby objects with known magnitudes calibrated with a Sloan standard field (RA = 17:00:29, dec = 33:58:51; 330 sec; airmass=1.16) observed in Sloan on the same night. The dispersion of the photometric calibration using a large number of stars in the standard field is 0.12 mag. We detected the target marginally in the Johnson and infer a magnitude of 20.860.50 mag (Vega system), implying an colour of 4.64, consistent with T dwarfs (Liebert & Gizis, 2006). We also marginally detected the object in SDSS with = 20.720.11 mag (2 detection) using the zero point from the night of 7 May 2011 (see below), confirming that it is an interesting cool brown dwarf candidate.
Moreover, we obtained four exposures of 15 min in Johnson and six images of 10 min in Sloan on 7 May 2011 with CAMELOT with a seeing of 1.7–2.0 arcsec for VHS J154352.78043909.6. We derive magnitudes of = 22.020.15 mag (Johnson filter; Vega system) and = 20.950.27 mag (AB system; 2 confidence limits). The Sloan zero points come from the observations of two photometric standards (PG 0918029 and PG 1528062 Landolt, 2009) on the same night with a calibration that agrees to better than 0.1 mag. Hence, the and colours suggest that this candidate is a good mid- to late-T dwarf suitable for spectroscopic follow-up.
In addition to the IAC80 optical follow-up, we targeted the most interesting of our targets with the Sloan filter available on the Laica instrument mounted on the prime focus of the Calar Alto 3.5-m telescope (Director’s Discretionary Time). This target was too faint for the IAC80 telescope. Laica uses a 22 mosaic of 40964096 CCDs pixels offering a field-of-view of 44.36 arcmin square with a 0.224 arcsec pixel scale. The night of 12 May 2011 was not photometric because of clouds passing by, but the seeing was below 1 arcsec during the observations. We took 18 images of 100 sec with a manual dither pattern, yielding a combined image of 30 min. The known T7 dwarf, SDSS J150411.63102718.4 (Chiu et al., 2006), was observed with the same set-up to photometrically calibrate the Laica images with all stars present in that Sloan calibration field. The data reduction was standard for optical imaging. The target is not detected down to a 3 detection limit of = 21.9 mag (AB system), implying a colour redder than 2.76 mag, which classified this object as a potential T dwarf (Hawley et al., 2002; Pinfield et al., 2008; Schmidt et al., 2010).
3.2 Near-infrared photometry
We conducted near-infrared photometry with Omega2000 on the Calar Alto 3.5-m telescope to detect the most interesting-looking candidate in the -band (VHS 5 limit is 18.710.40 mag) and confirm its T dwarf status through methane imaging.
Omega2000 employs a HAWAII-2 20482048 pixel detector sensitive in the 1–2.5 micron wavelength range with a pixel size of 0.45 arcsec, yielding a field-of-view of 15.4 by 15.4 arcmins (Kovács et al., 2004).
We imaged VHS J143311.46083736.3 on 22 June 2011 with Omega2000 for 90 min in methane off (central wavelength is 1.579 microns with a full-width-at-half-maximum of 0.101 microns) and 30 min in on 23 June 2011 (between 20h30 till 21h10 UT at an airmass of 1.12) along with a SDSS T7 dwarf (SDSS J150411.63102718.4 (T7); = 16.909; Chiu et al., 2006) as reference for photometric calibration at an airmass of 1.45. The total exposure time was divided into five-point dither patterns with individual on-source integrations of 610s and 320s in and methane off (CH4off), respectively, for both sources. The presence of clouds during the first night hampered the methane observations of our T dwarf candidate, resulting in 50 min worth of data instead of the 90 min on-target. The second night was also not photometric, with variations in the level of the sky of up to 40%. The seeing on the combined -band and methane images of VHS J143311.46083736.3 was 0.6–0.9 and 1–1.3 arcsec, respectively. The total exposure times in and methane for SDSS J150411.63102718.4 were set to 5 and 20 min, respectively.
We reduced the near-infrared data in a standard manner under the IRAF333IRAF is distributed by the National Optical Astronomy Observatory, which is operated by the Association of Universities for Research in Astronomy (AURA) under cooperative agreement with the National Science Foundation environment. Series of five dithered positions were observed in each filter: for each position in each filter, we subtracted a median of the other four frames used to create a sky frame and then divided by the normalised combined dome flat (ON OFF exposures). Then, we averaged the five frames of each cube with a ccdclip rejection algorithm and again averaged the various cubes to create a final combined image for both sources in both filters.
We calibrated astrometrically the Omega2000 images with the astrometry.net package444More details at astrometry.net, which requires the centre of the image given by the (RA,dec) coordinates in sexagesimal format, the pixel scale (0.45 arcsec/pixel with an allowance of 0.03 arcsec/pixel), and a radius for the search (set to 30 arcmin, i.e. twice the field-of-view of Omega2000 images). We found that the astrometric solution was satisfactory and of good quality for our purposes, comparing with 2MASS (Cutri et al., 2003; Skrutskie et al., 2006), the UKIDSS Large Area Survey catalogue (Lawrence et al., 2007) for SDSS J150411.63102718.4, and the VHS database for VHS J143311.46083736.3.
We extracted the photometry of our targets with the GAIA tool555GAIA — the Graphical Astronomy and Image Analysis Tool — is a derivative of the Skycat catalogue and image display tool, developed as part of the VLT project at ESO. Skycat and GAIA are free software under the terms of the GNU copyright. See http://star-www.dur.ac.uk/pdraper/gaia/ for more details, which itself uses SExtractor (Bertin & Arnouts, 1996). We ran the detection algorithm to extract all sources whose flux was at least 2 above the threshold and detection background. We calibrated photometrically the images of the template T dwarf and our target with the UKIDSS and VHS images, respectively, because they have more sources in common and higher photometric accuracy than 2MASS. We found a difference of 0.14 mag between the zero points in the -band for both objects. We derived a revised magnitude of = 16.7680.024 mag for SDSS J150411.63102718.4, compared to the upper limit of = 16.91 mag from 2MASS (Chiu et al., 2006). We detected VHS J143311.46083736.3 on the Omega2000 combined images and inferred = 19.220.14 mag. We calibrated photometrically the methane photometry by comparing with the photometry and assuming that the –CH4off colour should be neutral. We inferred colours of 0.450.03 mag (5 detection) and 0.670.20 (1.8 confidence) for SDSS J150411.63102718.4 and VHS J143311.46083736.3, respectively. We emphasise that our T dwarf candidate is one of the faintest objects on the image, resulting in a poor detection in both filters. Nonetheless, the high value for the –CH4off colour of our candidate suggests a spectral type of T7 or later (Goldman et al., 2010).
4 Spectroscopic follow-up
In this section, we describe the near-infrared spectroscopic follow-up conducted with VLT/X-shooter and Magellan/FIRE.
4.1 VLT X-shooter
We obtained spectroscopic observations for two candidate VHS T dwarfs with X-shooter on the Very Large Telescope on 5 and 8 June 2011, under the ESO programme 087.C-0639(A). We used the echelle slit mode, which covers the wavelength range 300–2500nm. This is split into three separate arms, the UVB (ultraviolet; 300–550nm), VIS (visible; 550–1000nm) and NIR (near-infrared; 1000–2500nm). Using slit widths of 1.0 arcsec for the UVB arm and 0.9 arcsec for the VIS and NIR arms, the resolution of the VIS and NIR arms are R = 8800 and R = 5600, respectively. We took four individual integrations in an ABBA pattern, totalling to integration times of 920s in the UVB arm, 1200s in the VIS arm and 1560s in the NIR arm for VHS J162208.9095934.6666This object was independently published by Kirkpatrick et al. (2011) and classified as T6. and 1720s in the UVB arm, 2000s in the VIS arm and 2360s in the NIR arm for VHS J92934.1442550.5. We note that we do not expect any significant flux in the UVB wavelength range for members of our sample and therefore we do not show the details for this arm. We observed telluric standard stars before or after every target at similar airmass. Sky flats and arc frames were also taken at the beginning of every night.
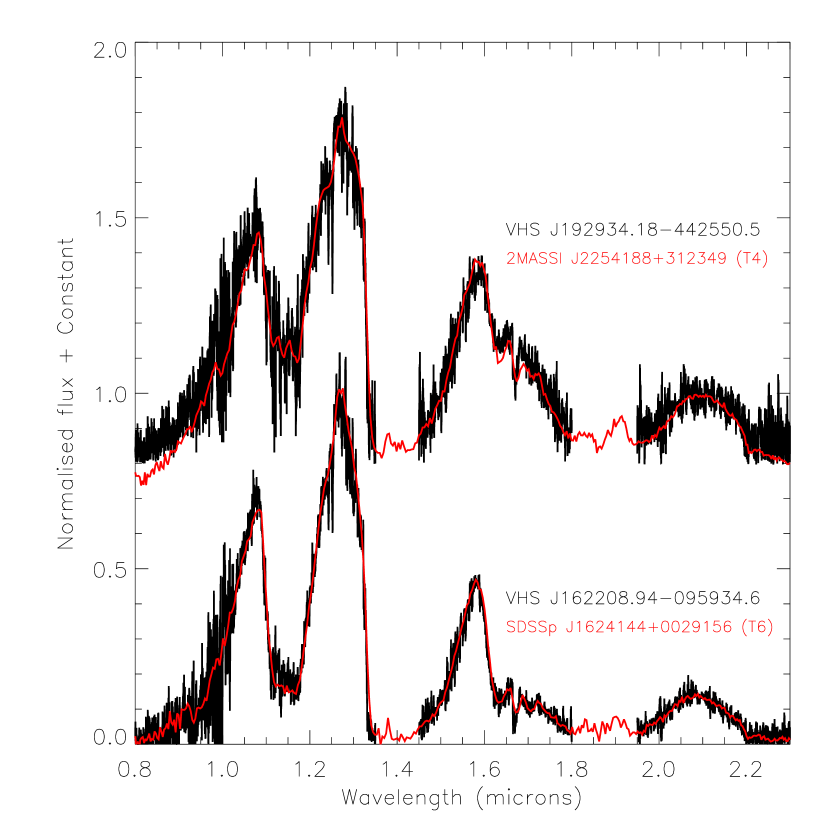
The data were reduced using the ESO X-shooter pipeline (version 1.3.7). The pipeline removes non-linear pixels, subtracts the bias (in the VIS arm) or dark frames (in the NIR arm) and divides the raw frames by flat fields. Images are pair-wise subtracted to remove sky background. The pipeline then extracts and merges the different orders in each arm, rectifying them using a multi-pinhole arc lamp (taken during the day-time calibration) and corrects for the flexure of the instrument using single-pinhole arc lamps (taken at night, one for each object observed). Telluric stars are reduced in the same way, except that sky subtraction was performed by fitting the background (as tellurics are not observed in nodding mode). The spectra were telluric-corrected and flux-calibrated using IDL routines, following a standard procedure: first the telluric spectrum is cleared of HI absorption lines (by interpolating over them) and scaled to match the measured magnitudes; then it is divided by a blackbody curve for the appropriate temperature to obtain the instrumentatmosphere response curve; finally the target spectra is multiplied by the response curve obtained to flux-calibrate it. The arms (VIS and NIR) were then merged by matching the flux level in the overlapping regions between them. Finally, each spectrum was visually inspected to check for possible problems during the extraction or merging stage. The final reduced spectra are displayed in black in Fig. 3 along with spectral templates to assign spectral types visually (Burgasser et al., 2004, 2006a).
4.2 Magellan/FIRE
The Folded port InfraRed Echellette (FIRE) spectrograph (Simcoe et al., 2008, 2010) mounted on the Baade 6.5m Magellan telescope and Las Campanas Observatory was used to obtained near-infrared spectroscopy for four VHS T dwarf candidates. VHS J205159385508439 was observed on 17 August 2011 with a 1 arcsec slit in prism mode. VHS J125804894412324, VHS J143311460837363, and VHS J154352780439096 were all observed on the 6 March 2012, using a 0.8 arcsec slit, also in prism mode. Both set-ups deliver similar R 200–300. All science observations were obtained using the sample up the ramp (SUTR) detector read-out mode. Telluric standard stars of type A0V were observed at similar airmass to the science targets and arc frames were taken in situ.
The data were reduced using the low-dispersion version of the FIREHOSE pipeline, which is based on the MASE pipeline developed for the Magellan Echellette optical spectrograph (Bochanski et al., 2009; Simcoe et al., 2010). The pipeline uses a flat field constructed from two quartz lamp images taken with the lamp at high (2.5 V) and low (1.5 V) voltage settings. The data were divided by this pixel flat before they were wavelength calibrated, and the object spectra identified. The pipeline performs sky subtraction following the method outlined in Bochanski et al. (2011), adapted for the low-dispersion configuration of the spectrograph. The spectra were optimally extracted before being combined using an adaptation of the xcombspec routine from SpexTool (Cushing et al., 2004). The T dwarf spectra were then corrected for telluric absorption and flux-calibrated using a FIRE specific version of the xtellcor routine (Vacca et al., 2003). Finally, residual outlying points caused by cosmic rays were removed using a simple sigma-clipping algorithm.
5 Properties of the new T dwarfs
In this section, we assign spectral types to the new T dwarfs and derive their spectroscopic distances.
| VHS J… | H20J (SpT) | CH4J (SpT) | Wj (SpT) | H2OH (SpT) | CH4H (SpT) | NH3H (SpT) | CH4K (SpT) | K/J |
|---|---|---|---|---|---|---|---|---|
| 125804.89441232.4 | 0.1550.001 (T6) | 0.2770.001 (T7) | 0.4510.001 (T7) | 0.2950.002 (T6) | 0.3520.002 (T6) | 0.6940.003 (T7.5) | 0.1730.004 (T6) | 0.1540.001 |
| 143311.46083736.3 | 0.0270.006 (T7) | 0.1470.003 (T7) | 0.2990.003 (T8) | 0.0600.010 (T9) | 0.1790.007 (T7) | 0.5620.010 (T8–T9) | 0.1310.038 (T6–T7) | 0.0870.003 |
| 154352.78043909.6 | 0.2940.003 (T5) | 0.4300.002 (T5) | 0.6080.002 (T7) | 0.3640.004 (T5) | 0.5180.003 (T4) | 0.7800.005 (T7.5) | 0.2740.006 (T4) | 0.1950.001 |
| 162208.94095934.6 | 0.1900.089 (T5–T6) | 0.3330.055 (T6) | 0.4880.151 (T7) | 0.3040.032 (T6) | 0.2920.030 (T6) | 0.7050.066 (T7.5) | 0.1790.213 (T5–T6) | 0.1520.017 |
| 192934.18442550.5 | 0.3420.354 (T3–T5) | 0.4640.770 (T4) | 0.6401.164 (T7) | 0.3940.021 (T4) | 0.6310.031 (T3) | 0.7500.067 (T7.5) | 0.3980.061 (T3) | 0.2120.144 |
5.1 Spectral types
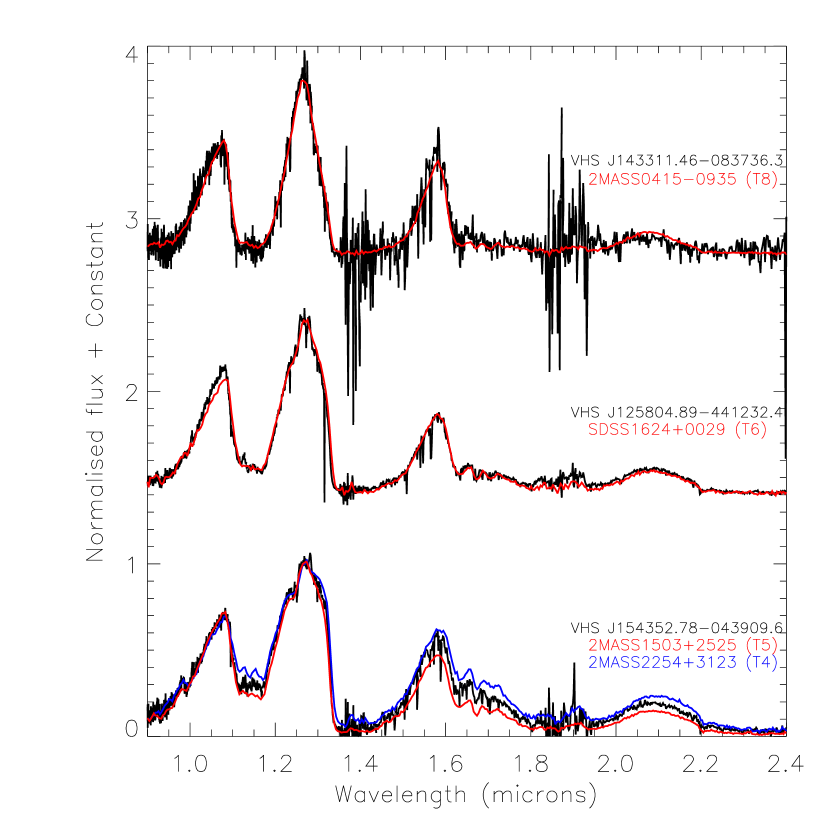
We derived spectral types for our new T dwarfs using templates available in the literature. We used the database of T dwarf templates777Data available at http://pono.ucsd.edu/adam/browndwarfs/spexprism/ from the 0.8-5.5 Micron Medium-Resolution Spectrograph and Imager (SpeX) on the 3-m NASA Infrared Telescope Facility (IRTF) to estimate spectral types for our targets with an uncertainty of half a subclass. These templates were selected from a sample of 43 T dwarfs (known at that time) as part of the unified near-infrared classification scheme designed by Burgasser et al. (2006b). We compared the VLT/X-shooter and Magellan/FIRE spectra of our objects to the following T dwarfs observed with IRTF/SpeX (Figs 4 and 3): 2MASSI J2254188312349, 2MASS J15031961+2525196, 2MASSI J0415195-093506 (T4, T5, and T8; Burgasser et al., 2004) and SDSSp J162414.37+002915.6 (T6; Burgasser et al., 2006a). Adopted spectral types, accurate to half a subclass, are listed in Table LABEL:tab_VHS_dT:tab_new_dT.
Finally, we note that we adopted a spectral type of T6.00.5 for VHS J162208.9095934.6, in agreement with Kirkpatrick et al. (2011). All new VHS T dwarfs agree well with the SpeX spectral templates. The only exception may be VHS J125804.89441232.4, whose flux in the -band is above the T6 standard (Strauss et al., 1999; Tinney et al., 2003; Burgasser et al., 2006b). The -band is probing lower layers of the atmospheres so an increased flux at these wavelengths may indicate the presence of less dust or decreased opacity. A lower metallicity could also be responsible for the increased flux in the -band, in agreement with the low-metallicity trends seen in other T dwarfs (Burgasser et al., 2010a; Kirkpatrick et al., 2011).
Moreover, we present near-infrared spectral typing flux ratios for five of our T dwarfs (Table LABEL:tab_VHS_dT:tab_ratios), following definitions described in Burgasser et al. (2006b), Warren et al. (2007), and Delorme et al. (2008a). The spectral types derived from those spectral indices agree well with our spectral classification from the direct comparison with T dwarf templates. We note that no spectral types are derived from the K/J ratio because Burgasser et al. (2006b) noted a high dispersion in this ratio, suggesting that gravity and metallicity should be incoporated in a future classification scheme (Kirkpatrick et al., 2008; Cruz et al., 2009). Furthermore, the Wj and NH3H ratios defined by Warren et al. (2007) and Delorme et al. (2008a), resepctively, are mainly designed for T dwarfs later than T7.5–T8, placing little constraints on our five new T dwarfs with earlier spectral types but working fairly well for VHS J143311.46083736.3.
5.2 Spectroscopic distances
Several spectral type vs absolute magnitude relations have been proposed over the years and improved progressively with the larger number of L and T dwarfs with parallaxes. In this paper, we use the latest relations between magnitudes and spectral types in the L0–T8 range based on trigonometric parallaxes as derived by Faherty et al. (2012) in their Table 7. The dispersion for these relations range from 0.27 (-band) to 0.3 (-band). Earlier relations can be found in Dahn et al. (2002), Tinney et al. (2003) Vrba et al. (2004), Liu et al. (2006), Marocco et al. (2010), and Kirkpatrick et al. (2012). We should point out that the parallax of 2MASSI J0415195093506 (Vrba et al., 2004) is best reproduced by the relations in Faherty et al. (2012), with the Marocco et al. (2010) relations producing a result that is 6.3% too low.
With these relations, we derive absolute magnitudes of = 14.6320.093, 14.7250.121, 15.1990.243, 15.7380.355, and 16.5150.422 mag for T4, T4.5, T6, T7, and T8 dwarfs, respectively. The uncertainty is the upper limit on the error, assuming an accuracy of 0.5 spectral type. We estimated the spectroscopic distance of 2MASSI J0415195093506 (Burgasser et al., 2002) to be 5.831.26 pc, in agreement within the error bars with its trigonometric distance (5.7360.092 pc; Vrba et al., 2004). We derived distances within 25 pc for three of our T dwarfs, VHS J125804.9441232.4 (T6), VHS J162208.9095934.6 (T6), and VHS J154352.8043909.6 (T4.5), hence adding three new T dwarfs in the solar vicinity. The remaining T dwarfs are farther away in the 30–50 pc range. VHS J205159.4550843.9 is the faintest of all T7 dwarfs published to date in the -band with = 19.2800.083 mag, suggesting that it is the most distant of its spectral class. The record holder was ULAS J134940.81091833.3 with = 19.16 mag (Burningham et al., 2010b) although another T7 dwarf was classified photometrically (i.e. no spectrum available yet) as a T7 and is two magnitudes fainter with = 20.1430.040 mag (Lodieu et al., 2009b).
All numbers and results discussed above are summarised in Table LABEL:tab_VHS_dT:tab_new_dT. We assumed that the new T dwarfs are single, keeping in mind that the binary fraction of late-L/early-T (known as transition objects) and T dwarfs is about 31% and 14%, respectively (Burgasser et al., 2007; Looper et al., 2008; Goldman et al., 2008). Moreover, we assumed that the near-infrared extinction is negligible along the line of sight of our T dwarfs.
5.3 Proper motion measurements
Proper motion measurements for our candidates turned out to be difficult because the epoch difference between the VHS DR1 and WISE data is only about a few months. However, for three brighter candidates (Table LABEL:tab_VHS_dT:tab_new_dT) we succeded in measuring their proper motions after searching via the CDS888http://vizier.u-strasbg.fr/cgi-bin/VizieR and finding faint counterparts in 2MASS (Skrutskie et al., 2006) observed about 11 years before VHS and WISE. Two of them (VHS J125804.9441232.4 and VHS J154352.8043909.6) have only -band detections in 2MASS, whereas VHS J162208.9095934.6 was detected in both the 2MASS - and -bands. In addition, we identified one of them VHS J125804.9441232.4 with a -only detection in DENIS (Epchtein et al., 1997), about three years earlier than 2MASS.
For our proper motion solutions listed in Tab. LABEL:tab_VHS_dT:tab_new_dT we applied a weighted linear fitting over all available multi-epoch positions (), a method similar to that of Scholz et al. (2012). We assumed 70 mas errors for the individual VHS DR1 positions taken from the catalogues in the VISTA Science Archive and 150 mas errors for the faint object detections in 2MASS and DENIS. For the VHS we expect similar astrometric errors to those of UKIDSS, varying between 50 and 100 mas depending on Galactic latitude (Lawrence et al., 2007). For 2MASS and DENIS, we assumed those astrometric errors based on former estimates by Scholz et al. (2012), Liu et al. (2011), and Kirkpatrick et al. (2011). For the WISE all-sky release positions of VHS J125804.9441232.4 and VHS J154352.8043909.6 we used the positional errors given by WISE (about 100 and 350 mas, respectively)999We favoured the WISE all-sky release for the proper motion determination.. In case of VHS J162208.9095934.6 we preferred to use the two-epoch positions from WISE with their errors (150–170 mas) as given in Kirkpatrick et al. (2011), who also provided two additional epoch positions from Spitzer (with errors of 130–210 mas) that we also included in our proper motion fitting. Our proper motions for VHS J162208.9095934.6 are consistent with those of Kirkpatrick et al. (2011), but about twice as precise.
We also tried to obtain proper motions for the other candidates, including VHS J023756.2063142.9 with its assumed SDSS DR8 counterpart and VHS J1433114083736.3 with its additional Omega2000 position, but failed to determine consistent results. Therefore, we assume that the SDSS counterpart of VHS J023756.2063142.9 may be wrong, whereas the proper motion of VHS J1433114083736.3 is probably shorter than about 50 mas/yr.
6 Conclusions
We have presented the near-infrared spectra of six new T dwarfs identified in 675 square degrees common to the southern sky imaged by the VISTA Hemisphere Survey and the Wide Field Infrared Survey Explorer satellite. One of them was independently reported as a T6 dwarf while another one was known previously. The other sources remain photometric T dwarf candidates because we could not obtain near-infrared spectroscopy yet. Three confirmed T dwarfs lie within the solar vicinity, i.e. within the 25 pc limit. The only T7 dwarf in our sample has the faintest -band magnitude of all T7 dwarfs published to date. We also improved the proper motion measurements of the brightest T dwarfs with data from various public surveys.
We have shown the potential of the VHS in complementing mid-infrared photometry from the WISE mission, but we stress that an all-sky optical ( and/or ) survey of the entire southern sky would optimize our searches significantly, as is the case for UKIDSS with the Sloan coverage. We plan to expand our searches to the WISE all-sky release and the ever increasing area of the sky imaged by VHS up to its completion to (1) discover cool brown dwarfs, in particular the Y dwarfs recently announced by Cushing et al. (2011) and Kirkpatrick et al. (2012), (2) provide a magnitude-limited census of T dwarfs over the entire southern sky at completion of the VHS public survey, (3) discover gravity/metallicity benchmarks (e.g. Pinfield et al., 2012), (4) constrain the field mass function at low temperatures with high accuracy (Kroupa, 2002; Chabrier, 2003) as attempted by several groups with large-scale surveys (Metchev et al., 2008; Burningham et al., 2010b; Reylé et al., 2010; Kirkpatrick et al., 2012).
Acknowledgements.
NL was funded by the Ramón y Cajal fellowship number 08-303-01-02 and the national program AYA2010-19136 funded by the Spanish ministry of science and innovation. ADJ is supported by a FONDECYT Postdoctorado under project number 3100098. ADJ is also partially supported by the Joint Committee ESO-Government of Chile. JJ is also supported by a FONDECYT postdoctorado fellowship (project number 3110004). ADJ and MTR acknowledge the support of the grant from CONICYT and the partial support from Center for Astrophysics FONDAP and Proyecto Basal PB06 (CATA). This research has been supported by the Spanish Ministry of Economics and Competitiveness and the “Fondo Europeo de Desarrollo Regional” FEDER under the project AYA2010-21308-C03-02, AYA2010-21308-C03-03, and AYA2010-20535. PC is funded by RoPACS. NL, ADJ, and DP have received funding from RoPACS. Based on observation obtained as part of the VISTA Hemisphere Survey, ESO Progam, 179.A-2010 (PI: McMahon). The VISTA Data Flow System pipeline processing and science archive are described in Irwin et al. (2004) and Hambly et al. (2008). We have used data from the first data release, which is described in detail in McMahon et al. (2012). We are grateful to the Cambridge Astronomy Survey Unit and the VISTA Science Archive at the Wide Field Astronomy Unit, Edinburgh, for providing us with the reduced data and catalogues. This article is based on observations made with the 0.82-m IAC80 telescope operated on the island of Tenerife by the IAC in the Spanish Observatorio del Teide. Based on data obtained with the Omega2000 wide-field camera installed on the Calar Alto 3.5-m telescope. The X-Shooter spectroscopy is based on observations made with ESO telescopes at the La Silla Paranal Observatory under programme ID 089.C-0854 in visitor mode. This paper includes data gathered with the 6.5 meter Magellan Telescopes located at Las Campanas Observatory, Chile. This research has made use of the Simbad and Vizier databases, operated at the Centre de Données Astronomiques de Strasbourg (CDS), and of NASA’s Astrophysics Data System Bibliographic Services (ADS). This publication makes use of data products from the Two Micron All Sky Survey (2MASS), which is a joint project of the University of Massachusetts and the Infrared Processing and Analysis Center/California Institute of Technology, funded by the National Aeronautics and Space Administration and the National Science Foundation. Funding for the SDSS and SDSS-II has been provided by the Alfred P. Sloan Foundation, the Participating Institutions, the National Science Foundation, the U.S. Department of Energy, the National Aeronautics and Space Administration, the Japanese Monbukagakusho, the Max Planck Society, and the Higher Education Funding Council for England. The SDSS Web Site is http://www.sdss.org/. The SDSS is managed by the Astrophysical Research Consortium for the Participating Institutions. The Participating Institutions are the American Museum of Natural History, Astrophysical Institute Potsdam, University of Basel, University of Cambridge, Case Western Reserve University, University of Chicago, Drexel University, Fermilab, the Institute for Advanced Study, the Japan Participation Group, Johns Hopkins University, the Joint Institute for Nuclear Astrophysics, the Kavli Institute for Particle Astrophysics and Cosmology, the Korean Scientist Group, the Chinese Academy of Sciences (LAMOST), Los Alamos National Laboratory, the Max-Planck-Institute for Astronomy (MPIA), the Max-Planck-Institute for Astrophysics (MPA), New Mexico State University, Ohio State University, University of Pittsburgh, University of Portsmouth, Princeton University, the United States Naval Observatory, and the University of Washington. This publication makes use of data products from the Wide-field Infrared Survey Explorer, which is a joint project of the University of California, Los Angeles, and the Jet Propulsion Laboratory/California Institute of Technology, funded by the National Aeronautics and Space Administration.References
- Albert et al. (2011) Albert, L., Artigau, É., Delorme, P., et al. 2011, AJ, 141, 203
- Bastian et al. (2010) Bastian, N., Covey, K. R., & Meyer, M. R. 2010, ARA&A, 48, 339
- Bate (2009) Bate, M. R. 2009, MNRAS, 392, 590
- Bate (2012) Bate, M. R. 2012, MNRAS, 419, 3115
- Bertin & Arnouts (1996) Bertin, E. & Arnouts, S. 1996, A&AS, 117, 393
- Bochanski et al. (2011) Bochanski, J. J., Burgasser, A. J., Simcoe, R. A., & West, A. A. 2011, AJ, 142, 169
- Bochanski et al. (2009) Bochanski, J. J., Hennawi, J. F., Simcoe, R. A., et al. 2009, PASP, 121, 1409
- Burgasser (2004) Burgasser, A. J. 2004, ApJS, 155, 191
- Burgasser et al. (2006a) Burgasser, A. J., Burrows, A., & Kirkpatrick, J. D. 2006a, ApJ, 639, 1095
- Burgasser et al. (2006b) Burgasser, A. J., Geballe, T. R., Leggett, S. K., Kirkpatrick, J. D., & Golimowski, D. A. 2006b, ApJ, 637, 1067
- Burgasser et al. (2002) Burgasser, A. J., Kirkpatrick, J. D., Brown, M. E., et al. 2002, ApJ, 564, 421
- Burgasser et al. (1999) Burgasser, A. J., Kirkpatrick, J. D., Brown, M. E., et al. 1999, ApJL, 522, L65
- Burgasser et al. (2010a) Burgasser, A. J., Looper, D., & Rayner, J. T. 2010a, AJ, 139, 2448
- Burgasser et al. (2004) Burgasser, A. J., McElwain, M. W., Kirkpatrick, J. D., et al. 2004, AJ, 127, 2856
- Burgasser et al. (2007) Burgasser, A. J., Reid, I. N., Siegler, N., et al. 2007, in Protostars and Planets V, ed. B. Reipurth, D. Jewitt, & K. Keil, 427–441
- Burgasser et al. (2010b) Burgasser, A. J., Simcoe, R. A., Bochanski, J. J., et al. 2010b, ApJ, 725, 1405
- Burningham et al. (2010a) Burningham, B., Leggett, S. K., Lucas, P. W., et al. 2010a, MNRAS, 404, 1952
- Burningham et al. (2008) Burningham, B., Pinfield, D. J., Leggett, S. K., et al. 2008, MNRAS, 391, 320
- Burningham et al. (2009) Burningham, B., Pinfield, D. J., Leggett, S. K., et al. 2009, MNRAS, 395, 1237
- Burningham et al. (2010b) Burningham, B., Pinfield, D. J., Lucas, P. W., et al. 2010b, MNRAS, 406, 1885
- Chabrier (2003) Chabrier, G. 2003, PASP, 115, 763
- Chiu et al. (2006) Chiu, K., Fan, X., Leggett, S. K., et al. 2006, AJ, 131, 2722
- Chiu et al. (2008) Chiu, K., Liu, M. C., Jiang, L., et al. 2008, MNRAS, 385, L53
- Cruz et al. (2009) Cruz, K. L., Kirkpatrick, J. D., & Burgasser, A. J. 2009, AJ, 137, 3345
- Cushing et al. (2011) Cushing, M. C., Kirkpatrick, J. D., Gelino, C. R., et al. 2011, ApJ, 743, 50
- Cushing et al. (2004) Cushing, M. C., Vacca, W. D., & Rayner, J. T. 2004, PASP, 116, 362
- Cutri et al. (2003) Cutri, R. M., Skrutskie, M. F., van Dyk, S., et al. 2003, 2MASS All Sky Catalog of point sources, 2246
- Dahn et al. (2002) Dahn, C. C., Harris, H. C., Vrba, F. J., et al. 2002, AJ, 124, 1170
- Dalton et al. (2006) Dalton, G. B., Caldwell, M., Ward, A. K., et al. 2006, in Presented at the Society of Photo-Optical Instrumentation Engineers (SPIE) Conference, Vol. 6269, Society of Photo-Optical Instrumentation Engineers (SPIE) Conference Series
- Deacon et al. (2011) Deacon, N. R., Liu, M. C., Magnier, E. A., et al. 2011, AJ, 142, 77
- Deacon et al. (2012a) Deacon, N. R., Liu, M. C., Magnier, E. A., et al. 2012a, ApJ, 757, 100
- Deacon et al. (2012b) Deacon, N. R., Liu, M. C., Magnier, E. A., et al. 2012b, ApJ, 755, 94
- Delorme et al. (2008a) Delorme, P., Delfosse, X., Albert, L., et al. 2008a, A&A, 482, 961
- Delorme et al. (2008b) Delorme, P., Willott, C. J., Forveille, T., et al. 2008b, A&A, 484, 469
- Emerson (2001) Emerson, J. P. 2001, in Astronomical Society of the Pacific Conference Series, Vol. 232, The New Era of Wide Field Astronomy, ed. R. Clowes, A. Adamson, & G. Bromage, 339
- Emerson et al. (2004) Emerson, J. P., Sutherland, W. J., McPherson, A. M., et al. 2004, The Messenger, 117, 27
- Epchtein et al. (1997) Epchtein, N., de Batz, B., & Capoani, L. e. 1997, The Messenger, 87, 27
- Faherty et al. (2012) Faherty, J. K., Burgasser, A. J., Walter, F. M., et al. 2012, ApJ, 752, 56
- Fukugita et al. (1996) Fukugita, M., Ichikawa, T., Gunn, J. E., et al. 1996, AJ, 111, 1748
- Goldman et al. (2008) Goldman, B., Bouy, H., Zapatero Osorio, M. R., et al. 2008, A&A, 490, 763
- Goldman et al. (2010) Goldman, B., Marsat, S., Henning, T., Clemens, C., & Greiner, J. 2010, MNRAS, 405, 1140
- Hambly et al. (2008) Hambly, N. C., Collins, R. S., Cross, N. J. G., et al. 2008, MNRAS, 384, 637
- Hawley et al. (2002) Hawley, S. L., Covey, K. R., Knapp, G. R., et al. 2002, AJ, 123, 3409
- Hewett et al. (2006) Hewett, P. C., Warren, S. J., Leggett, S. K., & Hodgkin, S. T. 2006, MNRAS, 367, 454
- Irwin et al. (2004) Irwin, M. J., Lewis, J., Hodgkin, S., et al. 2004, in Optimizing Scientific Return for Astronomy through Information Technologies. Edited by Quinn, Peter J.; Bridger, Alan. Proceedings of the SPIE, Volume 5493, pp. 411-422 (2004)., ed. P. J. Quinn & A. Bridger, 411–422
- Kendall et al. (2007) Kendall, T. R., Tamura, M., Tinney, C. G., et al. 2007, A&A, 466, 1059
- Kirkpatrick (2005) Kirkpatrick, J. D. 2005, ARA&A, 43, 195
- Kirkpatrick et al. (2008) Kirkpatrick, J. D., Cruz, K. L., Barman, T. S., et al. 2008, ApJ, 689, 1295
- Kirkpatrick et al. (2011) Kirkpatrick, J. D., Cushing, M. C., Gelino, C. R., et al. 2011, ApJS, 197, 19
- Kirkpatrick et al. (2012) Kirkpatrick, J. D., Gelino, C. R., Cushing, M. C., et al. 2012, ApJ, 753, 156
- Kirkpatrick et al. (1999) Kirkpatrick, J. D., Reid, I. N., Liebert, J., et al. 1999, ApJ, 519, 802
- Kovács et al. (2004) Kovács, Z., Mall, U., Bizenberger, P., Baumeister, H., & Röser, H. 2004, in Society of Photo-Optical Instrumentation Engineers (SPIE) Conference Series, Vol. 5499, Society of Photo-Optical Instrumentation Engineers (SPIE) Conference Series, ed. J. D. Garnett & J. W. Beletic, 432–441
- Kroupa (2002) Kroupa, P. 2002, Science, 295, 82
- Landolt (2009) Landolt, A. U. 2009, AJ, 137, 4186
- Lawrence et al. (2007) Lawrence, A., Warren, S. J., Almaini, O., et al. 2007, MNRAS, 379, 1599
- Leggett et al. (2009) Leggett, S. K., Cushing, M. C., Saumon, D., et al. 2009, ApJ, 695, 1517
- Leggett et al. (2000) Leggett, S. K., Geballe, T. R., Fan, X., et al. 2000, ApJL, 536, L35
- Leggett et al. (2007) Leggett, S. K., Saumon, D., Marley, M. S., et al. 2007, ApJ, 655, 1079
- Leggett et al. (2012) Leggett, S. K., Saumon, D., Marley, M. S., et al. 2012, ApJ, 748, 74
- Liebert & Gizis (2006) Liebert, J. & Gizis, J. E. 2006, PASP, 118, 659
- Liu et al. (2011) Liu, M. C., Deacon, N. R., Magnier, E. A., et al. 2011, ApJL, 740, L32
- Liu et al. (2006) Liu, M. C., Leggett, S. K., Golimowski, D. A., et al. 2006, ApJ, 647, 1393
- Lodieu et al. (2009a) Lodieu, N., Burningham, B., Hambly, N. C., & Pinfield, D. J. 2009a, MNRAS, 397, 258
- Lodieu et al. (2009b) Lodieu, N., Dobbie, P. D., Deacon, N. R., Venemans, B. P., & Durant, M. 2009b, MNRAS, 395, 1631
- Lodieu et al. (2007) Lodieu, N., Pinfield, D. J., Leggett, S. K., et al. 2007, MNRAS, 379, 1423
- Looper et al. (2008) Looper, D. L., Gelino, C. R., Burgasser, A. J., & Kirkpatrick, J. D. 2008, ApJ, 685, 1183
- Lucas et al. (2010) Lucas, P. W., Tinney, C. G., Burningham, B., et al. 2010, MNRAS, L124
- Mainzer et al. (2011) Mainzer, A., Cushing, M. C., Skrutskie, M., et al. 2011, ApJ, 726, 30
- Marocco et al. (2010) Marocco, F., Smart, R. L., Jones, H. R. A., et al. 2010, A&A, 524, A38
- Metchev et al. (2008) Metchev, S. A., Kirkpatrick, J. D., Berriman, G. B., & Looper, D. 2008, ApJ, 676, 1281
- Nakajima et al. (1995) Nakajima, T., Oppenheimer, B. R., Kulkarni, S. R., et al. 1995, Nat, 378, 463
- Pinfield et al. (2012) Pinfield, D. J., Burningham, B., Lodieu, N., et al. 2012, MNRAS
- Pinfield et al. (2008) Pinfield, D. J., Burningham, B., Tamura, M., et al. 2008, MNRAS, 390, 304
- Reylé et al. (2010) Reylé, C., Delorme, P., Willott, C. J., et al. 2010, A&A, 522, A112
- Schmidt et al. (2010) Schmidt, S. J., West, A. A., Hawley, S. L., & Pineda, J. S. 2010, AJ, 139, 1808
- Scholz (2010) Scholz, R.-D. 2010, A&A, 515, A92
- Scholz et al. (2011) Scholz, R.-D., Bihain, G., Schnurr, O., & Storm, J. 2011, A&A, 532, L5
- Scholz et al. (2012) Scholz, R.-D., Bihain, G., Schnurr, O., & Storm, J. 2012, A&A, 541, A163
- Simcoe et al. (2008) Simcoe, R. A., Burgasser, A. J., Bernstein, R. A., et al. 2008, in Society of Photo-Optical Instrumentation Engineers (SPIE) Conference Series, Vol. 7014, Society of Photo-Optical Instrumentation Engineers (SPIE) Conference Series
- Simcoe et al. (2010) Simcoe, R. A., Burgasser, A. J., Bochanski, J. J., et al. 2010, in Society of Photo-Optical Instrumentation Engineers (SPIE) Conference Series, Vol. 7735, Society of Photo-Optical Instrumentation Engineers (SPIE) Conference Series
- Skrutskie et al. (2006) Skrutskie, M. F., Cutri, R. M., Stiening, R., et al. 2006, AJ, 131, 1163
- Strauss et al. (1999) Strauss, M. A., Fan, X., Gunn, J. E., et al. 1999, ApJL, 522, L61
- Tinney et al. (2003) Tinney, C. G., Burgasser, A. J., & Kirkpatrick, J. D. 2003, AJ, 126, 975
- Vacca et al. (2003) Vacca, W. D., Cushing, M. C., & Rayner, J. T. 2003, PASP, 115, 389
- Vrba et al. (2004) Vrba, F. J., Henden, A. A., Luginbuhl, C. B., et al. 2004, AJ, 127, 2948
- Warren et al. (2007) Warren, S. J., Mortlock, D. J., Leggett, S. K., et al. 2007, MNRAS, 375, 213
- Wright et al. (2010) Wright, E. L., Eisenhardt, P. R. M., Mainzer, A. K., et al. 2010, AJ, 140, 1868
- Wright et al. (2012) Wright, E. L., Skrutskie, M. F., Kirkpatrick, J. D., et al. 2012, AJ