Investigating the Optical Counterpart Candidates of Four INTEGRAL Sources localized with Chandra
Abstract
We report on the optical spectroscopic follow up observations of the candidate counterparts to four INTEGRAL sources: IGR J040695042, IGR J065521146, IGR J211884901 and IGR J220146034. The candidate counterparts were determined with Chandra, and the optical observations were performed with 1.5-m RTT-150 telescope (TÜBİTAK National Observatory, Antalya, Turkey) and 2.4-m Hiltner Telescope (MDM Observatory, Kitt Peak, Arizona). Our spectroscopic results show that one of the two candidates of IGR J040695042 and the one observed for IGR J065521146 could be active late-type stars in RS CVn systems. However, according to the likelihood analysis based on Chandra and INTEGRAL, two optically weaker sources in the INTEGRAL error circle of IGR J065521146 have higher probabilities to be the actual counterpart. The candidate counterparts of IGR J211884901 are classified as an active M-type star and a late-type star. Among the optical spectra of four candidates of IGR J220146034, two show H emission lines, one is a late-type star and the other is a M type. The likelihood analysis favors a candidate with no distinguishing features in the optical spectrum. Two of the candidates classified as M type dwarfs are similar to some IGR candidates claimed to be symbiotic stars. However, some of the prominent features of symbiotic systems are missing in our spectra, and their NIR colors are not consistent with those expected for giants. We consider the IR colors of all IGR candidates claimed to be symbiotic systems and find that low resolution optical spectrum may not be enough for conclusive identification.
Subject headings:
Stars: late-type – Stars: activity – Stars: flare – binaries: symbiotics – X-rays:individuals – X-ray:binaries1. Introduction
The International Gamma-Ray Astrophysics Laboratory (INTEGRAL; Winkler et al. 2003) has discovered hundreds of new hard X-ray sources (so called “IGR” sources) at energies above 20 keV since its launch on October 2002. From over 700 sources that are listed in the 4th Bird Catalog (Bird et al., 2010), more than 400 of them are exclusively IGR sources111See http://irfu.cea.fr/Sap/IGR-Sources/ for an updated list. INTEGRAL is very successful in finding new hard X-ray sources thanks to its wide field of view, observing strategy and most importantly unique imaging capability of the ISGRI detector (Lebrun et al., 2003) with a localization accuracy of a few arcmin. However, such localization accuracy is often not enough to identify the correct optical counterparts of these sources. Without multiwavelength information, it may not be possible to understand the physical origin of the X-ray emission and type of the emitting system. To identify a unique optical or infrared counterpart, arcsecond accuracy localization of the X-ray source is required.
Our group observes the positions of IGR sources with soft X-ray telescopes such as Chandra and Swift, not only for identifying the correct counterparts, but also for producing 0.310 keV spectra that can be used to measure column densities and continuum shapes (Tomsick et al., 2006, 2009, 2012; Rodriguez et al., 2008, 2009, 2010).
From such spectroscopic and imaging efforts, it was possible to identify the nature of a large fraction of these IGR sources (Chaty et al., 2008; Butler et al., 2009; Masetti et al., 2007, 2008, 2012, and references therein). Among these sources 250 are AGN. The Galactic sources include High-Mass X-ray Binaries, Low-Mass X-ray Binaries and Cataclysmic Variables (CVs), isolated neutron star (NS) systems as well as supernova remnants and pulsar wind nebulae. Yet, the nature of one third of IGR sources has not been identified. The identifications include a low number of unexpected hard X-ray sources like RS Canes Venatici (RS CVn), and symbiotic binary systems (Bird et al., 2010; Masetti et al., 2012; Rodriguez et al., 2010), and thus searches for more such objects are warranted.
So far, there have been four IGR sources tentatively identified as RS CVn binaries (Rodriguez et al., 2010; Masetti et al., 2012; Krivonos et al., 2010), but no firm association with RS CVn systems and IGR sources exists. In general, RS CVn systems are the members of chromospherically active stars which include flare stars (dMe stars or UV Ceti stars) and T Tauri stars as well. These systems are detached binaries having emission lines of CaII H & K and H lines in their optical spectra. The components of an RS CVn system can be G–M type stars within the luminosity classes of II–V (Kogure & Leung, 2007). This type of system is known to have strong X-ray and radio emission (Barbier et al., 2005; Osten et al., 2007). They show solar like magnetic activities and flares (Haisch et al., 1990).
Symbiotic systems are long period interacting binaries consisting of a red giant star (G–M) and a hot companion surrounded by an ionized nebula (Friedjung & Viotti, 1982; Kenyon, 1986, 1990; Kenyon & Webbink, 1984). The hot component is most often a white dwarf (WD) or a disk-accreting main sequence star. On the other hand there are also systems having a NS as the compact companion (Mikołajewska et al., 1997). In general, the optical spectra of symbiotic stars have photospheric absorption features and molecular bands of the cool giant and emission lines of the HI Balmer series, HeI, HeII, [OIII] and [NeIII] which are produced in the surrounding nebula of the hot component by its intense UV radiation (Kenyon & Fernandez-Castro, 1987; Cieslinski et al., 1994). In addition, these systems can show hard, soft and supersoft X-ray emissions (Kennea et al., 2009; Muerset et al., 1997).
So far, eleven IGR sources have been suggested to be symbiotic systems according to their optical/infrared features and X-ray properties. Among those identified, the symbiotic nature of IGR J101095746 (CD57 3057; Masetti et al., 2006; Kennea et al., 2009), IGR J123496434 (RT Cru; Masetti et al. 2005; Luna & Sokoloski 2007; Kennea et al. 2009) and IGR J161942810 (Masetti et al., 2007; Ratti et al., 2010) are well determined through multiwavelength analyses. A nearby system (1.56 kpc, parallax measurement), IGR J152935609, has been classified as a symbiotic binary based on the well determined surface temperature and radius of the companion star (Tomsick et al., 2012). On the other hand, the identifications of IGR J163584726 (Nespoli et al., 2010), and IGR J174972821 (Paizis et al., 2007, 2009) as symbiotic systems are questionable. Chaty et al. (2008) suggest that IGR J163584726 could be a high mass X-ray binary. Likewise the classification of IGR J174972821 is also controversial due to the suggestion of a black hole primary (Walter et al., 2007; Paizis et al., 2007) would make the system very unusual among the known symbiotics. IGR J163934643 was also claimed to be a symbiotic system based on the -band spectrum of the candidate counterpart 2MASS J163905354642137 (Nespoli et al., 2010) which was previously classified as a BIV–V type star using its optical/IR spectral energy distribution (Chaty et al., 2008). Later, it was revealed that the refined X-ray position of IGR J163934643 was incompatible with this controversial 2MASS source (Bodaghee et al., 2012). Candidate counterparts to IGR J110986457, IGR J171973010 and 1RXS J174607.8213333 (Masetti et al., 2009, 2012, 2008) are also tentatively claimed to be late M type giants based on comparison of their optical spectra with the known symbiotic systems, but it was later shown that the tentative optical counterpart identifications of IGR J110986457 and IGR J171973010 are wrong (Tomsick et al., 2009; Luna et al., 2012). Finally, IGR J162934603 was suggested to be a candidate symbiotic system by Ratti et al. (2010) based solely on its optical/NIR photometry.
In this work, we investigated the optical candidate counterparts of four IGR sources in the 4th Bird Catalog (Bird et al., 2010) with unknown X-ray classification: IGR J040695042, IGR J065521146, IGR J211884901 and IGR J220146034. The fields of these sources were observed with Chandra, and possible optical/infrared counterparts were identified (Tomsick et al., 2012, hereafter T12). All four sources have low Galactic latitudes (see Table 1), and high extinction limits the possible counterparts mostly to relatively nearby stellar objects. We performed optical spectroscopy of bright candidates in the USNO and 2MASS catalogs, and also obtained images that were located near the brightest Chandra sources. This work is follow up of T12 that utilized Chandra to find X-ray counterparts of IGR sources for further investigations.
The paper is organized as follows. In Section 2, we summarize the observations and data reduction in the optical, in Section 3 we identify the types of optical counterpart candidates of the IGR sources, and in the final section, we discuss the possible counterparts to each IGR source, and compare the M type candidates we found with earlier tentative symbiotic identifications.
2. Observations and Data Reduction
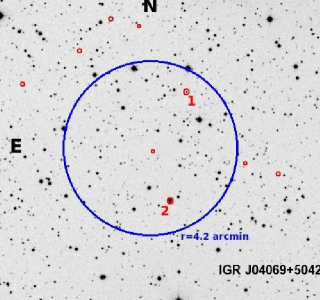
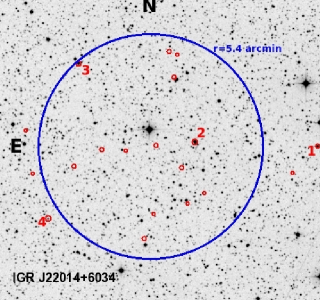
The INTEGRAL coordinates and the fluxes of the four sources we investigated are given in Table 1. The Chandra localizations (See Table 2) of the candidate counterparts allowed us to select sources to be observed at the TÜBİTAK Turkish National Observatory222http://www.tug.tubitak.gov.tr (TUG) and at the MDM Observatory. A detailed list of all detected possible Chandra counterparts and their soft X-ray properties are reported in T12. All of the X-ray sources detected by Chandra in the field of each IGR source are shown in Figure 1. We also searched the online catalogs of 2MASS, USNO-B1.0 and USNO-A2.0 to find the IR and optical counterparts associated with the Chandra positions (See Table 3).
The spectroscopic observations of candidate counterparts for IGR J040695042 and IGR J065521146 were done at the MDM Observatory, while IGR J211884901 and IGR J220146034 were observed at TUG.
2.1. TUG Observations
The medium-resolution spectra of the candidate counterparts to the sources IGR J21188+4901 and IGR J220146034 were obtained with the TÜBİTAK Faint Object Spectrometer and Camera (TFOSC) which is mounted on the Russian-Turkish 1.5 m Telescope (RTT150) located at TUG, Antalya, Turkey. The camera is equipped with a 2048 2048, 15 m pixel Fairchild 447BI CCD. It has a FOV of 13 13 with a pixel scale of 039 pixel-1. Grism #15, having an average dispersion of 3 Å pixel-1, and slit 67 m (124) were used providing a 3300–9000 Å wavelength band.
All spectroscopic data, acquired on 2011, August 27 under good weather conditions, were reduced using the Long-Slit package of MIDAS333http://www.eso.org/projects/esomidas/ to obtain 1D spectra of target sources. The spectra were corrected for bias, flat-fielded and cleaned from the cosmic-ray hits with standard MIDAS routines. Wavelength calibration of the spectra were done by Neon lamp spectrum. The heliocentric correction was applied to each spectrum after the extraction was done. The spectrophotometric standard star BD 332642 (Oke, 1990) was observed during the observing night to get the flux-calibrated spectra of the candidate counterparts.
The equivalent widths (EW) of prominent absorption and emission lines are measured by the ALICE subroutine of MIDAS.
2.2. MDM Observations
We used the OSMOS (Ohio State Multi-Object Spectrograph) with the MDM4K CCD on the 2.4 m Hiltner Telescope of the MDM Observatory on 2011 January 11 and 13. The Volume Phase Holographic (VPH) transmission grating we utilized has a 12 wide slit with a wavelength coverage of 3900-6800 Å at 3.5 Å resolution. Conditions were clear during the observing runs. Spectra of two Chandra localized X-ray sources in the INTEGRAL error circle of IGR J040695042, and of one X-ray source for IGR J065521146 were obtained. The spectral reduction was performed using standard IRAF444http://iraf.noao.edu/ routines. The flux calibration was done by Oke & Gunn (1983) standard stars. We also obtained images in the -band using the same CCD for sources that are not in the standard catalogs.
2.3. Chandra Observations
We used the Chandra observations not only for determining optical counterpart candidate positions, but also obtaining soft X-ray properties which could aid in the identification process. We fitted the Chandra 0.3–10 keV spectra with an absorbed power-law model to determine the absorbed 0.3–2 keV and 2–10 keV flux for each source. We defined the hardness ratio as . For details of spectral fitting, background subtraction and flux calculation, see T12. For soft X-ray properties relevant for this work, see Table 2.
3. Results
3.1. IGR J040695042
We performed optical spectroscopy of two possible candidates localized by Chandra within the INTEGRAL
error circle of 42.
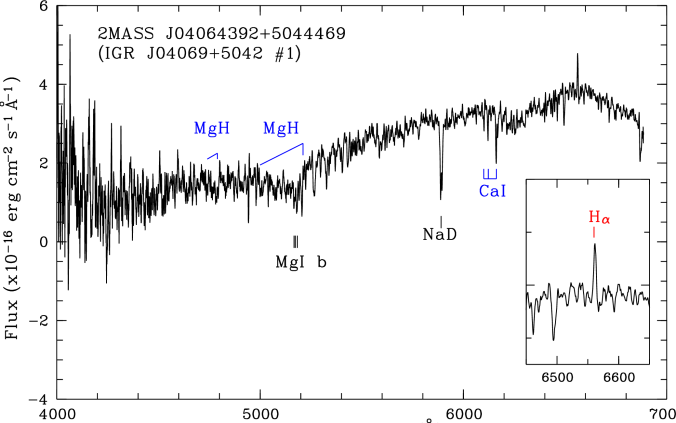
2MASS J040643925044469 (#1): The optical spectrum includes prominent absorptions of NaI D resonance lines, MgI b and CaI triplet
lines (See Fig. 2). Although distinguishing features in the classification region are mostly at the noise level,
the spectrum is very similar to the K type main sequence star HD 283916 (SAO 76803) in Jacoby et al. (1984) and to the sources
within the same class in Ross et al. (1996). Indeed the presence of MgH bands at around 4780 and 5200,
seen only in the spectra of main sequence stars, supports the luminosity classification. On the other hand a weak but noticable
H emission line (EW = 1.07 Å, see Table 4) which could be due to the chromospheric activities, stellar
winds and/or interactions with the environment of the secondary (or primary) indicates an active star. Therefore we classify this
source as a K5-7 Ve type star based on its spectral lines and EW measurements.
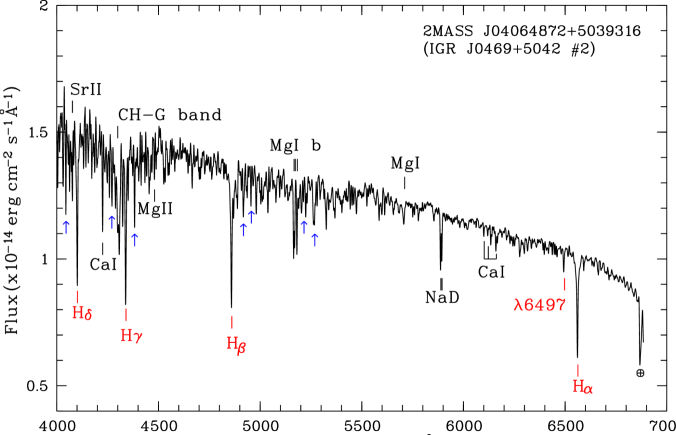
2MASS J040648725039316 (#2): The spectrum is dominated by neutral Hydrogen lines (H, H, H and H)
and several metallic lines of FeI, SrII, MgI and MgII (See Fig. 3). The CaI triplet lines that are used as luminosity
indicators are very weak (See Table. 4) as seen in the spectra of F type stars (Montes & Martín, 1998; Cayrel et al., 1996). In addition
the G band of CH at 4300 that becomes visible for the spectral types later than F4 and increases in strength with
decreasing temperature (Gray & Corbally, 2009) is one of strongest features in the blue region (4000–5000 Å) and allows us to exclude
the earlier spectral classes. Comparing the line width ratio of 4077 (SrII) to 4226 (CaI) that is a sensitive
criteria for luminosity (Morgan et al., 1943), and the EW measurements of Balmer lines (See Table 4) to the values in
Jaschek & Jaschek (1995) and in Eaton (1995) we suggest that this source could be an F5–8 type star within the luminosity class of
III–V.
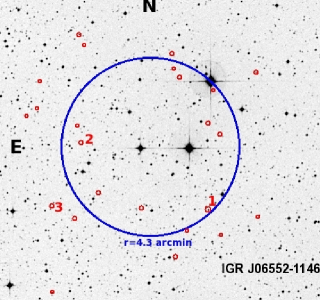
3.2. IGR J065521146
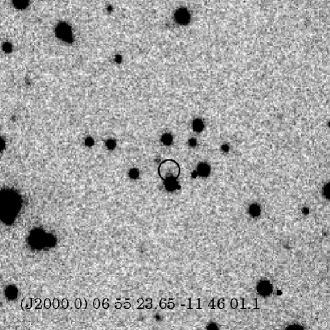
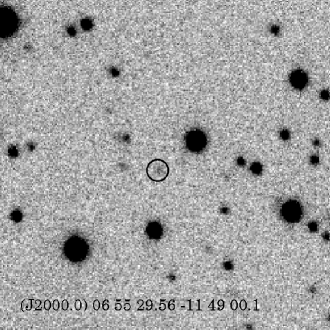
Optical spectroscopy was only obtained for candidate #1 (see Fig. 1) which is 08 away from its
Chandra counterpart. Candidate #2 is 28 away from the nearest source in 2MASS and USNO catalogs. As it can
also be seen in the -band image of this source (Fig. 4), the Chandra source cannot be clearly identified
with an optical counterpart. Likewise, candidate #3 was not listed in Table 1 since its coordinates are not associated
with any optical or IR counterparts in the catalogs. However, a weak source in the Chandra error circle is visible in the
-band image of the field (Fig. 4). This source has an R magnitude of 22.17 0.14.
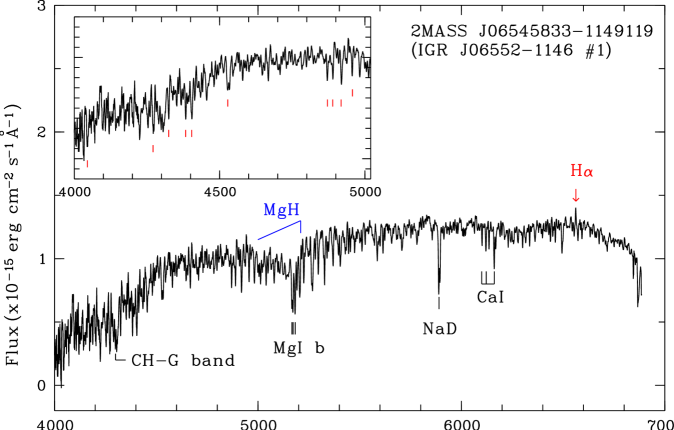
2MASS J065458331149119 (#1): The flux-calibrated spectrum of candidate #1 shows FeI, MgI and CaI absorption lines
(See Fig. 5) and a weak (EW = 0.45 Å) H emission line (see Table 4). The characteristics
of the spectrum are very similar to those of candidate #1 to IGR J040695042 in terms of the existence of the spectral lines
and the molecular MgH band. To give a spectral range, we searched the spectral atlases and libraries having a similar spectrum to
that of 2MASS J065458331149119. By comparing the spectra of the sources listed in Jacoby et al. (1984), Ross et al. (1996) and in
Gray & Corbally (2009) to candidate #1 we suggest that it would be a main sequence K5–8 type emission-line star.
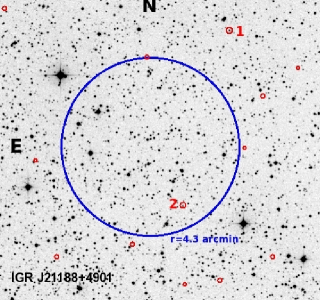
3.3. IGR J211884901
This source is tentatively classified as a transient in Bird et al. (2010) due to its highly
variable X-ray flux in 20–40 keV energy band. Two candidates which are quite faint in optical band have been
observed (Fig. 1) to search for the optical counterpart to IGR J211884901.
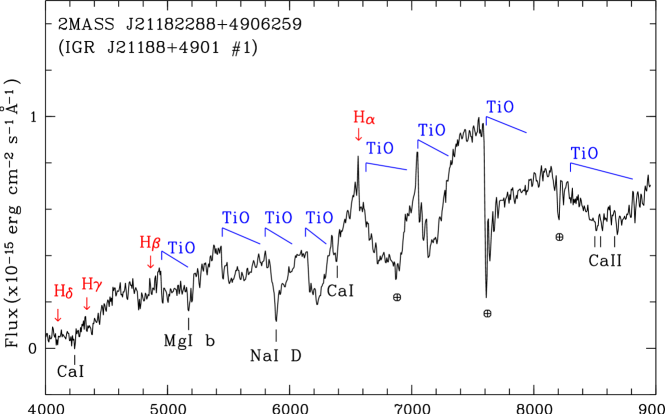
2MASS J211822884906259 (#1): The optical spectrum of this source contains both broad molecular TiO bands with a red
continuum and an H emission line with EW = 1.9 Å. Although EW values of H and H lines could not be
determined due to their low signal to noise, they are apparent in emission. These spectral features are indicative of a late-type
star spectrum with chromospheric activity. CaI and CaII triplet lines, used as luminosity indicator for M type stars (Jaschek & Jaschek, 1995),
MgI lines and telluric absorption bands are the other identified features in the spectrum (See Fig. 6). We point out
that the spectral apperance of this candidate is very similar to that of the counterparts of 1RXS J174607.8213333 and
IGR J110986457 which are identified as an M2–4 (Masetti et al., 2008) and an M2-type (Masetti et al., 2009) symbiotic giants respectively.
However this source does not have the clear spectral features of a red giant star. In addition 2MASS magnitudes are too faint to be
a nearby giant. Therefore we searched for the late-type stars spectra in the atlases of Gunn & Stryker (1983), Jacoby et al. (1984) and
Silva & Cornell (1992) to compare with our flux-calibrated spectrum and we determine that the spectral class of this candidate could
be a M3–5 type active main sequence star.
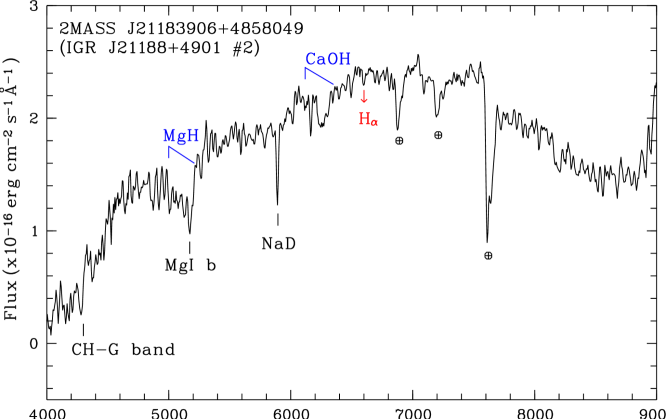
2MASS J211839064858049 (#2): This candidate is the only source having a Chandra counterpart within the
INTEGRAL error circle. The spectrum shown in Fig. 7 has typical features of a late-K/mid-M type star
(Gray & Corbally, 2009) without any emission lines. In addition the molecular CaOH band that becomes visible for dwarfs having spectral
class later than K7 and MgH bands are prominent features in the spectrum. The weakness and/or absence of the Balmer lines
(See Table 5) support the late-type spectral classification. Therefore, considering characteristics of the spectrum
we suggest a K7–M4 type main sequence classification for this source.
3.4. IGR J220146034
We obtained optical spectroscopy of four stars that are detected with Chandra in 2MASS and USNO catalogs.
Two of these candidate optical/IR counterparts lie within the -radius INTEGRAL error
circle as seen in Figure 1.
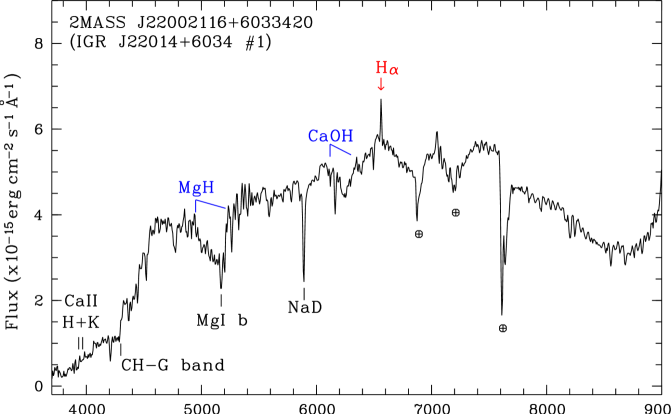
2MASS J220021166033420 (#1): The flux-calibrated spectrum is very similar to candidate #2 of IGR J211884901 that is
classified as a K7–M4 type main sequence star. It is dominated by the molecular MgH, CaOH and CH-G bands in addition to MgI b
triplet lines (See Fig. 8). The emission lines of H and CaII H & K at 3968, 3934
(See Table 5), indicators of chromospheric activity, are also detected.
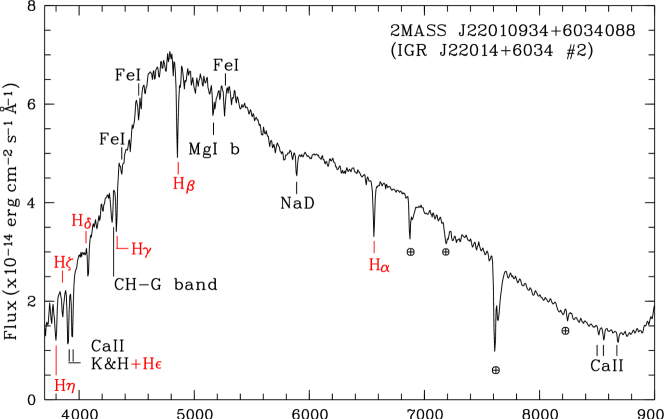
2MASS J220109346034088 (#2): This IR source is the optically brightest candidate to the X-ray position of IGR J220146034.
However, the optical spectrum contains no significant features related to an X-ray source. The most prominent absorptions in the blue
region of the spectrum are of CaII H & K and Balmer series lines. Metallic lines of FeI and MgI b triplet are also visible.
The flux-calibrated spectrum of 2MASS J220109346034088 is similar to that of A–G type stars due to its decaying blue
continuum towards the longer wavelengths (see Fig. 9). On the other hand the presence of CH-G band, and the weakness of
Balmer lines (See Table 5) while compared to A-type stars indicate that this source must be in F–G spectral range.
By comparing EW values of CaII triplet lines in near IR region to those of late-type stars (Jaschek & Jaschek, 1995; Zhou, 1991), we classify this
candidate as an F5-G5 type III-V star.
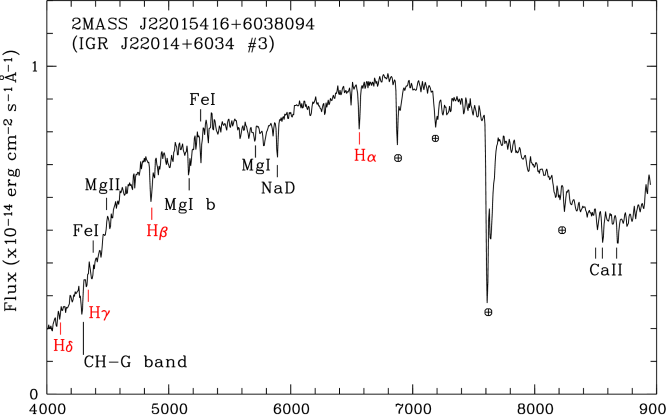
2MASS J220154166038094 (#3): This bright IR star is located at edge of the IGR error circle. It does not have an
optical counterpart in USNO-A2.0 catalog. Although the flux-calibrated spectrum contains nearly most of the features detected in
2MASS J220109346034088, they are different regarding the strength of the lines (See Table 5). The identification
spectrum of the candidate #3 is shown in Figure 10. The Balmer lines of H and H are extremely weak or
absent, compared to H line (EW = 2.3 Å) and to CH-G band. The blue region of the spectrum which is dominated by metallic
lines of MgI, MgII and FeI displays typical spectral features of a late-type star. We derive a spectral class of G III–IV based
upon the prominent features for this source.
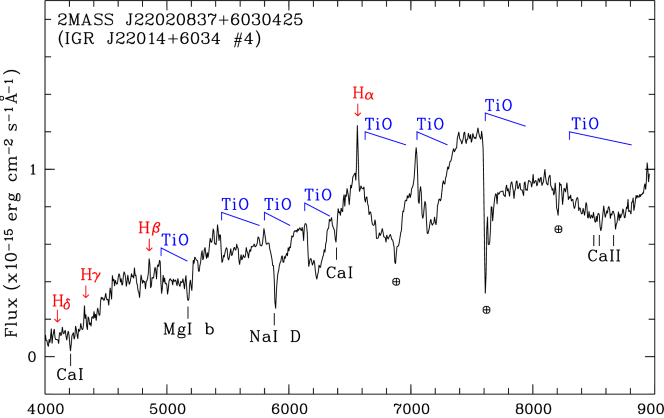
2MASS J220208376030425 (#4): The coordinates of the source are coincident with the positions of USNO-B1.0 15050322924 and
USNO-A.2 150008693376 although they fall just outside the INTEGRAL error circle (606). The flux-calibrated
4000–9000 Å spectrum shows typical features of a M type star (see Fig. 11) dominated by strong molecular bands
of TiO (Gray & Corbally, 2009). The emissions of Balmer series lines (H, H, H) superposed with TiO bands and the
presence of CaI, CaII, MgI b lines are in favor of the late-type spectral classification (See Table 5). Since
determining exact spectral class of late-type stars is rather complicated due to the contaminated blue part of the
spectrum, we used spectrophotometric atlases of Gunn & Stryker (1983), Jacoby et al. (1984) and the library of Silva & Cornell (1992) to secure
the spectral and luminosity classification. Comparing our spectrum with the late-type stars in the atlases and libraries we
classify 2MASS J220208376030425 as a main sequence M2–5 type chromospherically active star.
3.5. X-ray results
The four IGR sources we investigated in this work are reported as sources for which none of the Chandra sources in the field of view stands out as a candidate counterpart from a likelihood analysis just based on X-rays as described in T12. This likelihood analysis calculates the spurious association probability as:
| (1) |
where (2-10keV) = 9.2 ( deg-2 (Sugizaki et al., 2001, T12), and is the absorbed 2-10 keV flux in ergs cm-2 s-1. search is the radius of the search region in units of degrees and equals to 90 confidence for the sources inside the INTEGRAL error circle (See Table 1). For sources outside the error circle, it indicates the angular separation from the center of the INTEGRAL error circle. The spurious association probabilities of all sources are given in Table 2.
For most of the candidates the spurious association probability is very high. The notable exceptions are candidate #3 of IGR J065521146, candidate #2 of IGR J211884901, and candidate #3 of IGR J220146034. However the likelihood analysis does not take into account the variability. The soft X-ray measurements were obtained at an arbitrary epoch, and INTEGRAL analysis shows that the maximum hard X-ray flux and the average hard X-ray flux are different for these sources indicating variability (See Table 1, T12, Bird et al., 2010). In fact, IGR J040695042 and IGR J065521146 have bursticity555Bursticity can be defined as the ratio of the maximum significance on any timescale, compared to the average significance (Bird et al., 2010). impact grater than 1.1 and for IGR J218884901 it is greater than 4, indicating a highly variable nature of the source in X-rays (Bird et al., 2010). Therefore likelihood analysis based on X-ray data alone may fail in revealing the true counterpart if the X-ray observations take place when the source is weak. It is still possible that one of the detected Chandra sources is the correct counterpart.
4. Discussion
Below, we discuss the candidate counterparts for each IGR source in terms of their optical spectra, Chandra soft X-ray properties and relative probabilities to find out the candidates that are more likely to be the IGR source.
4.1. IGR J040695042
According to the Equation 1, the spurious association probabilities of candidates #1 and #2 are 68%, and 99.99% respectively, and neither of them was detected in the 2–10 keV band with Chandra. Among these two sources, candidate #2 has typical features of a late F-type star. On the other hand, candidate #1 shows Hα emission, which makes it more likely to be the correct counterpart.
4.2. IGR J065521146
Candidate #1 is 414 away from the center of the INTEGRAL error circle and the probability of spurious association is 88%. The spectrum shows evidence of an Hα emission line and it is similar to that of candidate #1 for IGR J040695042. The other sources with high ACIS count rates are too dim in the optical to get a spectrum. Their spurious association probabilities are 33–98% and 14–29% for candidates #2 and #3 respectively. Candidate #3 in fact has positive hardness ratio, and the relative probability is quite close to the cut-off for a Chandra/INTEGRAL association in T12.
4.3. IGR J218884901
Candidate #1 is outside the 90% confidence error circle of INTEGRAL with spurious association probability of 99.96%. It has been detected with Chandra in the 2–10 keV band, and is an active M type star. Candidate #2 is the only soft X-ray source (detected in 0.3–2 keV energy band) in the INTEGRAL error circle with a probability of 15% but it is not detected with Chandra in the 2–10 keV band. Candidate #2 shows properties of a late-type (K7–M4) main sequence star. Based on probabilities, candidate #2 is a more likely counterpart than candidate #1.
4.4. IGR J220146034
The first candidate is the brightest Chandra source in the vicinity of the IGR source, however it is out of the 90% confidence error circle of INTEGRAL. The spectrum is typical of an active late-type star. The probability of spurious association is 95% and it is detected in the 2–10 keV band with Chandra, however the source is very soft.
The optical spectra of candidates #2 and #3 show that they are late-type main sequence stars without emission lines. The probabilities of spurious associations for these sources are 88% and 36% respectively.
The optical spectrum of candidate #4 shows features of an active M type main sequence star. It is located just outside the error circle of INTEGRAL. The probability is 99.98%, and it is not detected with Chandra in the 2–10 keV band.
4.5. IGR sources identified as symbiotic systems
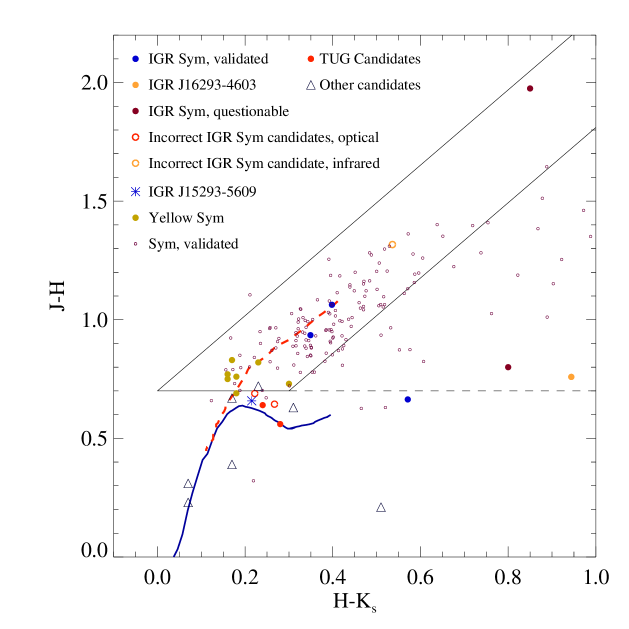
At an early phase of our analysis, we compared our optical spectra with those published in Masetti et al. (2008, 2009, 2012) and realized the similarities of candidate #1 of IGR J218884901 and candidate #4 of IGR J220146034, the M type stars with broad TiO bands, to those identified as symbiotic stars. However, these sources do not show HeI, HeII and [OIII] in emission (Kenyon, 1986), and their infrared colors are not consistent with the colors of symbiotics in the vs diagram as given by Phillips (2007) and Corradi et al. (2008). Our candidates are more probably active main sequence stars e.g., dMe stars (Pettersen & Hawley, 1989) rather than being giants. To illustrate this we plotted the NIR color-color diagram of M type TUG candidates (filled red circles) along with colors of several other sources in Figure 12. The plot includes validated IGR symbiotics (IGR J101095746, IGR J123496434 and IGR J161942810 with filled blue circles) and the all known symbiotics (small, empty, purple circles), the boundaries that limit stellar (S) and dusty (D) type symbiotics (see Pereira & Roig, 2009, for details of S and D type symbiotics) and the loci of main sequence stars and red giant stars. The colors of IGR sources, tentatively classified as symbiotic systems but later shown to have the incorrect counterpart candidates, are also placed in Figure 12. The initial classifications of the counterparts to IGR J110986457, IGR J171973010 (empty red circles) and IGR J163934643 (empty orange circle) were done with optical and/or IR spectral analyses. Since the refined X-ray positions of these IGR sources were not related to the suggested counterparts, the symbiotic identifications were ruled out. Note that the colors of incorrect counterparts can easily be associated with the main sequence stars like the TUG candidates.
Two other candidates were also tentatively claimed to be symbiotic binaries, IGR J163584726, IGR J174972821, but subsequent analyses made the symbiotic interpretation questionable (see Introduction for details). These sources are shown as ”IGR Sym, questionable” in Fig. 12 (filled brown circles), and have colors consistent with dusty symbiotic systems. The colors of the infrared counterpart of IGR J162934603 (filled orange circle) are also consistent with being a symbiotic system as expected, since the initial identification was done using , , and colors by Ratti et al. (2010). We also show IGR J152935609, classified as a symbiotic with a type companion (blue star). This source falls slightly out of the region of validated symbiotics. On the other hand, symbiotics with type companions are rare, and occupy lower values (Pereira & Roig, 2009) just like IGR J152935609. These are called yellow symbiotic systems which are indicated separately in Figure 12 (filled, dark yellow circles). We also note that reddening can move the sources along the diagonal lines shown in the figure, and the large uncertainty in of IGR J152935609 (T12) could easily move this source to the confirmed region. Finally we show the colors of all other candidates that we identify as main sequence stars (with triangles), and as expected most of them lie along the locus of main sequence stars.
This analysis shows that near infrared color diagram provides a quick method to double check identifications of symbiotics with some caveats. First of all, many symbiotic systems have normal NIR colors (see confirmed symbiotics, and the locus of red giant branch stars in Fig. 12). NIR colors may be enough to claim a giant identification, but it does not mean that the system is a symbiotic. Second, most Galactic IGR sources are in the plane with high extinction (including the sources we analyzed, all with ) which could move main sequence stars into the range of symbiotics. We could not include colors of 1RXS J174607.8213333 (Masetti et al., 2008) on this plot because it was not in the near infrared catalogs, but that identification also relied only on low resolution optical spectrum which requires further analysis. As mentioned in Masetti et al. (2008), it could also be a spurious detection.
5. Conclusions
We tabulate the the properties of all of the investigated sources in Table 6. We found several chromospherically active late-type stars that might be the counterparts of the IGR sources. A special type of active stars, the RS CVn systems, significantly contribute to the population of X-ray sources above 2 keV (Motch et al., 2010). After the tentative identification of IGR J080236954 as an RS CVn system by Rodriguez et al. (2010), two more IGR sources were identified in this class of binaries with active coronae (Masetti et al., 2012). These sources are variable in hard X-rays (Barbier et al., 2005; Osten et al., 2007), and therefore can be detected with INTEGRAL. Given the similarity of the optical spectra, candidate #1 of IGR J040695042 or candidate #1 of IGR J065521146 may be RS CVn if either of them is the actual counterpart.
The total number of IGR systems claimed to be symbiotics is eight. Including IGR J152935746, the number of multiple method confirmed symbiotics is four. For our candidates with deep TiO bands, we cannot confirm the symbiotic nature as their near infrared colors are not consistent with known symbiotics. Given that the active dMe stars are ubiquiotus in our Galaxy, some of the suggested counterparts to the IGR sources claimed as symbiotics may as well be active main sequence stars. We stress that low resolution optical spectra may not always provide right identification for these type of systems, and further high resolution, multiwavelength and timing observations may be required to understand the true nature of these sources.
References
- Assafin et al. (2001) Assafin, M., et al. 2001, ApJ, 552, 380
- Barbier et al. (2005) Barbier, L., et al. 2005, GRB Coordinates Network, 4360, 1
- Bird et al. (2010) Bird, A. J., et al. 2010, ApJS, 186, 1B
- Bodaghee et al. (2012) Bodaghee, A., et al. 2012, ApJ, 751, 113
- Butler et al. (2009) Butler, S C., et al. 2009, ApJ, 698, 502
- Cayrel et al. (1996) Cayrel, R., Faurobert-Scholl, M., Feautrier, N., Spielfieldel, A., Thévenin, F. 1996, A&A, 312, 549
- Chaty et al. (2008) Chaty, S., et al. 2008, A&A, 484, 783
- Cieslinski et al. (1994) Cieslinski, D., Elizalde, F., & Steiner, J. E. 1994, A&AS, 106, 243
- Corbet et al. (2010) Corbet, R. H. D., et al. 2010, ATel, 2570
- Corradi et al. (2008) Corradi, R. L. M., et al. 2008, A&A, 480, 409
- Cutri et al. (2003) Cutri, R. M., et al. 2003, The IRSA 2MASS All-Sky Point Source Catalog, NASA/IPAC Infrared Science Archive
- Deutsch (1999) Deutsch, E. W. 1999, AJ, 118, 1882
- Eaton (1995) Eaton, J. A. 1995, AJ, 109, 179
- Friedjung & Viotti (1982) Friedjung, M., & Viotti, R. 1982, JBAA, 93Q, 45F
- Gray & Corbally (2009) Gray, R. O., & Corbally, C. J. 2009, Stellar Spectral Classification (Princeton University Press)
- Gunn & Stryker (1983) Gunn, J. E., & Stryker, L. L. 1983, ApJS, 52, 121
- Haisch et al. (1990) Haisch, B. M., Schmitt, J. H. M. M., Rodono, M., Gibson, D. M. 1990, A&A, 230, 419
- Jacoby et al. (1984) Jacoby, G. H., Hunter, D. A., & Christian, C. 1984, ApJS, 56, 257
- Jaschek & Jaschek (1995) Jaschek, C., & Jaschek, M. 1995, The Behavior of Chemical Elements in Stars (Cambridge University Press)
- Kennea et al. (2009) Kennea, J. A., et al. 2009, ApJ, 701, 1992
- Kenyon & Webbink (1984) Kenyon, S. J., & Webbink, R. F. 1984, ApJ, 279, 252
- Kenyon (1986) Kenyon, S. J. 1986, The Symbiotic Stars (Cambridge University Press)
- Kenyon & Fernandez-Castro (1987) Kenyon, S. J., & Fernandez-Castro, T. 1987, AJ, 93, 938
- Kenyon (1990) Kenyon, S. J. 1990, ASPC, 9, 206
- Kogure & Leung (2007) Kogure, T., & Leung, Kam-Ching 2007, The Astrophysics of Emission Line Stars, AASL, 342
- Krivonos et al. (2010) Krivonos, R. et al., 2010, A&A, 523, 61
- Lebrun et al. (2003) Lebrun, F., et al. 2003, A&A, 411, L141
- Luna & Sokoloski (2007) Luna, G. J. M., & Sokoloski, J. L. 2007, 671, 741
- Luna et al. (2012) Luna, G. J. M., Sokoloski, J. L., Mukai, K., & Nunez, N. 2012, ATel, 3960
- Masetti et al. (2005) Masetti, N., Bassani, L., Bird, A. J., & Bazzano, A. 2005, ATel, 528
- Masetti et al. (2006) Masetti, N., Bassani, L., Dean, A. J., Ubertini, P., & Walter, R. 2006, ATel, 715
- Masetti et al. (2007) Masetti, N., et al. 2007, A&A, 331, 337
- Masetti et al. (2008) Masetti, N., et al. 2008, A&A, 482, 113
- Masetti et al. (2009) Masetti, N., et al. 2009, A&A, 495, 121
- Masetti et al. (2012) Masetti, N., et al. 2012, A&A, 538, 123
- Mikołajewska et al. (1997) Mikołajewska, J., Acker, A., & Stenholm, B. 1997, A&A, 327, 191
- Monet (1998) Monet, D. G. 1998, AAS Meeting Abstracts, Vol.30, 120.03
- Monet (2003) Monet, D. G., et al. 2003, AJ, 125, 984
- Montes & Martín (1998) Montes, D., & Martín, D. L. 1998, A&AS, 128, 485
- Morgan et al. (1943) Morgan, W. W., Kellman, E., & Hoffleit, E. 1943, Sci, 97, 536
- Motch et al. (2010) Motch, C., et al. 2010 A&A 523 92
- Muerset et al. (1997) Muerset, U., Wolff, B., & Jordan, S. 1997, A&A, 319, 201
- Nespoli et al. (2010) Nespoli, E., Fabregat, J., & Mennickent, R. E. 2010, A&A, 516, 94
- Oke & Gunn (1983) Oke, J. B., & Gunn, J. E. 1983, ApJ, 266, 713
- Oke (1990) Oke, J. B. 1990, AJ, 99, 1621
- Osten et al. (2007) Osten, R. A., et al. 2007, ApJ, 654, 1052
- Paizis et al. (2007) Paizis, A., et al. 2007, ApJ, 657, 109
- Paizis et al. (2009) Paizis, A., et al. 2009, PASJ, 61, 107
- Pereira & Roig (2009) Pereira, C. B., & Roig, F. 2009, AJ, 137, 118
- Pettersen & Hawley (1989) Pettersen, B. R., & Hawley, S. L. 1989, A&A, 217, 187
- Phillips (2007) Phillips, J. P. 2007, MNRAS, 376, 1120
- Ratti et al. (2010) Ratti, E. et al., 2010, MNRAS, 408, 1866
- Rodriguez et al. (2008) Rodriguez J., Tomsick, A. J., & Chaty, S. 2008, A&A, 482, 731
- Rodriguez et al. (2009) Rodriguez J., Tomsick, A. J., & Chaty, S. 2009, A&A, 494, 417
- Rodriguez et al. (2010) Rodriguez J., Tomsick, A. J., & Bodaghee, A. 2010, A&A, 517, 14
- Ross et al. (1996) Roos, M. S., Boisson, C., & Joly, M. 1996, A&AS, 117, 93
- Silva & Cornell (1992) Silva, D. R., & Cornell, M. E. 1992, ApJS, 81, 865
- Skrutskie et al. (2006) Skrutskie, M. F., et al. 2006, AJ, 131, 1163
- Sugizaki et al. (2001) Sugizaki, M., et al., 2001, ApJS, 134, 77
- Tomsick et al. (2006) Tomsick, A. J., et al. 2006, ApJ, 647, 1309
- Tomsick et al. (2008) Tomsick, A. J., et al. 2008, ApJ, 685, 1143
- Tomsick et al. (2009) Tomsick, A. J., et al. 2009, ApJ, 701, 811
- Tomsick et al. (2012) Tomsick, A. J., et al. 2012, ApJ, 754, 145
- Walter et al. (2007) Walter, R., et al. 2007, A&A, 461, 17
- Winkler et al. (2003) Winkler, C., et al. 2003, A&A, 411, L1
- Zhou (1991) Zhou, X. 1991, A&A, 248, 367
| IGR Name | RA(J2000) | DEC(J2000) | laaThe Galactic Longitude of the source in degrees. | bbbThe Galactic Latitude of the source in degrees. | Error RadiusccThe radius of the 90% confidence IGR circle. | Flux | Flux | Peak FluxddThe peak flux of the sources which show variability in the 20–40 keV energy band. For IGR J220146034 no variation detected in this range. |
|---|---|---|---|---|---|---|---|---|
| J040695042 | 04h06m550 | 50421 | 151.43 | 1.03 | 42 | 1.60.3 | <1.0 | 2.00.3 |
| J065521146 | 06h55m100 | 11462 | 223.85 | 4.52 | 43 | 1.10.3 | <1.0 | 2.61.0 |
| J211884901 | 21h18m480 | 49010 | 91.27 | 0.33 | 43 | <0.2 | <0.4 | 4.51.3 |
| J220146034 | 22h01m270 | 60340 | 103.49 | 4.28 | 54 | <0.2eeThe source is detected in 17–30 keV band, Bird et al. (2010). | <0.4 |
Note. — The fluxes are given in units of mCrab. A flux of 1 mCrab in the 20–40 keV energy range corresponds to 7.5710-12 erg cm-2 s-1 while it is 9.4210-12 erg cm-2 s-1 for 40–100 keV band.
| IGR J040695042 | |||||
|---|---|---|---|---|---|
| Candidate#Chandra NameaaAll Chandra information is reported by T12 | RA(J2000) | DEC(J2000) | ACIS Counts | HardnessbbHardness ratio is defined as where is the count rate in the given band. After background subtraction in Chandra, the hardness ratios may become negative (T12). | (%)ccSee Equation 1 and T12. |
| 1CXOU J040643.9504446 | 04h06m4399 | 5044462 | 5.4 | 1.191.10 | 68 |
| 2CXOU J040648.7503931 | 04h06m4869 | 5039312 | 3.4 | 1.301.65 | 99.99 |
| IGR J065521146 | |||||
| 1CXOU J065458.3114911 | 06h54m5831 | 1149113 | 8.5 | 0.750.70 | 83 |
| 2CXOU J065523.6114601 | 06h55m2365 | 1146011 | 13.4 | 0.620.46 | 33-98 |
| 3CXOU J065529.5114900 | 06h55m2956 | 1149001 | 35.5 | 0.020.22 | 14-29 |
| IGR J211884901 | |||||
| 1CXOU J211822.9490627 | 21h18m2286 | 4906267 | 7.1 | 0.780.82 | 99.96 |
| 2CXOU J211839.1485806 | 21h18m3909 | 4858055 | 4.3 | 0.611.00 | 15 |
| IGR J220146034 | |||||
| 1CXOU J220021.1603342 | 22h00m2114 | 6033418 | 45.8 | 40.910.25 | 95 |
| 2CXOU J220109.3603409 | 22h01m0934 | 6034087 | 14.4 | 0.790.46 | 88 |
| 3CXOU J220154.1603809 | 22h01m5413 | 6038095 | 31.7 | 0.610.27 | 36 |
| 4CXOU J220208.4603042 | 22h02m0835 | +6030424 | 10.7 | 1.150.70 | 99.99 |
| IGR J040695042 | ||||
|---|---|---|---|---|
| Candidate#Catalog/Source NameaaThe catalogs are the Two Micron All Sky Survey (2MASS, Cutri et al., 2003) and the United States Naval Observatory (USNO-B1.0 and USNO-A2.0, Monet, 1998, 2003). The astrometric accuracy of 2MASS and USNO catalogs are 01 (Skrutskie et al., 2006) and 02 respectively (Deutsch, 1999; Assafin et al., 2001; Monet, 2003). | RA(J2000) | DEC(J2000) | DistancesbbThe angular distance from the center of the INTEGRAL error circle/The angular distance from the Chandra position reported by T12 | Magnitudes |
| 12MASS J040643925044469 | 04h06m4392 | 50444695 | 320/100 | J=14.40 H=13.68 Ks=13.45 |
| USNO-A2.0 150008672098 | 04h06m4394 | 50444739 | 323/128 | B=18.60 R=16.60 |
| USNO-B1.0 15050322270 | 04h06m4392 | 50444732 | 321/129 | B1=19.06 R1=16.32 B2=18.49 R2=16.71 I=15.42 |
| 22MASS J040648725039316 | 04h06m4873 | 50393163 | 276/058 | J=11.44 H=11.13 Ks=11.06 |
| USNO-A2.0 135004221566 | 04h06m4874 | 50393181 | 275/078 | B=13.20 R=12.30 |
| USNO-B1.0 14060110577 | 04h06m4873 | 50393176 | 276/069 | B1=13.56 R1=12.15 B2=13.37 R2=12.69 I=11.82 |
| IGR J065521146 | ||||
| 12MASS J065458331149119 | 06h54m5834 | 11491200 | 414/079 | J=14.04 H=13.83 Ks=13.32 |
| USNO-A2.0 075003064876 | 06h54m5835 | 11491180 | 414/074 | B=16.60 R=15.40 |
| USNO-B1.0 07810141882 | 06h54m5833 | 11491189 | 414/064 | B1=16.95 R1=15.43 B2=17.48 R2=15.34 I=14.60 |
| IGR J211884901 | ||||
| 12MASS J211822884906259 | 21h18m2289 | 49062596 | 681/078 | J=13.01 H=12.45 Ks=12.17 |
| USNO-A2.0 135013821833 | 21h18m2289 | 49062639 | 682/040 | B=18.20 R=16.30 |
| USNO-B1.0 13910394771 | 21h18m2288 | 49062631 | 682/044 | B1=18.33 R1=16.01 B2=18.24 R2=16.06 I=14.51 |
| 22MASS J211839064858049 | 21h18m3907 | 48580492 | 327/061 | J=14.41 H=13.78 Ks=13.47 |
| USNO-A2.0 135013829476 | 21h18m3900 | 48580532 | 326/091 | B=19.00 R=17.00 |
| USNO-B1.0 13890393707 | 21h18m3906 | 48580528 | 326/037 | B1=18.57 R1=17.12 B2=18.66 R2=16.69 I=15.91 |
| IGR J220146034 | ||||
| 12MASS J220021166033420 | 22h00m2117 | 60334206 | 809/034 | J=11.66 H=10.99 Ks=10.82 |
| USNO-A2.0 150008655368 | 22h00m2117 | 60334211 | 809/038 | B=15.50 R=13.7 |
| USNO-B1.0 15050321733 | 22h00m2127 | 60334244 | 808/113 | B1=15.41 R1=13.61 B2=15.19 R2=13.38 I=12.29 |
| 22MASS J220109346034088 | 22h01m0934 | 60340881 | 217/011 | J=10.62 H=10.39 Ks=10.32 |
| USNO-A2.0 150008672098 | 22h01m0929 | 60340812 | 218/067 | B=12.70 R=11.00 |
| USNO-B1.0 15050322270 | 22h01m0928 | 60340800 | 218/082 | B1=12.57 R1=11.00 B2=11.72 R2=10.86 I=10.69 |
| 32MASS J220154166038094 | 22h01m5416 | 60380948 | 533/023 | J=11.50 H=11.11 Ks=10.94 |
| USNO-B1.0 15060321404 | 22h01m5399 | 60380960 | 532/102 | B1=14.59 R1=11.77 B2=- R2=12.46 I=11.74 |
| 42MASS J220208376030425 | 22h02m0837 | 60304250 | 606/018 | J=12.59 H=11.95 Ks=11.71 |
| USNO-A2.0 150008693376 | 22h02m0828 | 60304283 | 605/068 | B=17.50 R=15.50 |
| USNO-B1.0 15050322924 | 22h02m0838 | 60304277 | 606/043 | B1=17.37 R1=15.27 B2=17.19 R2=15.38 I=13.54 |
| IGR J040695042 | IGR J065521146 | |||||
|---|---|---|---|---|---|---|
| J040643925044469 | J040648725039316 | J065458331149119 | ||||
| SrII | 4077 | 0.650.11 | ||||
| H | 2.420.18 | |||||
| CaI | 4226 | 0.940.13 | ||||
| H | 2.80.23 | |||||
| CaI triplet | 6103 | 0.530.06 | 0.07 | 0.560.04 | ||
| 6122 | 1.000.04 | 0.05 | 0.980.14 | |||
| 6162 | 1.950.30 | 0.3 | 1.420.20 | |||
| H | 1.070.04 | 2.410.08 | 0.450.05 | |||
| Spectral Class | K5–7 Ve | F5–8 III–V | K5–8 Ve | |||
Note. — EW measurements are given in Å units and by convention, positive values denote the absorption lines.
| IGR J211884901 | ||||||||
|---|---|---|---|---|---|---|---|---|
| J211822884906259 | J211839064858049 | |||||||
| H | 1.90.24 | 0.03 | ||||||
| Spectral Class | M3–5 Ve | K7–M4 V | ||||||
| IGR J220146034 | ||||||||
| J220021166033420 | J220109346034088 | J220154166038094 | J220208376030425 | |||||
| CaII H & K | 3934 | 1.020.51 | ||||||
| 3968 | 1.360.07 | |||||||
| H | 4.220.01 | **Since H absorption of J220154166038094 is highly blended, its EW measurement is not given in the table. | ||||||
| FeI | 5269 | 1.070.01 | ||||||
| H | 2.150.03 | 3.600.01 | 2.260.01 | 3.80.05 | ||||
| CaII triplet | 8498 | 1.820.05 | 1.250.04 | |||||
| 8542 | 2.490.03 | 2.420.02 | ||||||
| 8662 | 2.010.01 | 2.360.01 | ||||||
| Spectral Class | K7–M4 Ve | F5–G5 III–V | G III–IV | M2–5 Ve | ||||
Note. — EW measurements are given in Å units and by convention, positive values denote the absorption lines.
| IGR J040695042 | |||
|---|---|---|---|
| Chandra Name | Spectral Class | Type | Notes |
| 1CXOU J040643.9504446 | K5-7 Ve | Active star; RS CVn? | H emission, lower SAPaaSAP: Spurious Association Probability |
| 2CXOU J040648.7503931 | F5-8 III-V | Late-type star | No emission lines, higher SAP |
| IGR J065521146 | |||
| 1CXOU J065458.3114911 | K5-8 Ve | Active Star; RS Cvn? | H emission, higher SAP |
| 2CXOU J065523.6114601 | ? | No optical spectrum, intermediate SAP | |
| 3CXOU J065529.5114900 | ? | No optical spectrum, low SAP, positive hardness | |
| IGR J211884901 | |||
| 1CXOU J211822.9490627 | M3-5 Ve | Active Star; Flare star? | H emission, higher SAP |
| 2CXOU J211839.1485806 | K7-M4 V | Late-type star | lower SAP but not detected in 2-10 keV |
| IGR J220146034 | |||
| 1CXOU J220021.1603342 | K7-M4 Ve | Active star | H emission, high SAP, detected in 2-10 keV |
| 2CXOU J220109.3603409 | F5-G5 III-V | Late-type star | No features, high SAP |
| 3CXOU J220154.1603809 | G III-IV | Late-type star | No features, lower SAP |
| 4CXOU J220208.4603042 | M2-5 Ve | Active Star; Flare star? | H emission, higher SAP |
 |
 |
 |
 |
 |
 |
 |
 |
 |
 |
 |
 |
 |
 |
 |