Search for a correlation between very-high-energy gamma rays and giant radio pulses in the Crab pulsar
Abstract
We present the results of a joint observational campaign between the Green Bank radio telescope and the VERITAS gamma-ray telescope, which searched for a correlation between the emission of very-high-energy (VHE) gamma rays ( 150 GeV) and Giant Radio Pulses (GRPs) from the Crab pulsar at 8.9 GHz. A total of 15366 GRPs were recorded during 11.6 hours of simultaneous observations, which were made across four nights in December 2008 and in November and December 2009. We searched for an enhancement of the pulsed gamma-ray emission within time windows placed around the arrival time of the GRP events. In total, 8 different time windows with durations ranging from 0.033 ms to 72 s were positioned at three different locations relative to the GRP to search for enhanced gamma-ray emission which lagged, led, or was concurrent with, the GRP event. Further, we performed separate searches on main pulse GRPs and interpulse GRPs and on the most energetic GRPs in our data sample. No significant enhancement of pulsed VHE emission was found in any of the preformed searches. We set upper limits of 5-10 times the average VHE flux of the Crab pulsar on the flux simultaneous with interpulse GRPs on single-rotation-period time scales. On 8-second time scales around interpulse GRPs, we set an upper limit of 2-3 times the average VHE flux. Within the framework of recent models for pulsed VHE emission from the Crab pulsar, the expected VHE-GRP emission correlations are below the derived limits.
Subject headings:
gamma rays: stars, pulsars: individual: B0531+211. Introduction
The Crab pulsar, PSR B0531+21, is a powerful young pulsar and one of the most studied objects in the sky. It is one of the brightest pulsars in the high-energy gamma-ray regime (Fierro et al., 1998; Abdo et al., 2010) and the only pulsar so far to be detected above 100 GeV (Aliu et al., 2011; Aleksić et al., 2012). The Crab pulsar is also one of only several known pulsars which exhibit the giant radio pulse phenomenon (Knight, 2006): single radio pulses with flux densities that greatly exceed the average pulse flux density and can, at their maximum, be as bright as a few million Janskys (Soglasnov, 2007). The energies of giant pulses follow a power-law distribution (Cordes et al., 2004; Popov & Stappers, 2007) in contrast to the regular pulses that obey a Gaussian or log-normal distribution (Burke-Spolaor et al., 2012). High-resolution time measurements of individual GRPs reveal pulses which can be a few microseconds to a few nanoseconds wide (Hankins et al., 2003), with the narrower GRPs possessing the highest flux density.
The pulse profile of the Crab pulsar is dominated across the electromagnetic spectrum, from radio waves to VHE gamma rays, by two emission peaks, referred to as the main pulse (MP) and interpulse (IP). These peaks occur at phases 0.0 and 0.4, respectively, with a “bridge” of enhanced emission appearing between these two peaks in the optical, X-ray and gamma-ray pulse profiles (Oosterbroek et al., 2008; Mineo et al., 2006; Kuiper et al., 2001; Abdo et al., 2010). Above 100 GeV, significant emission is only observed during the main and inter-pulse (Aliu et al., 2011; Aleksić et al., 2012). In the radio-pulse profile several different components appear at different frequencies, including a precursor to the main radio pulse and two “high frequency components” (HFCs), which only appear above 5 GHz and occur at phases 0.77 and 0.93 (Moffett & Hankins, 1996). In the Crab pulsar, giant radio pulses have been observed to occur during both the main pulse and the interpulse. Indeed, it has been suggested that the Crab radio profile is composed of entirely GRPs, with the “regular” pulsar pulse corresponding to the main pulse precursor component (Popov et al., 2006). The case for the regular pulse is difficult to disentangle, since single regular pulses cannot be observed over the nebular background. Stark differences in the characteristics of main pulse GRPs and interpulse GRPs have been revealed by observations of the Crab pulsar between 6 and 10.5 GHz. In this frequency range, interpulse GRPs are typically several microseconds long and populate a set of regularly spaced frequency bands (Hankins & Eilek, 2007). On the other hand, main pulse GRPs exhibit broadband spectra and appear as a succession of narrow pulses ranging from unresolved widths below 0.4 ns to widths of a few microseconds (Hankins et al., 2003; Hankins & Eilek, 2007). These striking differences suggest that the emission mechanisms may differ between the main pulse GRPs and interpulse GRPs in the Crab pulsar above 5 GHz.
The mechanisms responsible for the generation of GRPs are still unknown. Changes in the coherence of the plasma beam, which is believed to be responsible for the normal pulsed radio emission, can in principle explain the generation of GRPs. However, mechanisms which primarily affect the coherence of the plasma have no effect on the incoherent emission from pulsars and, thus, no enhancement is expected in the gamma-ray emission in connection with GRP events. Mechanisms which increase the rate of particle production within the magnetospheric emission region, or which change the direction of the emission beam, should, however, affect the higher energy incoherent emission. Such mechanisms may create an enhancement in the gamma-ray emission from the pulsar.
The exceptional emission band structure seen in interpulse GRPs from the Crab pulsar at high frequencies reported by Hankins & Eilek (2007) prompted a quantitative model for their generation by Lyutikov (2007). This model argues that GRPs are generated in a dense plasma region close to the last closed magnetic field line. Occasional magnetic field reconnections excite the plasma producing a particle beam with a high Lorentz factor which emits a GRP via anomalous cyclotron resonance. This model, when fit to the interpulse GRP data from Hankins & Eilek (2007), returns a predicted Lorentz factor for the beam, , which is large enough to cause the particles within the beam to generate curvature photons with energies as high as tens of GeV. Thus, a feature of this model is a prediction of an enhancement in the gamma-ray emission correlated with high frequency interpulse GRPs from the Crab pulsar.
Several studies have been performed to examine a possible connection between GRPs in the Crab and higher-energy incoherent emission. Lundgren et al. (1995) studied 50-220 keV gamma rays recorded by the OSSE instrument on board NASA’s Compton Gamma-ray Observatory along side Green Bank radio data recorded at 800, 812.5 and 1330 MHz. No enhancement was seen in the gamma-ray emission on 2-minute time scales concurrent with GRP events. This study yielded an upper limit on the average gamma-ray flux from the pulsar over 2 minutes concurrent with GRPs of 2.5 times the average pulsed gamma-ray flux. Based on the non-detection of a gamma-ray enhancement, the authors argue in favour of coherence changes within the emission plasma as the source of GRP generation. Shearer et al. (2003), however, observed a significant 3% enhancement in the optical main pulse concurrent with the period of emission of GRPs measured at 1380 MHz. No enhancement was seen in the interpulse. This observation suggests a link between coherent radio emission and incoherent optical emission in the Crab pulsar. Small changes in the pair-creation rate leading to localised density increases within the emission plasma could create the GRP event and provide a small enhancement in the optical incoherent emission.
Recently Bilous et al. (2011) studied 0.1-5 GeV gamma rays recorded by the Fermi-LAT in conjunction with 8.9 GHz observations of the Crab performed by the Green Bank radio telescope. No enhancement was seen in the gamma-ray flux within the main pulse, interpulse and bridge, during single rotation periods which contained a GRP. This yielded a limit on the flux from the pulsar during rotation periods concurrent with GRPs of less than 4 times the average gamma-ray flux from the pulsar. This result suggests that enhanced pair-creation is not the dominant factor in the emission of GRPs in the Crab and supports the idea that local coherence changes in the magnetospheric plasma cause GRPs, or, that the putative enhanced gamma-ray emission is beamed in a different direction than the radio emission and thus unobservable from Earth. Another recent study by Bilous et al. (2012), which examined 1.4-4.5 keV X-rays from Chandra observations of the Crab pulsar in conjunction with radio observations by the Green Bank telescope at 1.1-1.9 GHz, found no enhancement in the X-ray flux in connection with GRPs. This study yielded limits on the flux enhancement in the main pulse and interpulse concurrent with GRP events of 10% and 30%, respectively.
Along with the aforementioned studies which searched for a correlation between GRPs and incoherent emission below 10 GeV, a GRP correlation search was performed on the Crab pulsar at TeV energies in the early 1970s (Argyle et al., 1974). This pioneering attempt was performed with the 25-m DRAO radio telescope and the Whipple gamma-ray telescope almost two decades before the first conclusive detection of a TeV gamma-ray source (Weekes et al., 1989). No TeV-GRP correlation was observed and we are aware of no other study on this subject with subsequent TeV instruments.
VERITAS is an array of four imaging atmospheric Cherenkov gamma-ray telescopes located at the Fred Lawrence Whipple Observatory at the base of Mount Hopkins in southern Arizona (Holder et al., 2006). Each telescope uses a 12 m Davies-Cotton reflector (Davies & Cotton, 1957) instrumented with a photo-multiplier tube (PMT) camera with 499 pixels. The array is sensitive to gamma rays with energies between 100 GeV and 30 TeV. The recent detection by VERITAS of pulsed emission above 100 GeV from the Crab (Aliu et al., 2011) is not expected within the context of contemporary pulsar models in which curvature radiation is the dominant gamma-ray emission mechanism. The origin of the power-law extension of the spectral energy distribution above 100 GeV seen now by both VERITAS and MAGIC (Aleksić et al., 2012) is poorly understood. A possible explanation is that the VHE emission is caused by inverse-Compton (IC) up-scattering of soft photons by particles accelerated in the outer magnetosphere (Romani, 1996; Lyutikov et al., 2012; Du et al., 2012). Another possible explanation is that the pulsed VHE emission is produced when pulsed magnetospheric X-ray photons are up-scattered by relativistic plasma in the wind outside the light cylinder (Aharonian et al., 2012). Given that the origin of the VHE emission and the generation of GRPs in the Crab pulsar are both poorly understood energetic phenomena, we are motivated to probe whether they are connected.
The remainder of this paper is structured in the following way. In we describe the simultaneous observations of the Crab pulsar made with the GBT and VERITAS gamma-ray telescopes. We also describe the extraction of GRP events from the radio dataset. In we discuss the gamma-ray data processing and our strategy for searching for correlated emission within the radio and gamma-ray datasets. In we describe a Monte-Carlo simulation of the Crab pulsar signal within the VERITAS dataset, which is used to calculate the strength of any correlation found in the datasets. In we detail the results of the enhancement search and in we provide some concluding remarks.
2. Observations
| Date | # GRPs | # GRPs | # -ray | T Overlap | Center Freq. | samp. |
|---|---|---|---|---|---|---|
| MJD] | Overlap | Candidates | [min] | [MHz] | [s] | |
| 54829 | 280 | 150 | 5566 | 138.365 | 8832 | 40.96 |
| 55153 | 7813 | 5937 | 8738 | 200.232 | 8900 | 3.2 |
| 55158 | 3771 | 3243 | 7928 | 182.881 | 8900 | 3.2 |
| 55180 | 6916 | 6036 | 7861 | 180.107 | 8900 | 3.2 |
| Total | 18780 | 15366 | 30093 | 701.585 |
Simultaneous observations of the Crab pulsar were made by VERITAS and the 100-m Robert C. Byrd Green Bank Telescope (GBT) on the 29th of December 2008, the 18th and 23rd of November 2009 and the 15th of December 2009. A total of 11.6 hours of simultaneous data was recorded across these four nights with 2.3, 3.33, 3.04 and 3.00 hours acquired, respectively. Table 1 gives a summary of the data used in this study.
2.1. GBT Observations and GRP selection
The radio data presented here were acquired using the Green Bank Ultimate Pulsar Processor Instrument (GUPPI) in search mode. The total bandwidth of 800 MHz was centered at 8832 or 8900 MHz and split into 128 or 256 frequency channels for our observations in 2008 and 2009, respectively. Full Stokes parameters were recorded at a sampling interval of s in 2008, whereas total intensity was recorded with a sampling interval of s in our 2009 observations.
Recorded data from every session were dedispersed using the PRESTO pulsar software package111http://www.cv.nrao.edu/$∼$sransom/presto/, and searched for all single-pulse events with a peak signal-to-noise ratio seven times greater than the average radio signal. The dedispersion was done using the contemporaneous dispersion measure (DM) value stated in the Jodrell Bank Crab pulsar monthly ephemeris222http://www.jb.man.ac.uk/pulsar/crab.html (Lyne et al., 1993). The GRP selection was performed with the PRESTO tool singlepulse_search.py, which convolves the dedispersed time series with a series of boxcar functions of different widths. The times of arrival of the selected GRP events were converted into Tempo333http://tempo.sourceforge.net format and transformed to barycentric dynamical time (TDB) for the correlation analysis with the VERITAS events.
Between the observation sessions in 2008 and 2009, the DM has increased from pc cm-3 in December 15, 2008 to pc cm-3 in December 2009. We estimate timing errors at our high observing frequency of 8.9 GHz to be s, which is less than our sampling time. Here we assume a smooth variation in the DM and that the changes in the DM between our observing sessions are certainly less than the measured change of the DM of pc cm-3 over the course of one year.
The system equivalent flux density is mostly determined by the Crab Nebula. Flux densities of the Crab Nebula were calculated with the relation Jy (Cordes et al., 2004), accounting for the fact that at 8.9 GHz the solid angle of the GBT beam covers only 6.25% of the area occupied by the nebula. We estimate the system equivalent flux density to be about 0.2 Jy for our 2008 observations, and about 0.7 Jy for the observing session in 2009. The smaller number of GRPs found in the 2008 dataset is likely due to a higher attenuation in the receiver system in 2008 where two back-end readouts were used together; the GBT Pulsar Spigot Card and the GBT Mk5 disk readout. The clumping of the barycentric arrival times of the GRPs clearly seen in the 2009 observations (see Figures 1 and 4) agrees with what one would expect from refractive interstellar scintillations (RISS). At 8.9 GHz the characteristic time scale of RISS is about 80 minutes (Bilous et al., 2011).
2.2. VERITAS Observations
The VERITAS observations were made under the best possible sky conditions with each of the four telescopes fully operational. These observations were made with zenith angles smaller than and an average zenith angle of , yielding the lowest possible energy threshold. All data were acquired in wobble mode (Fomin et al., 1994). This mode of observation places the object under study at an offset of from the centre of the field of view of the telescope, allowing for a simultaneous measurement of the background in other regions of the field of view with the same acceptance as the region containing the source.
Before an event is recorded with VERITAS, at least two of the four telescopes must trigger on a Cherenkov flash within 50 ns. A single telescope trigger is formed when three or more adjacent PMTs in the camera register at least six photoelectrons within 9 ns. When the trigger condition is satisfied, the PMT traces in each telescope are read out by 500 mega-sample per second flash analogue-to-digital converters which are located at each telescope. For each event, the VERITAS data stream contains the GPS time stamp from each of the four telescopes along with the digitised PMT-traces. In the entire VERITAS dataset presented in this work, the four GPS timestamps never diverged by more than 10 s, providing a sound basis for correlation and timing analyses.
3. Data Analysis
3.1. Gamma-ray Event Selection
Prior to performing a correlation search between the gamma-ray and radio datasets, the VERITAS data were passed through an analysis pipeline, which reconstructs the arrival direction and the energy of the gamma-ray candidate from the Cherenkov images recorded by the telescopes. For each event, the signal in each PMT is corrected for gain differences between the PMTs and signals which only contain noise are removed. Following this image cleaning, images which have a combined PMT signal (size) above 20 photoelectrons have their second moments calculated about their major and minor axes (Hillas, 1985). The arrival direction and impact parameter of the gamma-ray candidates are then calculated from the intersection points of the major axes of the images from multiple telescopes when projected on the sky and ground planes respectively (Hofmann et al., 1999). Background suppression, including cosmic-ray rejection, is performed by comparing measured event parameters with Monte-Carlo gamma-ray simulations. Selection parameters include image brightness and shape, arrival direction, height of shower maximum, and impact distance, and are combined in multi-dimensional energy-dependent look-up tables (Krawczynski et al., 2006). The optimal cut values were chosen a priori by modelling the gamma-ray signal from the Crab pulsar as a power-law with an integral flux of 1% of the Crab Nebula flux above 100 GeV and a spectral index of . A grid search for the optimal gamma-ray cut values was then performed using this simulated signal with real Crab Nebula data as background. The gamma-ray selection parameters and the resulting optimal cut values are: the angular separation between the source location and the shower direction, theta (), mean scaled width (1.17), mean scaled length (1.35), and height of shower maximum (6.6 km). This cut optimisation yielded an energy threshold of 120 GeV for sources with a spectral index of -4. This gamma-ray analysis is identical to the analysis which was used in our paper on the first detection of the Crab pulsar above 100 GeV (Aliu et al., 2011). The GPS time of the candidate gamma-ray events which passed cuts was converted to barycentric dynamical time and phase-folded using the Crab pulsar monthly timing ephemeris with an in-house software package. The accuracy of these calculations was cross-checked using the Tempo program.
3.2. Correlation Search Strategy
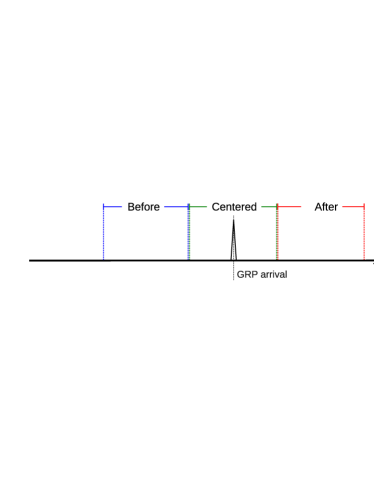
The physical mechanisms which are responsible for the emission of GRPs are not well understood. The nature of a possible connection between GRPs and the formation of high-energy incoherent emission from pulsars is also unknown. Given these unknowns, we prepared a correlation search strategy which probed for a connection between GRPs and very-high-energy gamma-ray emission on different time scales, allowing for lagging or leading between gamma-ray and GRP emission. The searches were done by selecting only those gamma-ray events which arrived at the solar system barycenter within a certain time window around a GRP event. The durations of the time windows were specified in units of pulsar rotations. We employed eight different time window durations lasting; 1, 3, 9, 27, 81, 243, 729 and 2187 pulsar rotations. This covers time intervals from 0.033 to 72.17 seconds in time spacings which scale as log to the base 3. Each time window was used to search for enhanced gamma-ray emission which lagged, led or was contemporaneous with, the GRP. Thus, for each search window duration, a window was positioned centered on the GRP, with the leading and lagging windows placed directly before and directly after the centered window, respectively (see Figure 2). Finally, searches were performed considering only main pulse GRPs, only interpulse GRPs and both main and interpulse GRPs combined. Thus, a total of 72 searches were performed.
In each of the 72 searches, the phase of the gamma-ray events which fall within the search window is calculated. In our earlier measurement of pulsed VHE emission from the Crab pulsar (Aliu et al., 2011), we determined the phases of emission to be between and 0.009 for the main pulse and between 0.375 and 0.421 for the interpulse. In this study we only consider VERITAS events that fall within these phase regions. When a gamma-ray event falls within the search window defined by a main pulse GRP, it has to lie within the VHE main pulse emission phase range for it to be considered in the enhancement search. Corresponding selection criteria are applied to those gamma-ray events which fall within a window defined by an interpulse GRP. In the searches which consider both main and interpulse GRPs, gamma-ray events which fall within either of the VHE emission phase ranges are selected. The prescription for these 72 searches was defined before the datasets were analysed.
4. Monte-Carlo Time Series
In order to determine the presence of an enhancement in the VHE emission from the pulsar correlated with GRPs, Monte-Carlo time series datasets were generated to model the gamma-ray data. Using a bin width of one second, raw trigger rate distributions (number of triggers per second) were compiled for each VERITAS observation run. These distributions were used as probability density functions from which random event times were drawn and sorted, from earliest to latest, producing random time series with the same temporal characteristics as the real VERITAS data. Further, to enable the measurement of the level of any VHE flux increase seen in the VERITAS data, or to facilitate the calculation of flux upper limits, these Monte-Carlo time series datasets were injected with a simulated signal from the Crab pulsar as explained in the following section.
| Date [MJD] | Total Number | Number of Excess | Number of Background |
|---|---|---|---|
| 54829 | 5566 | 26.2 | 5539.8 |
| 55153 | 8738 | 41.1 | 8696.9 |
| 55158 | 7928 | 37.3 | 7890.7 |
| 55180 | 7861 | 37.0 | 7824.0 |
| Total | 30093 | 141.6 | 29951.4 |
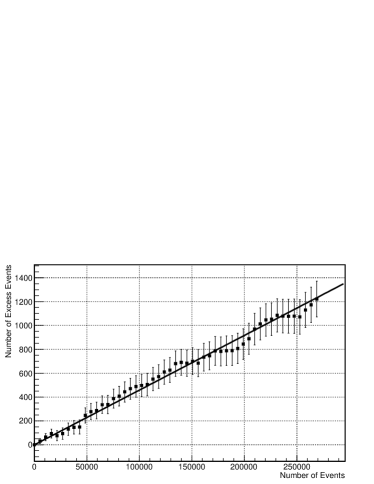
From our earlier analysis of the complete 107 hour VERITAS Crab pulsar dataset, we determined that the excess of events, which fall within the VHE main and interpulse emission regions, grows linearly with respect to the total number of events selected (Aliu et al., 2011). This linear growth is plotted in Figure 3. With a total excess of 1256130 in 267088 events we determine that there are 4.70.48 excess events in the VHE emission phases per 1000 events selected. Given this linear relationship, the number of excess events which lie within the VHE emission phases, for any subset of the VERITAS data, can be estimated (see Table 2). Further, we know that the emission peaks in the VERITAS Crab pulsar phasogram can be modelled by two Gaussians sitting on a uniform background. This was determined by an unbinned maximum likelihood fit of the VERITAS phase data (Aliu et al., 2011). Using these two observations we can generate a Monte-Carlo time series inhabited by a simulated Crab pulsar signal at any desired flux level.
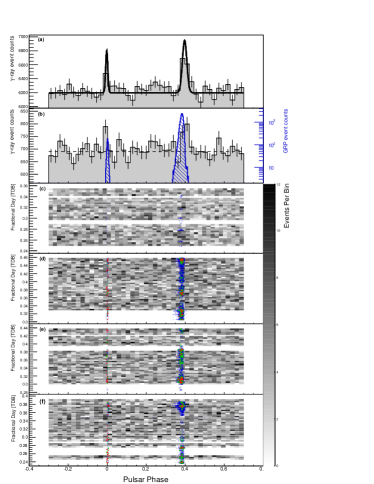
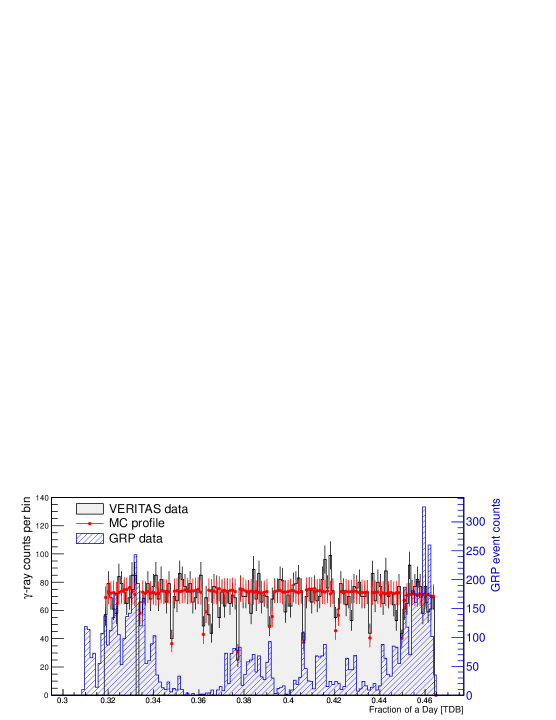
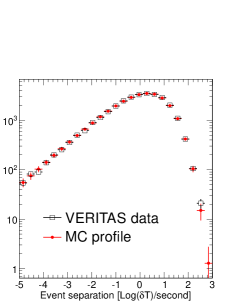
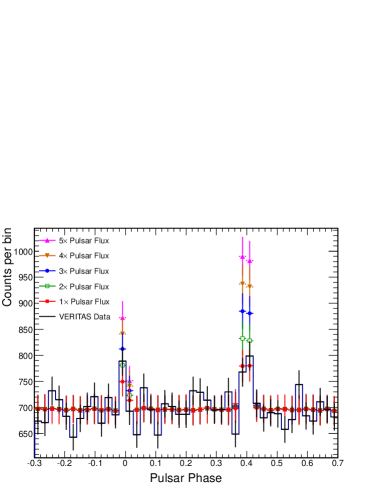
If a given VERITAS observation has a total number of events, , using the linear relationship discussed above, the number of excess pulsar events expected within this sample, , can be estimated. The number of background events is then . Now assume we want to model this VERITAS observation with a simulated signal from the Crab pulsar at a flux level , where is in units of the average pulsar flux level measured with VERITAS. We draw a number of background events, , from a Poisson distribution with a mean and we draw a number of pulsar events, , from a Poisson distribution with a mean . Now, using the VERITAS raw data rate distributions, discussed earlier, we draw random arrival times. A fraction of these events, , is randomly selected to contain the injected pulsar signal. This is done by shifting the arrival time of these events to the nearest time which, when barycentered and phase-folded, would correspond to a random phase value drawn from the double-Gaussian function which parametrises the VERITAS Crab pulsar phasogram. This small shift in time (17 ms) has no effect on the overall data rate characteristics of the Monte-Carlo datasets, and is only applied to a small fraction of randomly selected events within each dataset. This procedure was used to generate sets of Monte-Carlo data, containing a signal from the Crab pulsar at a chosen flux level, which model all the data rate characteristics of the real VERITAS data, accounting for the Poisson fluctuations inherent in the VERITAS measurement of the Crab pulsar flux. Examples of the match between the Monte-Carlo time-series datasets and the VERITAS gamma-ray data are shown in Figures 4 and 5.
5. Results
5.1. Search for enhanced gamma-ray emission during GRPs
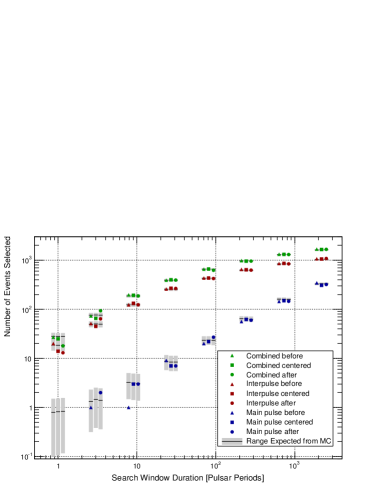
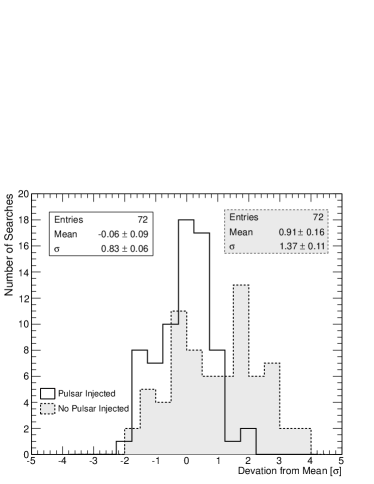
Each enhancement search yields a number, N, which is the number of VERITAS events that meet the specific search criteria, i.e., they fall within a time interval determined by a GRP with a phase value within the required VHE-emission phase range. The Monte-Carlo time-series datasets were subject to the same search which was performed on the real VERITAS dataset. Given that we generated a large number of Monte-Carlo time series, a search on a Monte-Carlo dataset will yield a distribution of the number of selected events, which is approximately Gaussian, and will have a mean, , and a variance, . The number of events selected in a given search, N, can be compared to the mean number expected from the Monte Carlo when no enhancement is present, . Such a comparison is plotted in Figure 6, showing the number of events selected in searches of the VERITAS data, compared to the mean number selected from a Monte-Carlo dataset. Here, the Monte-Carlo dataset is composed of 500 simulated time series, each containing an injected signal from the Crab pulsar at the level of the average measured VHE pulsar flux (). Using the formula, , one can determine the statistical significance of any deviation of the measured number of events, from the number expected in the absence of any enhancement444Twelve of the searches on the Monte-Carlo datasets yield distributions which are more Poissonian in shape than Gaussian (), meaning that the strict equivalence of the significance formula breaks down. The resulting assertions are, however, unchanged.. The significance distribution derived from the 72 searches is plotted in Figure 7. This distribution has a mean compatible with zero and a standard deviation close to one, indicating the absence of any significant enhancement in the VHE gamma-ray flux within the specified search windows positioned around GRPs observed at 8.9 GHz.
5.2. Calculation of the upper limit on the flux increase
We follow the same prescription as Bilous et al. (2011) to compute the upper limit on the VHE flux during the enhancement searches. From Bayes’ theorem, the posterior probability that the pulsar flux is given that we observed events in an enhancement search is
| (1) |
where is the likelihood of selecting events in a search when the pulsar flux is . For simplicity, all flux values specified here are cast in units of the average flux of the Crab pulsar measured with VERITAS. , the prior distribution of the flux, is an uninformative prior which we set to be
| (2) |
where is a non-zero constant. This means that during the emission of a GRP we consider the pulsar flux to be, with uniform probability, between 1 and 50 times the average Crab pulsar flux, and to have zero probability otherwise.
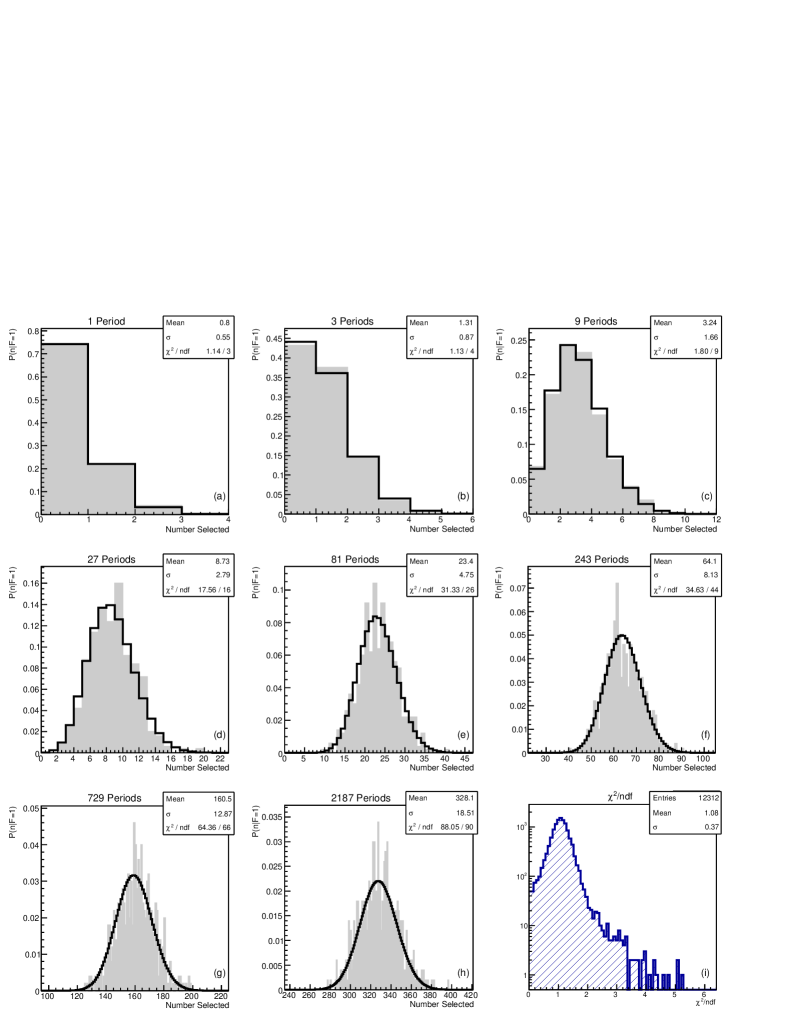
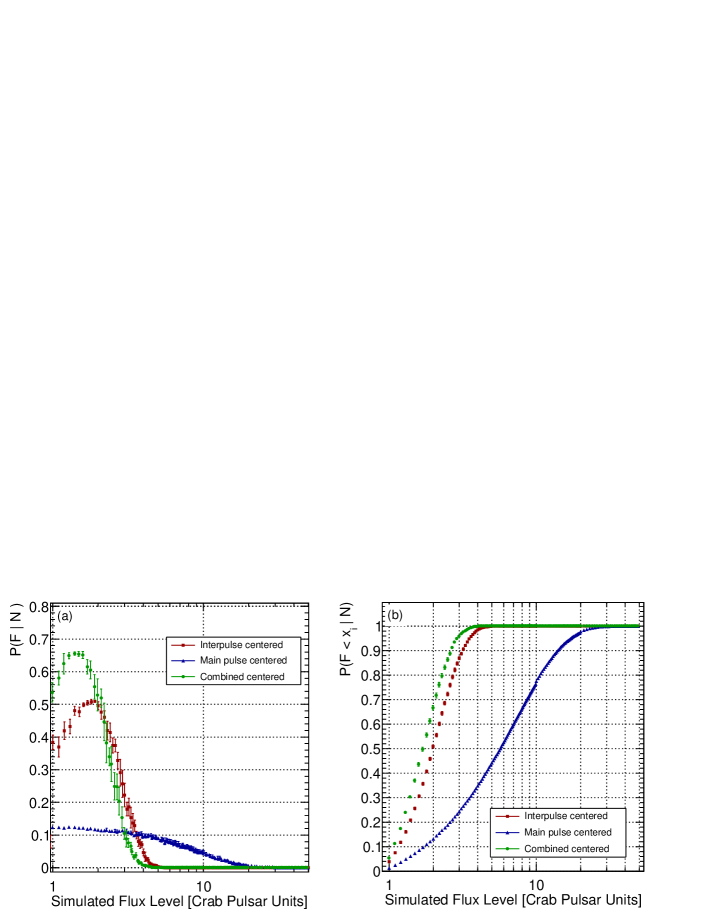
From the searches performed on the Monte-Carlo datasets we can explore the likelihood value, , for a range of flux values, by generating a likelihood curve. Each point in the curve is computed by probing the distribution of the number of selected events determined from a Monte-Carlo dataset generated with a given flux level, (see Figure 8 for some example distributions). The y-value of each point in the curve is the fraction of the Monte-Carlo datasets which, when subjected to the specific enhancement search, yielded the same number of coincident events as were found in the real data. In practice, we fit the distribution yielded from searches on the Monte-Carlo dataset with a Poisson function, and determine the likelihood from the fitted function. This is done to minimise fluctuations caused by the finite statistics used to compile the Monte-Carlo distributions. Figure 8 shows some examples of the fits to the Monte-Carlo distributions along with the distribution of the reduced- values (ndf) for all of the fits performed. From the reduced- distribution, which has a mean value close to 1, it is clear that the Poisson functional form accurately describes the distributions derived from searches performed on the Monte-Carlo datasets.
The likelihood curve for each search was compiled using Monte-Carlo datasets with injected flux levels ranging from, = 1 to 50, with step sizes of 0.1 between 1 and 10, 0.25 between 10 and 20, and 1 between 20 and 50. Given our choice of the prior , and that we evaluated the likelihood at an array of discrete flux levels, Equation 1 for the posterior probability can be re-written as
| (3) |
where runs over the array of simulated flux levels and is step size between each consecutive flux level. This posterior probability curve is normalised and can be integrated yielding a cumulative posterior probability, , from which one can determine the flux upper limit, , at a chosen confidence level. Figure 9 shows the posterior probability and cumulative distribution functions for three different searches. The flux value where the cumulative probability distribution crosses 0.95, marks the upper limit on the emitted flux correlated with GRPs at the 95% confidence level.
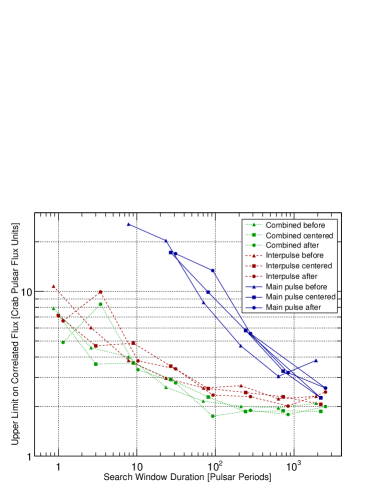
The upper limits on the flux correlated with GRPs at the 95% confidence level are plotted in Figure 10 for 64 of the 72 searches. On the shortest time scales probed, the duration of one pulsar period, a limit of 5-10 times the average Crab pulsar flux is set on the inter-pulse and the combined inter-pulse and main pulse searches. For 8 of the searches performed around main pulse GRPs, the posterior probability curve had not converged to zero before a flux value of 50 times the measured flux. This is due to the low rate of main pulse GRPs detected at 8.9 GHz, which resulted in a small number of selected gamma-ray events in some of the main pulse GRP searches. The relatively large fluctuations inherent in small-number statistics result in wide posterior probability curves and, thus, very high upper limit values. We do not quote a 95% confidence level upper-limit value for these searches, but note that it is likely around 50 times the average gamma-ray flux. As the search window size is increased, and thus the statistical sample increases, these fluctuations decrease and the upper-limit values become more constraining. Once enough of the gamma-ray sample is selected due to the increasing size of the search windows, the upper-limit values level out at 2-2.5 times the average Crab pulsar flux. We note that for the longest two search windows, 729 and 2187 periods, between 70% and 80% of the VERITAS events are selected in the interpulse and combined searches resulting in a reduced enhancement sensitivity in these searches 555The 70% and 80% values were determined without inclusion of the data acquired on the first day of observations where our GRP count was relatively low..
5.3. Estimation of Uncertainty
As stated earlier, the fraction of Monte-Carlo searches which yield the same number of correlated events as were found in the data, , was determined from a Poisson fit to the distributions, rather than from the distributions themselves. By adopting this procedure we found that fluctuations in the posterior probability density curves are dramatically reduced, while having little effect on the computed 95% confidence level upper-limit values. We investigated the uncertainty on the posterior probability values due to the finite statistics in the Monte-Carlo distributions and the Poisson fitting procedure.
The values were determined between a given Monte-Carlo distribution and Poisson curves with a range of mean values centered on the best fit Poisson mean value. From these values, a fit probability versus Poisson mean curve was generated, and from this curve, random values were drawn. A histogram of values was then compiled using Poisson curves with these random values as their mean. The standard deviation of this histogram was then used as the uncertainty on the value determined from the best fit Poisson curve. The uncertainty on the probability values determined in this way is less than 15% for the bulk of distributions but is occasionally as large as 30%. The error bars on the probability values plotted in Figure 9 were calculated in this way. Other methods to calculate the uncertainty were investigated and found, in general, to yield a smaller uncertainty value. Folding the uncertainty on the probability values into the cumulative distribution, however, the uncertainly on the 95% confidence level upper-limit value was found to be less than 3% for the 64 searches which yielded a limiting value. This underlines the robustness of the procedure we used to calculate the upper-limit values.
5.4. Selecting only the most energetic GRP events
Having investigated GRPs whose peak flux density is greater than 7 above the averaged radio signal and observed no VHE enhancement, we now consider only the most energetic GRP events. Due to the low rate of GRP events in the 2008 data set, the following analysis uses the data collected in 2009 only.
Earlier, we estimated that the system equivalent flux density for the 2009 observations was 0.7 Jy. The sampling interval for these observations was 3.2 s. Thus, the energy of a GRP is
| (4) |
where is the signal-to-noise ratio of the GRP and is the width of the GRP in samples (see Bilous et al. (2012), for more details regarding the energy calculation of GRPs). The effective width of each GRP is determined from the width of the boxcar function which, when convolved with the radio time series, returns the largest S/N value for a given pulse. The widest GRP found had a width of 14 samples, or s.
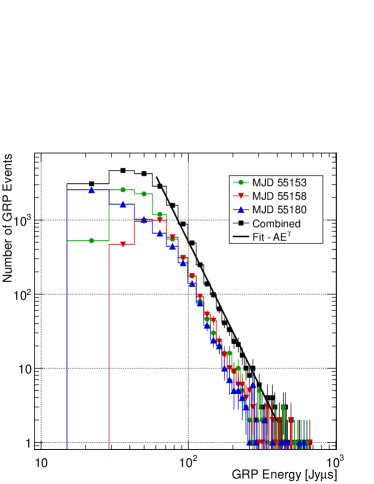
In order to have a common energy scale for observations taken on different nights, we must correct for the effects of RISS. This was done by compiling average radio pulse profiles on 80-minute time scales, which is the characteristic time scale of RISS for the Crab at 8.9 GHz. The profile for the second half of the observing session on MJD 55180 was the strongest and we chose it as reference pulse profile to which the other profiles were compared. Ratios of the peak S/N values were computed between the reference profile and the other profiles and used as RISS-correction coefficients to scale the GRP energy values computed by Equation 4. Figure 11 shows the resulting distributions of GRP energy, which follow the expected power-law shape with a spectral index of . The roll-off below 60 Jys is caused by a bias in our GRP selection, which was based on peak fluxes and reduces the number of broad weak pulses selected. The different number of GRPs selected below the roll-off on each night of observation is due to the different amount of RISS contributions to the GRP flux densities on a given night.
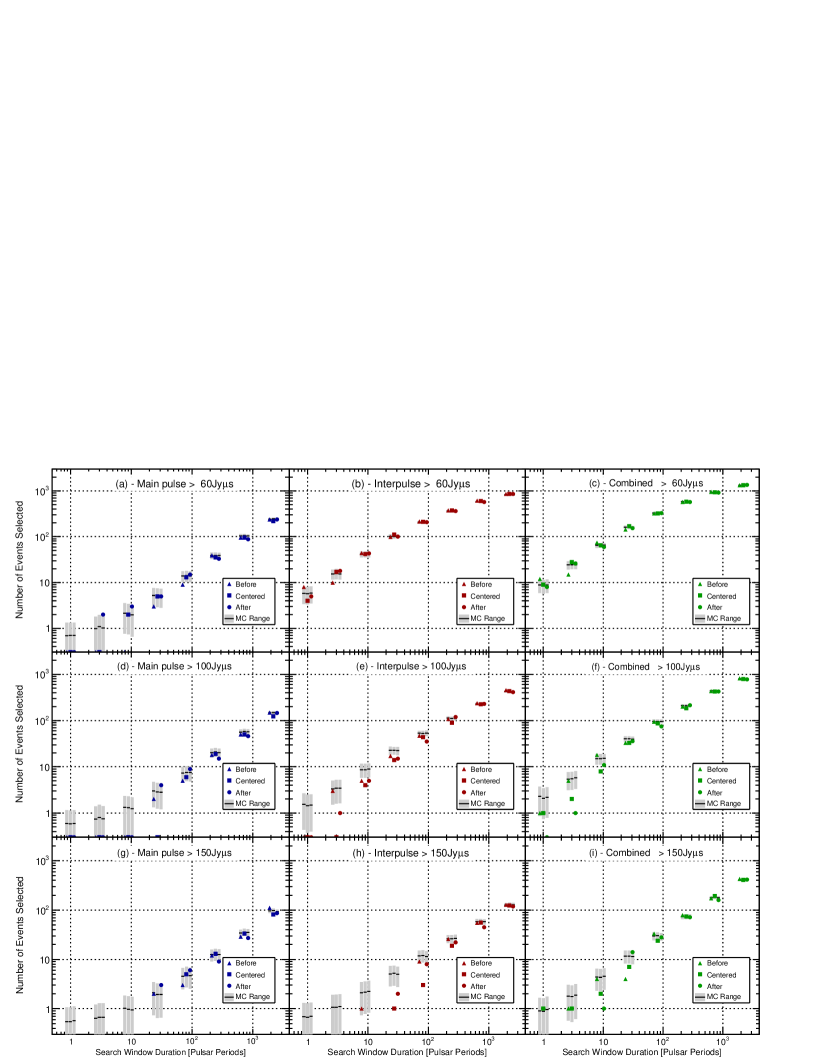
Having computed an RISS-corrected energy value for every GRP event in the 2009 data set, we repeated the correlation search with the VERITAS data. We applied three different energy cuts to the radio events, namely: 60 Jys, 100 Jys, and 150 Jys. The 60 Jys threshold was chosen as a low common energy threshold which provides an unbiased sample of GRPs, independent of both the GRP search bias and the RISS conditions during a particular observing session. The other two thresholds were chosen to be “high” and “very high”, selecting the most energetic 6% and 1% of GRPs, respectively. The results of these searches are plotted in Figure 12. We find no significant enhancement () in the VHE emission correlated with these energetic GRP events.
6. Discussion and Conclusion
Following our study of simultaneous radio and gamma-ray data we observe no significant enhancement in VHE gamma-ray emission from the Crab pulsar correlated with GRPs observed at 8.9 GHz. Our findings are similar to those previously reported at lower gamma-ray and X-ray energies (Lundgren et al., 1995; Bilous et al., 2011, 2012). Given the level of uncertainty in theories of GRP emission, it is hard to draw firm conclusions resulting from the lack of any observed correlation with VHE emission. We are not aware of any theory with quantitative predictions of correlated emission between GRPs and VHE emission. GRP-emission mechanisms associated with changes in plasma coherence will not cause enhancements in incoherent emission. Small and localised changes in the pair-creation rate, which can explain the small (3%) optical enhancements previously measured by Shearer et al. (2003), would yield VHE flux enhancements which are below our sensitivity.
Enhanced gamma-ray emission in connection with high-frequency interpulse GRPs, as postulated by Lyutikov (2007), is not observed. In this model the primary beam, which generates coherent GRPs through anomalous cyclotron resonance, also emits curvature gamma rays with energies in the tens of GeV range. It has since been realised that there is a solid upper limit on the energy of curvature radiation in the Crab, GeV (Lyutikov et al., 2012). This is due to the equivalence of the rate of energy loss and rate of acceleration gains achieved by charged particles energised in the outer magnetosphere. Thus, in the Crab pulsar, the curvature photons from the primary beam generally do not reach the VHE energy band. This means that the non-detection of a VHE enhancement, presented here, does not contradict this GRP emission model.
However, it is possible that there is an indirect link between VHE and radio emission for interpulse GRPs. Recent models for the pulsed VHE gamma-rays detected from the Crab suggest that inverse-Compton emission dominates curvature emission at energies above a few GeV in the outer magnetosphere (Lyutikov et al., 2012; Du et al., 2012). A recent study of the Geminga pulsar also supports this scenario (Lyutikov, 2012). In these models, the primary particle beam is accelerated in a modest electric field (of few percent of the magnetic field strength) in the outer magnetosphere and produces curvature emission up to 10 GeV. Photons in the VHE band are generated by secondary pairs which up-scatter their own cyclotron or synchrotron emission. Within the framework of the high-frequency interpulse GRP emission model of Lyutikov (2007), a VHE-GRP connection is thus still expected. In this model, roughly half of the energy of the plasma beam, energised in the magnetic reconnection event, goes into the production of a secondary plasma which can in turn generate enhanced VHE gamma-ray emission via synchrotron self-Compton scattering. The level of the VHE enhancement is, however, difficult to estimate given the uncertainties and fluctuations in the properties of both the primary and secondary beams. This enhancement is likely below the sensitivity of present VHE instruments.
In the model of pulsed VHE emission from the Crab pulsar of Aharonian et al. (2012), where pulsed X-ray emission originating in the magnetosphere is up-scattered to VHE energies in the wind beyond the light cylinder, a GRP-VHE correlation should exist at most at the same level as a GRP-X-ray correlation. Since no GRP-X-ray correlation is seen (Bilous et al., 2012) and the upper limit on the enhanced X-ray flux is 30%, any corresponding VHE enhancement is expected to be below 30% and thus below our sensitivity.
References
- Abdo et al. (2010) Abdo, A. A., et al. 2010, ApJ, 708, 1254
- Aharonian et al. (2012) Aharonian, F. A., Bogovalov, S. V., & Khangulyan, D. 2012, Nature, 482, 507
- Aleksić et al. (2012) Aleksić, J., et al. 2012, A&A, 540, A69
- Aliu et al. (2011) Aliu, E., et al. 2011, Science, 334, 69
- Argyle et al. (1974) Argyle, E., Baird, G., Grindlay, J., Helmken, H., & Omongain, E. 1974, Nuovo Cimento B Serie, 24, 153
- Bilous et al. (2011) Bilous, A. V., Kondratiev, V. I., McLaughlin, M. A., Ransom, S. M., Lyutikov, M., Mickaliger, M., & Langston, G. I. 2011, ApJ, 728, 110
- Bilous et al. (2012) Bilous, A. V., McLaughlin, M. A., Kondratiev, V. I., & Ransom, S. M. 2012, ApJ, 749, 24
- Burke-Spolaor et al. (2012) Burke-Spolaor, S., et al. 2012, MNRAS, 423, 1351
- Cordes et al. (2004) Cordes, J. M., Bhat, N. D. R., Hankins, T. H., McLaughlin, M. A., & Kern, J. 2004, ApJ, 612, 375
- Davies & Cotton (1957) Davies, J. M., & Cotton, E. S. 1957, Solar Energy, 1:2-3, 16
- Du et al. (2012) Du, Y. J., Qiao, G. J., & Wang, W. 2012, ApJ, 748, 84
- Fierro et al. (1998) Fierro, J. M., Michelson, P. F., Nolan, P. L., & Thompson, D. J. 1998, ApJ, 494, 734
- Fomin et al. (1994) Fomin, V. P., Stepanian, A. A., Lamb, R. C., Lewis, D. A., Punch, M., & Weekes, T. C. 1994, Astroparticle Physics, 2, 137
- Hankins & Eilek (2007) Hankins, T. H., & Eilek, J. A. 2007, ApJ, 670, 693
- Hankins et al. (2003) Hankins, T. H., Kern, J. S., Weatherall, J. C., & Eilek, J. A. 2003, Nature, 422, 141
- Hillas (1985) Hillas, A. M. 1985, in International Cosmic Ray Conference, Vol. 3, International Cosmic Ray Conference, ed. F. C. Jones, 445–448
- Hofmann et al. (1999) Hofmann, W., Jung, I., Konopelko, A., Krawczynski, H., Lampeitl, H., & Pühlhofer, G. 1999, Astroparticle Physics, 12, 135
- Holder et al. (2006) Holder, J., et al. 2006, Astroparticle Physics, 25, 391
- Knight (2006) Knight, H. S. 2006, Chinese Journal of Astronomy and Astrophysics Supplement, 6, 020000
- Krawczynski et al. (2006) Krawczynski, H., Carter-Lewis, D. A., Duke, C., Holder, J., Maier, G., Le Bohec, S., & Sembroski, G. 2006, Astroparticle Physics, 25, 380
- Kuiper et al. (2001) Kuiper, L., Hermsen, W., Cusumano, G., Diehl, R., Schönfelder, V., Strong, A., Bennett, K., & McConnell, M. L. 2001, A&A, 378, 918
- Lundgren et al. (1995) Lundgren, S. C., Cordes, J. M., Ulmer, M., Matz, S. M., Lomatch, S., Foster, R. S., & Hankins, T. 1995, ApJ, 453, 433
- Lyne et al. (1993) Lyne, A. G., Pritchard, R. S., & Graham-Smith, F. 1993, MNRAS, 265, 1003
- Lyutikov (2007) Lyutikov, M. 2007, MNRAS, 381, 1190
- Lyutikov (2012) Lyutikov, M. 2012, ApJ, 757, 88
- Lyutikov et al. (2012) Lyutikov, M., Otte, N., & McCann, A. 2012, ApJ, 754, 33
- Mineo et al. (2006) Mineo, T., Ferrigno, C., Foschini, L., Segreto, A., Cusumano, G., Malaguti, G., Di Cocco, G., & Labanti, C. 2006, A&A, 450, 617
- Moffett & Hankins (1996) Moffett, D. A., & Hankins, T. H. 1996, ApJ, 468, 779
- Oosterbroek et al. (2008) Oosterbroek, T., et al. 2008, A&A, 488, 271
- Popov et al. (2006) Popov, M. V., Soglasnov, V. A., Kondrat’Ev, V. I., Kostyuk, S. V., Ilyasov, Y. P., & Oreshko, V. V. 2006, Astronomy Reports, 50, 55
- Popov & Stappers (2007) Popov, M. V., & Stappers, B. 2007, A&A, 470, 1003
- Romani (1996) Romani, R. W. 1996, ApJ, 470, 469
- Shearer et al. (2003) Shearer, A., Stappers, B., O’Connor, P., Golden, A., Strom, R., Redfern, M., & Ryan, O. 2003, Science, 301, 493
- Soglasnov (2007) Soglasnov, V. 2007, in WE-Heraeus Seminar on Neutron Stars and Pulsars 40 years after the Discovery, ed. W. Becker & H. H. Huang, 68
- Weekes et al. (1989) Weekes, T. C., et al. 1989, ApJ, 342, 379