A Monte Carlo Approach to Measure the Robustness of Boolean Networks
Abstract
Emergence of robustness in biological networks is a paramount feature of evolving organisms, but a study of this property in vivo, for any level of representation such as Genetic, Metabolic, or Neuronal Networks, is a very hard challenge. In the case of Genetic Networks, mathematical models have been used in this context to provide insights on their robustness, but even in relatively simple formulations, such as Boolean Networks (BN), it might not be feasible to compute some measures for large system sizes. We describe in this work a Monte Carlo approach to calculate the size of the largest basin of attraction of a BN, which is intrinsically associated with its robustness, that can be used regardless the network size. We show the stability of our method through finite-size analysis and validate it with a full search on small networks.
category:
G.3 Mathematics of Computing Probability and Statisticscategory:
I.1.2 Computing Methodologies Algorithmskeywords:
Boolean Network, Network Robustness1 Introduction
Robustness in biological organisms is one of the major characteristics which contributes to their survival in the environment, maintaining its functions in face of external and internal perturbations [10, 11]. Despite its importance, the complete understanding of the mechanisms behind this underlying property is still not possible, as in vivo studies are a very hard challenge due to knowledge limitations. In this context, mathematical abstractions of the interactions that constitute an organism are powerful tools to provide explanations about biological robustness, especially regarding the robustness present in some biological networks [13, 22].
In general, it is expected that phenotype robustness is a consequence of a specific set of rules or patterns in the interrelationship among the genes of an organism [23]. Hence, theoretical models of Gene Regulatory Networks might be able to provide insights on their robustness. As a relatively simple and rich model, the Boolean Network (BN) model, which consider genes as on-off switches, is often successfully applied when details about gene-gene interactions are absent [15, 1, 17, 6, 7, 8, 9, 14, 16]. Among several key features, attractors (which captures the gene expression patterns that are periodically visited) and the size of their basins (which are made up of all the expression patterns that conduct to this attractors) are measures that can reveal important characteristics of the underlying biological network [12, 18]. More information regarding prospects and limitations of this paradigm can be found in the review written by Bornholdt [3].
The simplification of the Boolean formalism does not solve completely the problem of building a mathematical definition of robustness [11]. A lot of measures have been proposed following different interpretations of the concept, such as Derrida curves [5], identification of Intrinsically Multivariate Prediction Genes [21], and the size of the largest basin of attraction. In this work, we consider robustness as the ability of executing the same activity despite random fluctuations in a limited number of genes. Hence, a network with a large basin of attraction might be considered robust, and the the size of the largest basin of attraction () a good estimation for its robustness.
The ability to measure the largest basin of attraction of a BN in a fast and reliable way will cause a huge impact in the robustness characterization of the most of the available Genetic Networks, which can easily be composed of more than 6000 genes. However, measuring imposes its own challenge, as an exhaustive search has an exponential complexity in the number of genes, making it impractical for large network sizes. In Brun et al. [4] an estimation of is calculated from the steady state distribution of a Probabilistic Boolean Network, but also with an exponential complexity in the number of genes (nodes). This work proposes a Monte Carlo approach to calculate that can be used regardless the network size. It is showed that the proposed methodology is reliable through finite-size analysis. The obtained results were validated by using a full search on small networks.
2 Boolean Network
A Boolean Network (BN) is defined by a set of Boolean variables and a set of Boolean functions . In our context, each variable represents a gene, and it can assume only two possible values: (OFF) or (ON). The value of gene at time is obtained from the values of a set of predictor genes at time through the Boolean function that belongs to .
The number of predictors of is called the in-degree of , and the out-degree of is defined as the number of genes in for which is one of their predictors. We consider in this work that all genes are updated synchronously by the functions in assigned to them.
A state of a BN at time is a binary vector , representing the value of all Boolean variables in the network, roughly describing the genetic activity of the organism (all genes) at a certain time. In this way, the number of all possible states is . Keeping the Boolean function that regulates each gene fixed, and without considering any random fluctuation in the value of the genes, a BN is a deterministic formulation.
The dynamics of a BN can be represented by a directed network, called state transition diagram, in which its nodes correspond to the states of the BN and an arc from one node to another corresponds to a state transition between them. A set of states that is periodically visited is called an attractor of the BN, and all states that eventually lead to this attractor (and including all states in the attractor) are called the basin of attraction. In this work, consider the number of states in the basin of attraction as its size. Finally, define as the size of the largest basin of attraction divided by the total number of states.
3 Method Description
In our method, we assume that the largest basin of attraction is also the easiest to identify, in the sense that a randomly chosen state is more likely to be part of it. Hence, the probability that a randomly chosen state is the largest basin of attraction is equal to the fraction of states in this basin.
To estimate , a Monte Carlo approach is proposed for large networks since a full search is impracticable. We draw a number of states and for each of them the attractor is identified. The most frequent attractor has random states that conduct to it, hence we can assume that the ratio is a good estimator for , i.e., the size of the largest basin divided by the total number of states.
The number of states in an attractor, as well as the average number of time steps that a state in the basin of attraction takes to reach its attractor, were numerically estimated as the function . This in agreement with results provided by Kauffman [9], who considered the attractor size as a polynomial function of the number of nodes. Hence, by considering a randomly chosen network state, we can assume that the number of time steps that it will take to reach all the states in its attractor (i.e., to reach one state in the attractor and, from that state, visit all states in the attractor), is, for most of the cases, . This upper bound implies that the complexity of our algorithm is in the average case.
4 Results and Discussion
The proposed methodology was executed considering different network sizes: from to . Each gene regulatory network is generated as a random graph (Erdős-Rényi (ER) directed graph, with in-degree fixed), characterized by a Poisson distribution of out-degrees. For comparison, we perform a full search of the largest basin of attraction on the smaller gene network sizes, . For each gene regulatory network size, the value of is the average of 100 randomly generated networks.
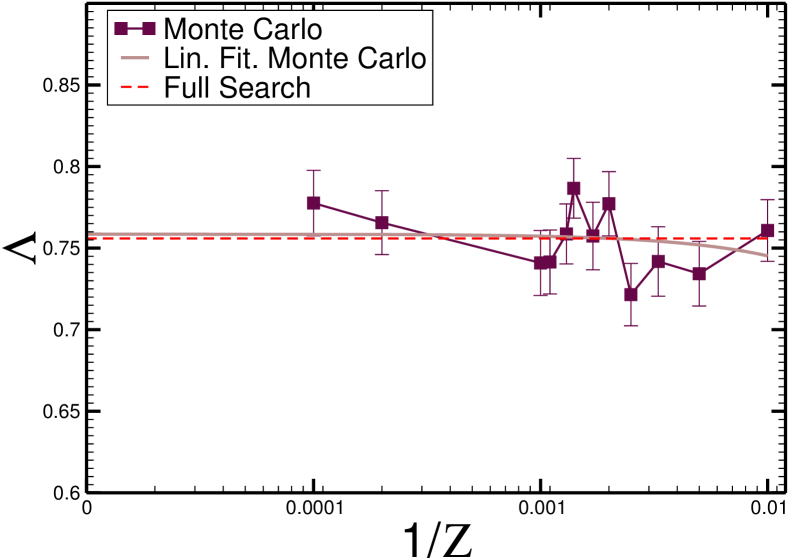
In our proposal, the number of initial random states is a very important parameter to be determined, as if our method is much less costly than the exponential complexity of the full search. By computing the value of against in Figure 1, we show that: a value for , as small as , already provides a good estimation for a network of states, and that the full search estimation, , is recovered for a sufficient large value of .
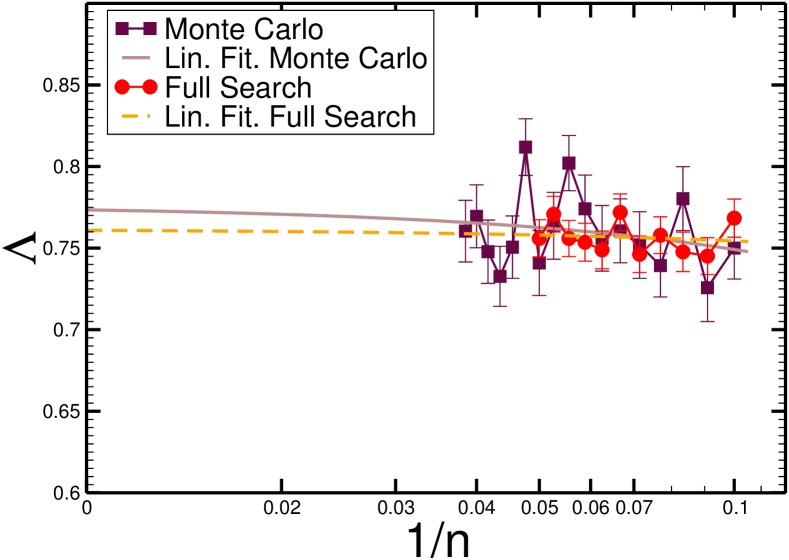
For a fixed value of at , we measure for different network sizes in Figure 2, which also presents the value of calculated through a full search for small network sizes. Our proposal estimates within the interval , in accordance with the full search, despite the fact that is much smaller than , for . Both methods also point to a similar value of in networks of infinite size.
5 Conclusion
We describe in this work a fast and reliable strategy to measure the largest basin of attraction of a BN. The proposed method has a polynomial complexity on the number of states and the obtained results is in full agreement with full search results for small networks, in the limit of an infinite number of genes. Besides that, our work is a proof-of-concept that Monte Carlo estimation might be successfully applied in measures related to Boolean Networks.
We hope with this method to provide a powerful tool to future studies about robustness in biological organisms. From this, it is possible to compare, for instance, the robustness of the Gene Regulatory Networks of the yeast with a random network of the same size, roughly with genes, possibly identifying features that enhance the size of the largest basin of attraction.
There are rooms for improvement in our method as well. As shown by Linch [19, 20], the average size of the attractors is superpolinomial in the number of nodes. Hence, for large values of , the complexity of our method could be better estimated if the function were precisely described. Besides that, the choice of could be improved, as a better estimation could be made considering as an increasing function of .
It is known that some biological networks have different topologies, such as scale-free [24, 2] and small-world [25]. Another possible direction would be to apply the proposed methodology in larger networks with different topologies. Also, topological characteristics of the state transition diagram could be used to improve the efficiency of our method, for instance considering more tractable BNs where the input of each Boolean function is equal to one.
6 Acknowledgments
The authors would like to thank the Brazilian agencies CAPES, FAPESP, Microsoft-Research and Conselho Nacional de Pesquisa (CNPq) for the financial support.
References
- [1] I. Albert, J. Thakar, S. Li, R. Zhang, and R. Albert. Boolean network simulations for life scientists. Source Code for Biology and Medicine, 3(1):16, 2008.
- [2] R. Albert. Scale-free networks in cell biology. J Cell Sci, 118(21):4947–4957, 2005.
- [3] S. Bornholdt. Boolean network models of cellular regulation: prospects and limitations. Journal of the Royal Society, 5(1):S85–S94, Aug. 2008.
- [4] M. Brun, E. R. Dougherty, and I. Shmulevich. Steady-state probabilities for attractors in probabilistic boolean networks. Signal Process, 85(10):1993–2013, 2005.
- [5] B. Derrida and Y. Pomeau. Random networks of automata: A simple annealed approximation. Europhysics Letters, 1(2):45–49, 1986.
- [6] C. Higa, V. H. P. Louzada, T. Andrade, and R. F. Hashimoto. Constraint-based analysis of gene interactions using restricted boolean networks and time-series data. BMC proceedings, page S5, 2011.
- [7] S. Kauffman. Metabolic Stability and Epigenesis in Randomly Constructed Genetic Nets. Journal of Theoretical Biology, 22:437–467, 1969.
- [8] S. Kauffman. Gene regulation networks: A theory for their global structure and behaviors. Current Topics in Developmental Biology, 6:145–182, 1971.
- [9] S. Kauffman. The Origins of Order: Self-Organization and Selection in Evolution. Oxford University Press, USA, 1 edition, June 1993.
- [10] H. Kitano. Biological robustness. Nature Genetics, 5:826–837, 2004.
- [11] H. Kitano. Towards a theory of biological robustness. Molecular Systems Biology, 3(137), 2007.
- [12] F. Li, T. Long, Y. Lu, Q. Ouyang, and C. Tang. The Yeast Cell-Cycle Network is Robustly Designed. PNAS, 101(14):4781–4786, 2004.
- [13] S. Li, S. M. Assmann, and R. Albert. Predicting essential components of signal transduction networks: A dynamic model of guard cell abscisic acid signaling. PLoS Biol, 4(10):e312, 09 2006.
- [14] F. M. Lopes, R. M. Cesar, and L. d. F. Costa. Gene expression complex networks: Synthesis, identification, and analysis. Journal of Computational Biology, 18(10):1353–1367, 2011.
- [15] F. M. Lopes, R. M. Cesar-Jr, and L. d. F. Costa. AGN simulation and validation model. In Advances in Bioinformatics and Computational Biology, Proceedings, volume 5167 of Lecture Notes in Bioinformatics, pages 169–173. Springer-Verlag Berlin, 2008.
- [16] F. M. Lopes, E. A. de Oliveira, and R. M. Cesar-Jr. Inference of gene regulatory networks from time series by Tsallis entropies. BMC Systems Biology, 5(1):61, 2011.
- [17] F. M. Lopes, D. C. Martins-Jr, and R. M. Cesar-Jr. Comparative study of GRNs inference methods based on feature selection by mutual information. In 2009 IEEE International Workshop on Genomic Signal Processing and Statistics (GENSIPS 2009), pages 110–113. IEEE Signal Proc Soc, IEEE, May 2009.
- [18] V. H. P. Louzada, F. M. Lopes, and R. F. Hashimoto. The effect of certain boolean functions in stability of networks with varying topology. IEEE International Workshop on Genomic Signal Processing and Statistics (GENSIPS), pages 21–24, 2011.
- [19] J. F. Lynch. A criterion for stability in random boolean cellular automata. Ulam Quarterly, 2:32–44, 1993.
- [20] J. F. Lynch. On the threshold of chaos in random boolean cellular automata. Random Structures and Algorithms, 6:239–260, 1995.
- [21] D. C. Martins-Jr, U. Braga-Neto, R. F. Hashimoto, E. R. Dougherty, and M. L. Bittner. Intrinsically multivariate predictive genes. IEEE Journal of Selected Topics in Signal Processing, 2(3):424–439, June 2008.
- [22] R. Serra, M. Villani, and A. Semeria. Genetic network models and statistical properties of gene expression data in knock-out experiments. Journal of Theoretical Biology, 227(1):149–157, 2004.
- [23] S. C. Stearns. Progress on canalization. PNAS, 99(16):10229–10230, 2002. Commentary.
- [24] J. M. Stuart, E. Segal, D. Koller, and S. K. Kim. A gene-coexpression network for global discovery of conserved genetic modules. Science, 302(5643):249–255, 2003.
- [25] D. J. Watts and S. H. Strogatz. Collective dynamics of small-world networks. Nature, 393:440–442, 1998.