The Effect of Environment on Discs and Bulges
Abstract
We examine the changes in the properties of galactic bulges and discs with environment for a volume-limited sample of nearby galaxies from SDSS. We focus on galaxies with classical bulges. Classical bulges seem to have the same formation history as ellipticals of the same mass, and we test if environment determines whether or not a classical bulge possesses a disc. Using the projected fifth nearest neighbour density as a measure of local environment, we look for correlations with environment at fixed bulge stellar mass. In groups with fewer than 20 members, we find no evidence for changes in disc morphology with local density. At fixed bulge mass, disc mass and disc scale length are independent of local density. However, disc colour does increase ( mag) as a function of local density in relatively poor groups. Therefore, the colour–density relation for classical bulgedisc galaxies in the field and in poor groups is due solely to changes in disc colour with density. In contrast, we find no correlations between disc colour and local density for classical bulgedisc galaxies in large, relaxed groups and clusters. However, there is a weak correlation between disc mass and group crossing time, suggesting morphological transformation takes places in rich groups. Our results add to the evidence that star formation is quenched in group environments, instead of clusters, and that star formation quenching and morphological transformation are separate processes. Overall, we show that environment has two effects on galactic discs: relatively low density environments can quench star formation in discs, while processes occurring in higher density environments contribute to the morphological transformation from disc-dominated systems to bulge-dominated systems.
keywords:
galaxies: structure – galaxies: bulges – galaxies: formation – galaxies: photometry1 Introduction
Galaxy morphology, stellar mass, star formation rate, and projected number density are all known to correlate. Generally, massive galaxies are bulge-dominated (de Vaucouleurs, 1961; Blanton et al., 2003), not forming stars (red) (Strateva et al., 2001; Kauffmann et al., 2004; Baldry et al., 2006), and reside in high density regions (Oemler, 1974; Dressler, 1980; Postman & Geller, 1984; Goto et al., 2003; Lewis et al., 2002; Gómez et al., 2003; Yang et al., 2007; Bamford et al., 2009). Low mass galaxies are disc-dominated, star-forming (blue), and reside in low density regions. There are, of course, exceptions: passive discs make up a significant fraction of the red sequence (e.g. Bernardi et al., 2003a; Maller et al., 2009), blue ellipticals are still forming stars (Schawinski et al., 2009), and there are many early-type, passively evolving galaxies in relatively low density regions (e.g. Mulchaey & Zabludoff, 1999). For galaxies which follow the general pattern, it is unclear which of the correlations mentioned above are the result of physical processes, and which, if any, are simply consequences of other correlations. Morphology, star formation, and density are all strongly correlated with stellar mass (e.g. Hamilton, 1988; Brinchmann & Ellis, 2000; Blanton et al., 2003; Kauffmann et al., 2004; Blanton et al., 2005; Thomas et al., 2005), and correlations between these properties are partially due to their correlations with stellar mass. Yet, at fixed stellar mass, studies have found correlations between density and morphology (Bamford et al., 2009), density and stellar age (Thomas et al., 2005; Cooper et al., 2010), density and colour (Balogh et al., 2004; Skibba et al., 2009; Cibinel et al., 2012), and density and star formation rate (Kauffmann et al., 2004; Christlein & Zabludoff, 2005). Furthermore, at fixed luminosity, neither blue nor red galaxy colours seem to depend on density, i.e. blue galaxies do not get redder as a function of density, only their number fraction decreases (Balogh et al., 2004; Hogg et al., 2003). Furthermore, correlations with morphology and density seem to disappear for high mass galaxies (e.g. Tasca et al., 2009; Grützbauch et al., 2011).
The local correlations between galaxy properties and density extend to higher redshift; the morphology–density and colour–density relations are in place by (Dressler et al., 1997; Postman et al., 2005; Treu et al., 2003; Smith et al., 2005), but the relations do evolve with redshift. The fraction of blue galaxies in high density regions increases with redshift (e.g. Butcher & Oemler, 1978), while the fraction of S0s and red discs galaxies decreases with increasing redshift (Smith et al., 2005; Moran et al., 2007; Bundy et al., 2010; Bruce et al., 2012). In addition, the hierarchical growth of structure implies that galaxies generally move from low density regions to high density regions as a function of time. Therefore, any environmental effects and trends will be more pronounced today than in the past (Tasca et al., 2009).
From these observations, a general outline of galaxy evolution has been developed. At early times, galaxies are blue, intensely star-forming, disc systems. As galaxies become more massive, star formation is quenched (by internal feedback mechanisms), creating a population of red, massive galaxies. This mass quenching (Peng et al., 2010) is compounded by environmental effects. At fixed mass, galaxies in higher density regions become red and bulge-dominated earlier, creating the colour–density and morphology–density relations. Star formation quenching is thought to occur before morphological transformation, which leads to an increase in the fraction of S0s at intermediate densities (e.g. Dressler, 1980; McIntosh et al., 2004; Cooper et al., 2006; Moran et al., 2007; Bundy et al., 2006). In order to separate the effects of environment from the effects of stellar mass, we examine correlations between galaxy morphologies, colours, and local density at fixed stellar mass.
The physical processes responsible for the environment-driven transformations are unknown, although there are many candidates. Processes can be divided into those which truncate star formation, and those which also cause morphological transformations (see Boselli & Gavazzi, 2006, for a review of these processes). Ram-pressure stripping of ISM from galaxies entering clusters (Gunn & Gott, 1972) and the removal of hot halo gas (strangulation) (Larson et al., 1980; Balogh & Morris, 2000) both act to truncate star formation in discs and can transform spiral discs into S0s, but do not drastically alter a galaxy’s stellar disc. Tidal stripping by the cluster potential (Merritt, 1984) and high speed encounters with other cluster galaxies (harassment) (Moore et al., 1996, 1998; Moore et al., 1999) both act to transform disc-dominated galaxies into bulge-dominated galaxies. All these processes act on a variety of timescales and require different minimum local densities in order to be effective. It is likely that more than one process is responsible for the morphology–density relation.
In this work, we examine low redshift galaxies with both a bulge and disc, and study the correlations of the separate bulge and disc properties with local density. These galaxies, which include S0s, may represent a transition from disc-dominated to bulge-dominated, and the environmental processes enumerated above should have observable effects on the discs and possibly the bulges of these transitional galaxies. For the bulge and disc properties, we use the bulgedisc decompositions from our earlier work (Lackner & Gunn, 2012, hereafter L12). L12 presents bulgedisc decompositions for nearly low redshift () galaxies from the Sloan Digital Sky Survey (SDSS). The galaxies we use for in this work are a luminous subsample from L12.
We focus on galaxies which host classical bulges. These bulges have properties and, presumably, formation histories identical to elliptical galaxies of the same mass. Classical bulges are concentrated, pressure-supported systems (Falcón-Barroso et al., 2002; MacArthur et al., 2008), with old stellar populations (Peletier et al., 1999; Moorthy & Holtzman, 2006; MacArthur et al., 2010, but see Gadotti, 2009). In L12, we model the light profiles of both classical bulges and ellipticals using a de Vaucouleurs profile (but see Caon et al., 1993). We show in L12 that classical bulges and ellipticals follow the same size-density relation (Kormendy, 1977). Taken together, these studies support the assertion that classical bulges and ellipticals of the same stellar mass are indistinguishable. Therefore, by exploring how local density affects the discs around classical bulges, we can determine if changes in environment correspond to a transition from classical bulges with discs to disc-less elliptical galaxies.
To date, there have been a handful of studies which explore the effects of environment on bulges and discs separately. Both McIntosh et al. (2004) and Hudson et al. (2010) show that disc colour is a function of cluster radius. McIntosh et al. (2004) also show that the amount of substructure in discs declines with increasing density, further demonstrating that star formation is quenched in dense environments. The sample we use in this work is considerably larger than the samples in previous studies, and it covers the entire spectrum of local densities, not just rich clusters and the field. Furthermore, our large sample can easily be divided into subsamples of constant bulge mass, eliminating trends with stellar mass and environment, and still yield statistically significant results.
Below, we use our sample of classical bulgedisc galaxies to determine whether the colour–density relation for these galaxies is due to changes in bulge or disc colour, indicating star formation truncation, or changes in bulge-to-total ratio, indicating morphological transformation. We find that the colour–density relation for these galaxies at fixed bulge mass is due entirely to changes in disc colour, not changes in disc mass or size. Next, we divide the sample into rich and poor groups to determine if the trends in disc properties with environment depend on group size or halo mass. We find that while disc colour is a function of local density in relatively poor groups, disc colour is independent of local density in larger, relaxed groups and clusters. However, Disc mass decreases slightly with increasing local density in large groups and clusters, while disc mass is independent of local density for galaxies in the field and in poor groups. From these results, we conclude that environment-driven star formation quenching occurs in relatively low density environments, while structural changes to discs only occur in higher density environments.
In order to perform the studies detailed above, we require a robust sample of classical bulgedisc galaxies. It is especially important to distinguish classical bulgedisc galaxies from disc-less ellipticals. We present a probabilistic method for separating classical bulge hosts and ellipticals using bulgedisc decompositions in Section 2.1.1. The remainder of Section 2 details the environment metrics employed. In order to determine group membership and local density, we use an updated group catalogue from A. Berlind, (priv. comm.), which is based on the group catalogues presented in Berlind et al. (2006). Section 3 presents the morphology–density relation and colour–density relation for our sample. The results of this section help to confirm the assignment of galaxy morphologies in Section 2.1.1. Sections 4 and 5 are devoted to the correlations between environment and bulge and disc properties. Section 4 focuses on correlations with projected local density, while Section 5 discusses classical bulgedisc galaxies in relatively rich groups.
Throughout this paper we use the cosmology: , , and .
2 Sample
The sample used in the work consists of a luminous subsample of galaxies from our earlier bulgedisc decompositions matched to an updated group catalogue from A. Berlind (priv. comm.). This group catalogue employs the method presented in Berlind et al. (2006), but uses data from SDSS data release 7. The sample contains galaxies and is complete to an absolute band magnitude of and covers the redshift range . Below, we describe the bulgedisc decompositions and the environmental information extracted from the group catalogue.
2.1 Bulge-Disc Decompositions
For the bulge and disc properties, we use the results of our earlier work (L12). L12 presents bulgedisc decompositions for galaxies from SDSS data release 8 (the data is the same as that in data release 7, but the reductions have been improved). The galaxies have redshifts between and . All of the galaxies are in the SDSS spectroscopic sample, which implies a limiting magnitude of . Two dimensional bulge-disc decompositions are performed for the band images. The results are then linearly scaled to fit the galaxy images in the , , , and bands, yielding colours for the bulge and disc components. Because we only linearly scale the fits in each band, our bulgedisc models do not take into account colour gradients within each component. Each galaxy is fit with different models: a de Vaucouleurs bulge and an exponential disc ( B+D), an exponential bulge and exponential disc ( B+D), a single de Vaucouleurs profile, a single exponential profile, and a single Sérsic profile.
The two bulgedisc models allow us to fit both elliptical-like, pressure-supported classical bulges (de Vaucouleurs profile) and disc-like, rotationally-supported pseudo-bulges (exponential profile) (Kormendy, 1977, 1993; Fisher & Drory, 2008). Pseudo-bulges are thought to arise from secular processes within discs, such as bar-driven instabilities (e.g. Kormendy & Kennicutt, 2004; Athanassoula, 2005; Weinzirl et al., 2009), and, as such, have very different formation histories than classical bulges (but see Elmegreen et al., 2009). Often, pseudo-bulges are still forming stars today (Kormendy & Kennicutt, 2004; Fisher, 2006). Since pseudo-bulges are a disc phenomenon, we do not include them in our sample of bulgedisc galaxies.
For each galaxy, we tabulate the bulge and disc magnitudes and
colours in all SDSS bands. These values are Galactic extinction corrected
(Schlegel et al., 1998) and k-corrected to using the IDL package
kcorrect v4_2 (Blanton &
Roweis, 2007). In addition, we
correct the colours and magnitudes of galaxies with discs for
intrinsic extinction using corrections from Maller et al. (2009) and
L12. These corrections remove trends in colours with disc inclination,
but they do not correct for extinction due to dust in face-on
discs. Finally, we
calculate the stellar masses for the bulge and disc using the relation
from Bell et al. (2003):
| (1) | ||||
where accounts for the difference between the diet Salpeter initial mass function (IMF) used by Bell et al. (2003) and the Kroupa IMF (Kroupa, 2002) we employ. The colours and magnitudes used for the stellar mass are not corrected for intrinsic extinction, in keeping with the derivation of the relation in Bell et al. (2003). Because the mass-to-light ratio is a convex function of galaxy colour, the sum of the masses of the bulge and disc is always slightly larger than the mass measured using the total galaxy colour and magnitude. For most of the galaxies, this difference is small; the median is , and for per cent of the galaxies, this ratio is between and .
2.1.1 Classifying Galaxies
Since we fit each galaxy with five different models, we require a method for selecting the best-fitting model. In L12, we show that the values of the various model fits are indistinguishable at the resolution of SDSS (but see Simard et al., 2011). Instead, we develop an algorithm that relies on the sizes, shapes, and colours of the bulges and discs in order to select the best-fitting, physically-sensible model for each galaxy. In this work, we present a simplified classification algorithm that attempts to classify most of the galaxies in our sample and emphasises the distinction between classical bulge galaxies and ellipticals. Additionally, instead of assigning each galaxy a best-fitting model, we assign each galaxy a probability of being fit by each model (often, the probability is unity for one of the models). Although this does not allow us to accurately classify a given galaxy, it does allow us to study the properties of a large sample of galaxies. When we examine properties of bulges and discs, we weight each galaxy by its probability of having a bulge and a disc.
| Type | Num | Classification |
|---|---|---|
| elliptical | 3681 | either or bulge and disc and statistically separated from red BD galaxies based on disc axis ratio (Fig. 20) |
| classical BD | 12523 | if bulge and disc , statistically separated from ellipticals based on disc axis ratio (Fig. 20); otherwise, selected to be quiescent based on to distinguish from pseudo-bulge hosts(Fig. 21) |
| pseudo BD | 5361 | bulge or disc and statistically separated from classical bulge hosts based on ; pseudo-bulges are selected to be star-forming |
| bulgeless disc | 8505 | |
| unclassifiable | 2857 | none of the above categories, typically blue, disc-like irregulars |
We separate galaxies into five different categories: bulge-less disc galaxies, disc-less ellipticals, classical bulgedisc galaxies, pseudo-bulgedisc galaxies, and unclassifiable galaxies. Our goal is to assemble a sample of galaxies which are accurately modelled by a classical bulge plus a disc. A brief outline of the classification is given below and summarised in Table 1. Details can be found in Appendix A.
First, we identify bulge-less and disc-less galaxies. Bulge-less disc galaxies are defined to have per cent. Disc-less galaxies (ellipticals) are more difficult to identify. The few galaxies with per cent are considered ellipticals. These make up only per cent of the our sample. As shown in L12 (see also Allen et al., 2006), elliptical galaxies are often best fit by a de Vaucouleurs component along with a low surface brightness exponential component. This “disc” is not a physical disc and has several possible origins, i.e. the outer halo of ellipticals, a Sérsic index larger than four, and/or inadequate sky subtraction around bright galaxies in SDSS. These model “discs” make ellipticals indistinguishable from face-on bulgedisc galaxies based on the 2-dimensional bulgedisc decomposition alone.
However, the distributions of inclination angles for real and spurious discs will be different; the former will be randomly oriented, while the latter will be preferentially face-on. We use this fact to statistically separate ellipticals from face-on classical bulge host galaxies. Galaxies with a small measured disc axis ratio have a high probability of being a bulgedisc galaxy, while galaxies with a large disc axis ratio (face-on) might be either a bulgedisc galaxy or an elliptical with an exponential halo. For this statistical separation, we examine galaxies with and for both the bulge and disc component. This means all the ellipticals we find will be red. Restricting ourselves to red galaxies will enhance the fraction of ellipticals relative to bulgedisc galaxies, making the two inclination angle distributions easier to fit. Blue ellipticals are relatively rare (Schawinski et al., 2009), and, therefore, are a small contamination in our sample of classical bulge host galaxies.
After setting aside ellipticals, we distinguish between galaxies with quiescent bulges and those with young, star-forming bulges based on the 4000Å break strength () measured by SDSS111http://www.mpa-garching.mpg.de/SDSS/DR7/raw_data.html. Based on results from morphology studies at higher resolution (e.g. Fisher, 2006), we associate star-forming bulges with pseudo-bulges and quiescent bulges with classical bulges. As above, we assign each galaxy a probability of having a classical bulge or pseudo-bulge based on its (see Fig. 21). Since pseudo-bulges are a disc phenomenon, we consider galaxies with pseudo-bulges to be bulge-less and exclude them from our analysis. Because per cent of the star-forming bulges are less massive than the median classical, quiescent bulge in our sample, excluding pseudo-bulge hosts does not significantly affect correlations in galaxy properties with local density at fixed bulge mass. However, the separation of quiescent and star-forming bulges will eliminate any star-forming classical bulges from our sample.
Finally, we exclude galaxies which are not well fit by any of the above models. These galaxies are modelled by a single Sérsic profile. Unclassifiable galaxies make up less than 10% of our sample. Seventy-five percent of unclassifiable galaxies have a Sérsic index less than and the same fraction lie in the blue cloud (). These galaxies are probably disc-like irregulars, which are unlikely to have a well-defined bulge and disc. The remaining per cent of unclassifiable galaxies are mostly merger remnants, starbursts, and other complicated morphologies. None the less, because the majority of unclassifiable galaxies exhibit disc-like properties, we group them with other bulge-less galaxies.
Below, we use a bright () subsample of galaxies from the L12 sample. This sample contains classical bulgedisc galaxies, ellipticals, pseudo-bulge galaxies, bulge-less galaxies, and unclassifiable galaxies. These numbers are inexact, since we only assign each galaxy a probability of being a certain type.
2.2 Group Catalogues
We study the environmental properties of bulges and discs using the group catalogue from A. Berlind (priv. comm.). This catalogue is built using the methods in Berlind et al. (2006), but is based on SDSS data release 7 instead of data release 4. The group catalogue allows us to relate galaxy properties to their host group (and dark matter halo) properties as well as to study the properties of galaxies as a function of intra-group environment. We select this group catalogue from the many group catalogues available for SDSS data because it extends to low redshift, and overlaps significantly with our sample of bulgedisc galaxies. The group catalogue is volume-limited and includes all galaxies with absolute magnitudes in the redshift range . We include isolated galaxies in the group catalogue (groups of richness one). The catalogue is created using a friends-of-friends algorithm to determine group membership (see Berlind et al., 2006, for details). Two galaxies are linked if the projected and transverse distances between them are smaller than and , respectively, where are the linking lengths and is the average galaxy number density in the sample. Here, , , and , which corresponds to physical linking lengths of in the transverse direction and along the line of sight.
In the group catalogue, there are galaxies, of which have a bulgedisc model fit from L12. This subsample includes per cent of the galaxies below with spectroscopic redshifts in the group catalogues. Galaxies without spectroscopic redshifts (due to fibre collisions in the SDSS spectrograph) make up per cent of the sample below , and are therefore a small omission. The remaining galaxies are missing from the L12 bulgedisc sample because cuts in the galaxy axis ratio (), model fits with surface brightness consistent with zero (), and galaxies which did not make our quality cuts due to problems with deblending and cosmic ray removal.
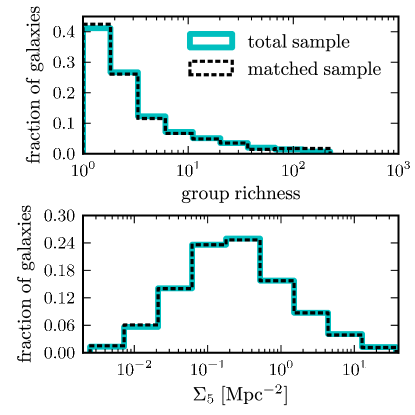
Despite the missing galaxies, the bulgedisc matched sample is a representative subsample of the group catalogue for . This is demonstrated by Fig. 1, which shows the distributions of group sizes and projected fifth nearest neighbour densities (, see §2.3 for explanation) for the full group catalogue and for the subsample which overlaps with the bulgedisc decomposition sample. The bulgedisc sample follows essentially the same distributions in and as the full group catalogue. A Kolmogorov–Smirnov (KS) test shows that the distributions of (lower panel) are indistinguishable. The distributions of group sizes are not identical; a KS test yields a probability of that the distributions are the same. The bulgedisc matched sample is missing galaxies in mid-sized groups, but the number of missing galaxies is small. Furthermore, for the larger groups, the missing galaxies are not a function of position in the group or of local density. This is not surprising, since the number of galaxies missing a spectrum due to fibre collisions is a small fraction ( to per cent) of the sample. If fibre collisions were more prevalent, we would expect to be missing more galaxies in high density regions than in low density regions.
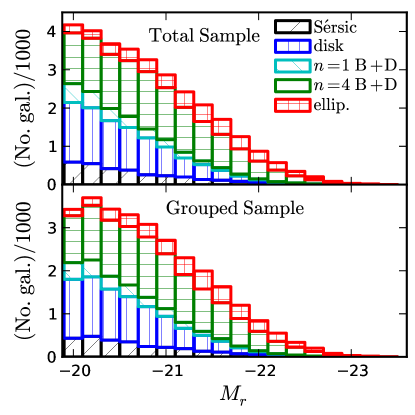
We also check that matching the L12 sample to the group catalogue does not change the distributions of galaxy morphology as a function of magnitude. The top panel of Fig. 2 shows the absolute magnitude distribution of the total L12 sample, down to a magnitude of . The lower panel shows the same for the galaxies from the group catalogue. Although there are small differences at the faint end, the distributions of galaxy morphology as a function of magnitude are essentially the same for the both samples. The fraction of galaxies of each type in the two samples is the same to within galaxies, or per cent of the grouped sample.
In this work, we address the effects of environment on galaxy properties at fixed bulge mass. Therefore, although it is important that certain types of galaxies are not systematically excluded as a function of environment, we are not concerned with the overall completeness of the sample. We are only concerned that the galaxies in the different environments are a representative sample, which is demonstrated by Figs. 1 and 2.
2.3 Measuring environment
In order to examine the correlations between galaxy properties and environment, we use several measures of environment, including both group halo properties and more local measures of environment. Directly from the group catalogue, we obtain the group richness, , the group line-of-sight velocity dispersion, and the total stellar mass in galaxies brighter than . Using the relation between total group stellar mass and halo mass from Leauthaud et al. (2012), we calculate the group dark matter mass, , defined as the mass enclosed in a region times denser than the critical density222Leauthaud et al. (2012) report halo masses as times the critical density. We convert to using the concentration-mass relation from Macciò et al. (2008) for a WMAP5 cosmology.. We do not take into account the difference in stellar mass completeness between our sample and that used in Leauthaud et al. (2012), nor do we correct the stellar masses for contamination from non-group galaxies. However, we expect the corrections to the stellar masses to be small (see Leauthaud et al., 2012).
We can compute the line-of-sight velocity dispersion () for a halo of a given mass using the relation from Yang et al. (2007). For groups with more than galaxies, the obtained from the dark matter halo mass is a factor of larger than the measured directly from the galaxies. Half of this discrepancy is due to the small value for the line-of-sight linking length used to build the group catalogue. The small biases the measured velocity dispersion down by per cent (Berlind et al., 2006). In the following analysis, we do not make extensive use of the dark matter halo mass. We do use the group velocity dispersion, but since we are only interested in making comparisons between different environments, the absolute values of are not relevant.
The group catalogue also contains the the projected distance, , from each galaxy to its host group centre (the number-weighted mean angular position). We use this distance, along with the velocity dispersion of the group to define the crossing time , where is the the group velocity dispersion, measured directly from the galaxy redshifts (see Berlind et al., 2006). Clearly, is only a sensible measure of environment for relatively large groups and clusters, which have a definite centre. While the number-weighted (or mass-weighted) centre of a group always is well-defined, the FoF grouping algorithm does not guarantee it is physically meaningful. This is especially true for non-relaxed groups. We will address this problem in our investigation of intra-group trends by limiting our sample to galaxies from relaxed groups (§5.1).
Finally, in addition to the halo properties, we measure the local surface density around each galaxy. We use the projected fifth nearest neighbour density (). Neighbours are selected from the volume-limited group catalogue in a redshift slice which has a width equal to the velocity dispersion of a galaxy’s host group. The minimum width is 300 , the line-of-sight linking length used in the group catalogue. For galaxies in large clusters, is a measure of their immediate vicinity, not the underlying large-scale dark matter density field (Muldrew et al., 2012).
In the sections below, we rely mostly on as a metric for environment. We will demonstrate that our results are essentially unchanged if group richness, , is substituted for . In §5.1 we explore trends in galaxy properties within massive, relaxed groups and use the crossing time, , as a measure of galaxy environment.
3 Whole galaxy properties with
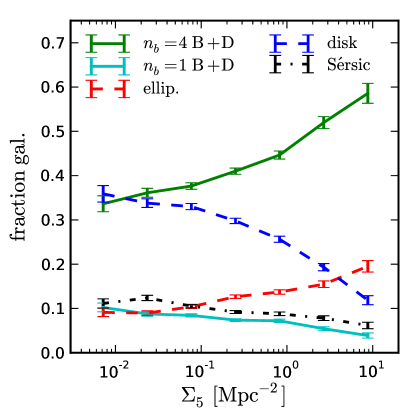
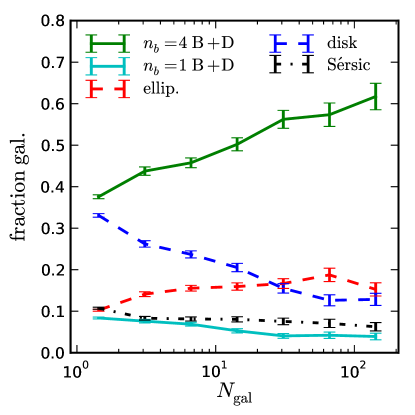
Before examining trends in bulge and disc properties with density, we confirm trends in whole galaxy properties with density. The low redshift morphology–density and colour–density relations have been measured numerous times using various data sets (e.g. Dressler, 1980; Goto et al., 2003; Balogh et al., 2004; De Propris et al., 2004; Kauffmann et al., 2004; Tanaka et al., 2004; Weinmann et al., 2006; Blanton et al., 2005; Hansen et al., 2009; Skibba et al., 2009; Bamford et al., 2009). First, we confirm that the morphological classifications described in §2.1.1 follow the expected morphology–density relation. Fig. 3 shows the distribution of the five morphological types as a function of . The trends with density are in agreement with the morphological trends from other studies (e.g. Dressler, 1980; Goto et al., 2003; Bamford et al., 2009). Our results are in close agreement with those from Goto et al. (2003) who find that early and intermediate disc galaxies (Sa and S0) dominate in almost all environments, while late-type discs drop off quickly at high densities. In our sample, classical bulge galaxies dominate at all but the lowest densities. The fraction of classical bulge host galaxies rises quickly above Mpc-2. Figure 3 is missing roughly galaxies which have axis ratios below . These galaxies are excluded from the bulgedisc catalogue in L12 because our exponential disc model is unsuitable for edge-on discs. Including these galaxies slightly decreases the fraction of elliptical galaxies, but the changes are small and the overall trends remain the same.
Note that although both Goto et al. (2003) and this work use to measure local environment, the numerical values cannot be directly compared since depends on the lower flux limit of the galaxy catalogue used and the width of the redshift interval used. Goto et al. (2003) measure the distance to the fifth nearest neighbour within a redshift slice of , while the redshift slice we use depends on the galaxy’s host group velocity dispersion and is typically smaller.
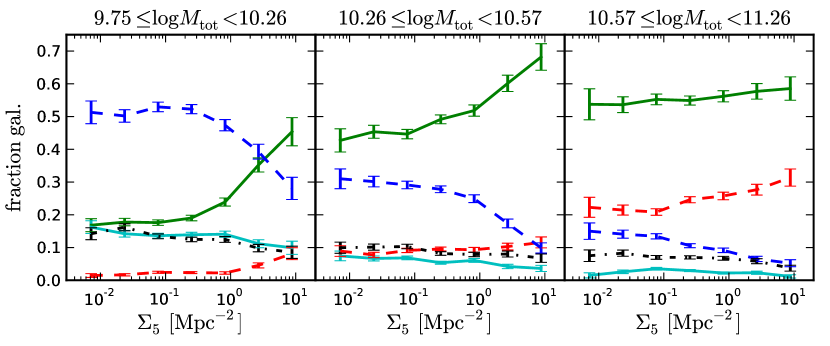
Fig. 4 shows the morphology trends for galaxies divided into three stellar mass bins. The stellar mass is computed using the most likely model for each galaxy (although the difference in total stellar mass between two reasonable model fits is always small). The trends with environment are the same for all three mass bins, but the fraction of early/late type galaxies is a strong function of mass in all environments, in agreement with previous results (e.g. Kauffmann et al., 2004; Blanton & Moustakas, 2009; Bamford et al., 2009). Classical bulges dominate over all other types of galaxies in the two highest mass bins.
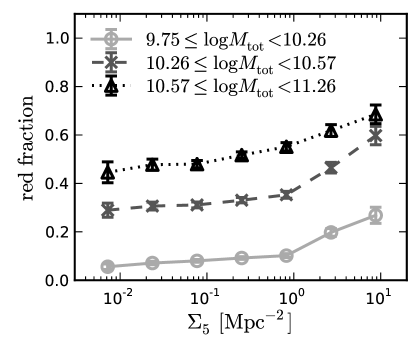
Since colour and morphology are generally correlated, the morphology–density relation implies a relation between local density and galaxy colour such that red galaxies dominate in high density regions while blue galaxies are dominant in the field (Gómez et al., 2003; Hansen et al., 2009; Balogh et al., 2004; Baldry et al., 2006; Skibba et al., 2009). There is evidence that the correlation between colour and density is more fundamental than the correlation between morphology and density (Kauffmann et al., 2004; Christlein & Zabludoff, 2005; Skibba et al., 2009). We show the fraction of red () galaxies as a function of environment and mass in Fig. 5. In agreement with previous work, we find the fraction of red galaxies is an increasing function of galaxy mass and environment. For all masses, the fraction of red galaxies increases sharply near Mpc-2, in agreement with results from Gómez et al. (2003), who find a break in the star formation rate–density relation at approximately the same local density. Figs. 3 and 5 show that both the colour–density and morphology–density relations hold for galaxies of constant stellar mass (Bamford et al., 2009; Skibba et al., 2009). Additionally, comparing the two figures demonstrates that the red fraction of galaxies increases sharply at the same local density as the classical bulge host and elliptical galaxy fractions. We note ellipticals are not the majority of red galaxies, but only contribute per cent by number; the remainder of red galaxies are classical bulge hosts, with a small contribution ( per cent) from unclassifiable galaxies.
In the following section, we explore the colour–density and morphology–density relations for classical bulge host galaxies. The colours of these galaxies follow the same trends as the colours of the galaxy population as a whole. Using bulgedisc decompositions, we can study the colour–density relations for bulges and discs separately, and determine whether changes in galaxy morphology (e.g. ratio) or changes in the component colours drive the increase in the fraction of galaxies with red integrated colour as a function of .
4 Bulge and disc properties with
Many studies show that a galaxy’s properties are largely determined by a its stellar mass (e.g. Brinchmann & Ellis, 2000; Kauffmann et al., 2004) and dark matter host halo mass (e.g. Blanton et al., 2006; Weinmann et al., 2006). Since the most massive haloes are strongly clustered, galaxy mass and environment are strongly correlated. However, there are correlations with environment at fixed stellar mass (e.g. Balogh et al., 2004; Bamford et al., 2009; Peng et al., 2011; Grützbauch et al., 2011; Cooper et al., 2010; Cibinel et al., 2012), and these are the trends we explore. Below, we show trends with environment at fixed bulge mass; however, our results are essentially unchanged if we choose to hold total galaxy stellar mass fixed. In this section, we focus on our sample of galaxies which have both a classical bulge and a disc. When calculating medians and Spearman rank correlation coefficients, we weight each galaxy by its probability of having a classical bulge and a disc, as explained in §2.1.1.
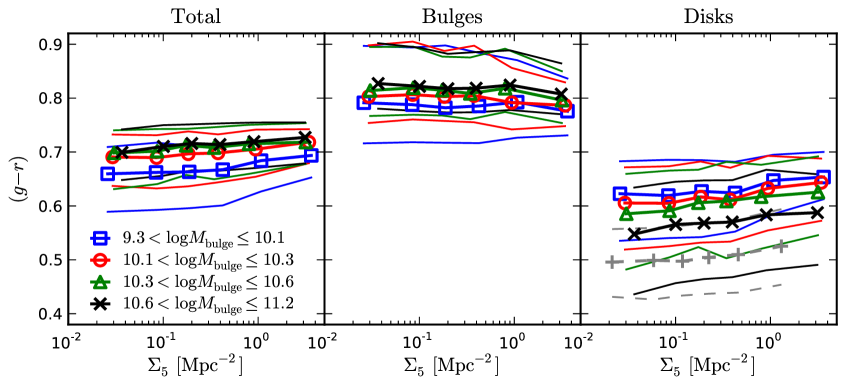
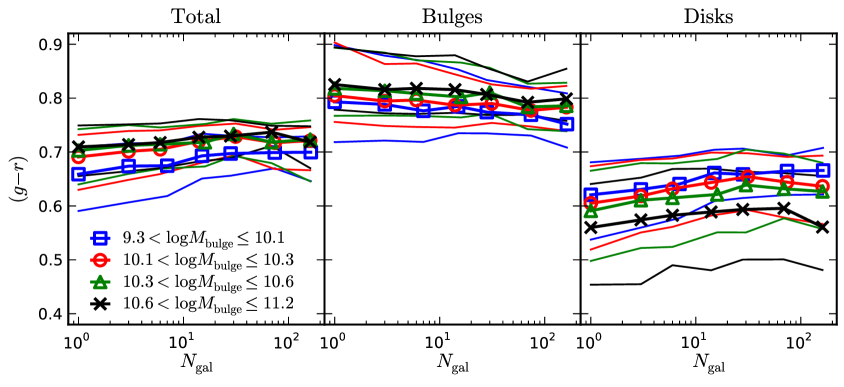
The left panel in Fig. 6 shows the colours of galaxies with classical bulges and discs as a function of . We divide the galaxies into quartiles based on bulge mass. We remove galaxies with the most and least massive per cent of bulges in order to eliminate galaxies with large errors in modelled colours and masses. The mass bin divisions are at . These mass bins are then divided into six bins of equal galaxy number at different . Thus, each point in Fig. 6 represents of the sample ( galaxies). These points are the weighted median colour in each bin. We define the weighted median as the value for which the sum of weights for values smaller than the median is equal to the sum of weights for values larger than the median. The thin lines in Fig. 6 denote the similarly-defined weighted inter-quartile ranges. Although there is significant scatter in the colour, the trends with environment are statistically significant333By statistically significant, we mean that the probability that the abscissa and ordinate are uncorrelated is less than per cent, corresponding to a result for Gaussian distributions.. The trend in total galaxy colour is simply the colour–density relation for classical bulgedisc galaxies. The weighted Spearman rank coefficients are given in Table 2. We also calculate the best-fitting linear slopes of the relation (see Table 2). In order to reduce the errors on the slope, we remove points offset from the fitted relation by more than standard deviations and then re-fit the relation using the slightly smaller sample. Despite being statistically significant, the change in median integrated colour is small, per dex in . The change is largest for galaxies which host low mass bulges. This is in agreement with the conclusions of Bamford et al. (2009), who show that the colour–density relation is most significant for lower mass galaxies.
The middle and right panels of Fig. 6 show the colour density relation for the bulge and disc components of these galaxies separately. It is immediately evident that the change in disc colour with must contribute significantly to the change in total galaxy colour. In fact, we demonstrate below that the change in disc colour is the only contribution to the change in total colour. In the following subsections, we will discuss the changes in bulge properties (§4.1), and the changes in disc properties (§4.2) as functions of .
| p-value, | slope | ||
| Total vs. | |||
| 9.3–10.1 | 0.17 | 0.0 | |
| 10.1–10.3 | 0.14 | 0.0 | |
| 10.3–10.6 | 0.13 | 0.0 | |
| 10.6–11.2 | 0.11 | ||
| Bulge vs. | |||
| 9.3–10.1 | |||
| 10.1–10.3 | |||
| 10.3–10.6 | |||
| 10.6–11.2 | |||
| Disc vs. | |||
| 9.3–10.1 | 0.18 | ||
| 10.1–10.3 | 0.13 | ||
| 10.3–10.6 | 0.12 | ||
| 10.6–11.2 | 0.09 | ||
| Bulge-less | 0.11 | ||
4.1 Bulges
The classical bulges in Fig. 6 were selected to have large Å breaks, similar to ellipticals. Elliptical galaxy colours depend on galaxy mass (e.g. de Vaucouleurs, 1961; Brinchmann & Ellis, 2000), but only weakly, if at all, on environment (e.g. Dressler et al., 1987; Bernardi et al., 2003b; Balogh et al., 2004; Trager et al., 2008; Hansen et al., 2009). The central panel in Fig. 6 shows that the median bulge colours lie on the red sequence (), and that there is a small increase () in median colour from the lowest mass bulges to the highest mass bulges. The weakness of this trend may be due in part to large scatter in the model bulge colours compared to the scatter in model elliptical colours (see fig. 32 in L12).
In addition to trends in colour with bulge mass, there is a weak but statistically significant anti-correlation between environment and bulge colour; bulges in low density regions are redder than those in higher density regions. The Spearman rank correlation coefficients for this trend are listed in Table 2. This result is in contrast to the results of Hudson et al. (2010) who find no variation in median bulge colour with increasing local density. This trend is strongest for the second lowest bulge mass bin (red circles). Since pseudo-bulges are typically blue and are not as strongly clustered as classical bulge galaxies (see Figs. 3 and 4), contamination from pseudo-bulges will tend to flatten the trend in bulge colour for the lowest mass bulges, possibly explaining the weaker trend for the lowest mass bulges.
Although the bulge colours decrease as a function of environment, there is no significant correlation between and SDSS fibre colours, and the correlation between and is in the opposite sense (see Fig. 8). However, if we replace the L12 bulgedisc decompositions with those from Simard et al. (2011), the same trend in bulge colour with density is recovered.
We propose that the decrease in bulge colour with environment is an artefact of 2-dimensional bulgedisc decompositions. Specifically, the colours of small bulges in blue discs are biased redwards by the bulgedisc decomposition. The disc model used in L12 (and Simard et al. (2011)) is an exponential profile, which is centrally peaked. Therefore, the disc can contribute significantly to the central flux of the galaxy. Moreover, since the disc is usually bluer than the bulge (especially in low density regions), the bulgedisc decomposition will attribute blue light from the central region to the disc, thus making the bulge appear redder. This effect will be largest for the smallest bulges in the bluest discs. Since the bulge-to-total flux ratio and disc colour are both increasing functions of environment, the bias in bulge colour will be largest for small bulges in low density environments.
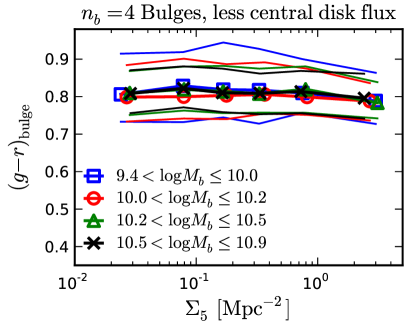
We test this explanation by refitting classical bulge galaxies with models that suppress the disc flux in the central region. In the new models, the disc flux goes rapidly to zero within one bulge scale radius, . Keeping all the other model parameters fixed, we linearly scale the bulge and disc flux of this new model to fit each galaxy. By design, the new fits have larger bulge-to-total flux ratios, and the differences are largest for galaxies with small bulges. The resulting trends in bulge colour with environment for these disc-suppressed models are shown in Fig. 7. There is only a statistically significant trend with mass for galaxies with (note that because the bulge and disc masses have been recomputed, the mass quartiles in Fig. 7 are different from those in Fig. 6). The choice of parametrisation for the central region of the disc plays an important role in the bulge colours.
In general, it is unknown whether the stellar disc continues unchanged through the bulge or if the disc only exists outside the central bulge. In the Sombrero galaxy, photometry and spectroscopy show an inner cutoff for the stellar disc, suggesting the disc-suppressed models may be a better choice for early-type disc galaxies (Emsellem et al., 1996). In this work, we will continue to use the centrally-peaked model for the disc, knowing that the colours of small bulges will be biased redwards.
This bias will also occur in the opposite case, when a small disc surrounds a large, red bulge. However, we do not expect the bias in disc colours of galaxies with large bulges to be as severe. Since the majority of the bulge flux comes from regions above and below the disc, there is no physical basis for the bias in disc colour, as in the case for small bulges.
4.1.1 Spectroscopic Properties
Recent work has shown statistically significant positive correlations between stellar age and local density (e.g. Thomas et al., 2005; Bernardi et al., 2006; Clemens et al., 2006; Smith et al., 2006; Cooper et al., 2010) and between metallicity and local density (Cooper et al., 2010) for early type, or red sequence, galaxies. Our sample of classical bulgedisc galaxies contains both early type, passively evolving, galaxies and galaxies with ongoing star formation in their discs. However, we expect all classical bulges and ellipticals to follow the same relations with stellar mass and environment.
In order to examine the stellar population properties of classical bulges more closely, we use the SDSS fibre spectra and the line indices and metallicities reported in the MPA/JHU SDSS spectroscopic catalogue. At low redshift, the fibre spectra are dominated by bulge stellar light, but the mixture of bulge and disc light in the fibre is a function of redshift. These aperture effects may influence correlations between measured line indices and . For classical bulgedisc galaxies in our sample, the median in the inner 3 arcsec is , and eighty per cent of the galaxies have within arcsec larger than . For galaxies at , the median ( arcsec) is only slightly smaller at . Therefore, the 3 arcsec SDSS spectroscopic fibres are dominated by bulge stellar light, even at the highest redshift () in our sample.
Since our sample is in the regime where angular size scales linearly with distance, the spectroscopic measurements will include more disc flux at higher redshift. This effect is partially countered by a slight bias toward larger bulges at higher redshifts; in this sample, the average physical bulge size increases by 8 per cent from to , due to the fact that small bulges at high redshift are more difficult to accurately fit. However, there is no statistically significant trend in with redshift. Therefore, even though the the spectroscopic properties do change with redshift, the correlations between spectroscopic properties and will be unaffected, since and are uncorrelated.
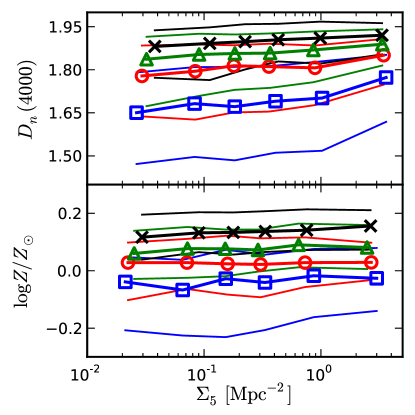
The top panel of Fig. 8 shows the Å break (D) (Balogh et al., 1999) as a function of for four different bulge masses. In this figure, we include both classical bulges and ellipticals, since we expect the stellar populations of classical bulges and ellipticals to be the same at a given mass (MacArthur et al., 2010). Indeed, excluding ellipticals from Fig. 8 does not noticeably alter the results. The four mass bins used are the same as in Fig. 6. The increase in D as a function of density is statistically significant for all bulge masses, but the trend is strongest for the lowest mass bulges. These results imply that bulges in high density environments have had less recent star formation than those in lower density environments. The same results are obtained if we plot the line index H as a proxy for stellar age (the equivalent width of H is anti-correlated with environment) (Kauffmann et al., 2003). The increase in stellar age as a function of local density at fixed bulge mass is in agreement with previous results (Trager et al., 2000; Kauffmann et al., 2004; Thomas et al., 2005; Clemens et al., 2006; Bernardi et al., 2006; Smith et al., 2006; Cooper et al., 2010, but see Thomas et al., 2007). Cooper et al. (2010) note that the trend in age of red sequence galaxies with density is evidence for galaxy assembly bias (Croton et al., 2007); namely, older galaxies are more strongly clustered than younger ones at fixed stellar mass.
The lower panel of Fig. 8 shows stellar metallicity as a function of . The values for are taken from Gallazzi et al. (2005, 2006)444http://www.mpa-garching.mpg.de/SDSS/DR4/ Data/stellarmet.html. The metallicities are only computed for galaxies from SDSS data release 4, which includes approximately half of the sample used in this paper. Gallazzi et al. (2005) compute the stellar ages and metallicities by fitting model spectra from Bruzual & Charlot (2003) to a combination of iron and magnesium line indices, the Å break, and three Balmer lines. The trend in stellar metallicity at fixed bulge mass is statistically significant for all but the second lowest mass bin (red circles). The trends are strongest for the highest mass bin, where the metallicity changes by dex per decade in . Despite being statistically significant, the change in metallicity is quite small.
The increasing trend in stellar ages and metallicities is orthogonal to the age-metallicity degeneracy (Worthey, 1994; Gallazzi et al., 2005), which makes the results more robust. The small increase in metallicity is in agreement with results from Cooper et al. (2010) (but see Thomas et al., 2005; Smith et al., 2006), as well as studies of the gas-phase metallicity which show an increase in metallicity in star-forming galaxies as a function of local density (Cooper et al., 2008). These results demonstrate that bulges in high density regions formed earlier and with higher star formation rates (see Cooper et al., 2010). The increases in stellar age and metallicity with increasing density suggest that classical bulges should be redder in higher density regions. This disagrees with the results from §4.1, where we find that bulge colours may even be slightly bluer in high density regions. This disagreement is likely due to biases in our model bulge colours.
4.2 Discs
In the previous section, we show that the change in bulge colours with local density is small, and any statistically significant change is probably due to our choice of disc profile for galaxies with small bulges. On the other hand, the trends in disc colour with density are statistically significant. These are shown in the right panel of Fig. 6. The Spearman rank coefficients and slopes of the linear relation between and are given in Table 2. Although the correlations are statistically significant, the changes in disc colour are small; the colour only increases by mag per dex in . However, this change is times larger than the change in colour measured for bulges. For all four bulge mass bins, the slope of the relation between and disc colour is comparable or larger than the slope in total galaxy colour, which suggests the change in integrated galaxy colour can be fully explained by the change in disc colour. We will return to this conclusion in §4.2.1.
As with the bulge colours, there is significant scatter in disc colour at fixed bulge mass; the inter-quartile range of colours is typically mag. This scatter is due to the scatter in disc mass at fixed bulge mass and fixed . Disc mass and disc colour are strongly correlated (e.g. de Jong, 1994), so a range of disc masses will yield a range of disc colours. We show below that the correlation with disc mass and environment does not contribute to the trend in disc colour with environment. In Fig. 6, we plot the relation between and disc colour for bulge-less discs, including pseudo-bulges and unclassifiable galaxies (grey crosses and dashed lines). This relation is offset to lower values of since bulge-less discs are typically found in lower density environments. None the less, discs in galaxies without prominent bulges follow the same colour–density relation as discs with large classical bulges.
Like the change in total galaxy colour, the change in disc colour is largest for discs around the smallest bulges. This does not extend to bulge-less disc galaxies, for which the relation between and is not as steep as the relation for galaxies with low, but non-zero, mass bulges (see Fig. 6 and Table 2). However, since each bulge mass bin includes a large range of disc masses, this does not contradict the observation that the colour–density relation is strongest for low- (total) mass galaxies (Bamford et al., 2009; Tasca et al., 2009).
The trend of increasing disc colour with environment is a signature of star formation being halted in denser environments. Our results are in agreement with earlier studies of discs becoming redder in cluster environments (e.g. Hashimoto et al., 1998; McIntosh et al., 2004; Hudson et al., 2010) and the rise of red disc galaxies (anaemic spirals) with increasing local density (e.g. Dressler, 1980; Goto et al., 2003; Gómez et al., 2003; Bamford et al., 2009). Two models for removing gas from galaxies in dense environments include ram-pressure stripping by the intra-group medium (Gunn & Gott, 1972), and the removal of the hot halo gas supply around disc galaxies (strangulation) (Larson et al., 1980). These two mechanisms have different timescales for shutting off star formation; ram-pressure stripping almost immediately ends star formation, while galaxies losing their halo gas reservoirs undergo an exponential decay in star formation rate (Balogh et al., 2000; van den Bosch et al., 2008). From the disc fading shown here, these two processes are indistinguishable. We return to the differences between ram-pressure stripping and strangulation in §5 when discussing the correlation between disc colour and for rich and poor groups, separately.
Fig. 6 shows that the most massive bulges in our sample also have the bluest median disc colours (black crosses in Fig. 6). This seemingly contradicts observations that find redder, and presumably more massive, bulges have redder discs (de Jong, 1994; Peletier & Balcells, 1996; Wyse et al., 1997; Cameron et al., 2009). However, Fig. 6 and 7, show little change in bulge colour as a function of bulge mass. Furthermore, while we separate the sample based on bulge mass, the disc mass does not monotonically increase with bulge mass. The trend of decreasing disc colour with increasing bulge mass exists even if the inclination correction is removed (see Fig. 12). This trend may be partially explained by the same modelling artefact which affects bulge colours (§4.1). In this case, the subtraction of a large, red bulge from an image will leave behind an abnormally blue disc. This modelling effect will be strongest for galaxies with large red bulges, and relatively small discs.
4.2.1 Disc mass and size
In §4.2, we show that disc colour and environment are significantly correlated, thus disc fading is a significant contribution to the colour–density relation. However, morphological transformation could also play a role. If discs are being stripped at the same time they are fading, we expect that the mass contribution from the disc to be a decreasing function of . Since bulges are typically redder than discs, decreases in disc mass will lead to increases in total galaxy colour.
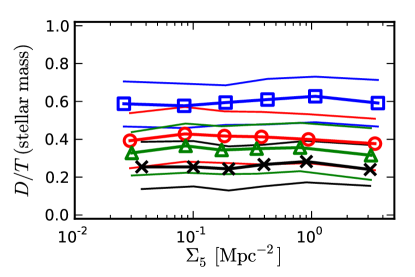
In Fig. 9 we show the disc-to-total stellar mass ratio () for galaxies in four bulge mass bins. The mass bins are the same as in Fig. 6. We find no statistically significant trend in with . For the highest bulge mass bin (black s), the median is above 10 per cent, the cutoff below which we classify galaxies as ellipticals. Therefore, it is unlikely that the constant at high bulge mass is due to the minimum detectable . Although we have separated the galaxies by bulge mass, changes in median bulge mass within each bin could affect the relation between and . We confirm there is no statistically significant change in median bulge mass in each of the four mass bins as a function of . Therefore, at fixed bulge mass, the disc mass is independent of local density, and the changes in total galaxy colour as a function of are due solely to the changes in disc colour.
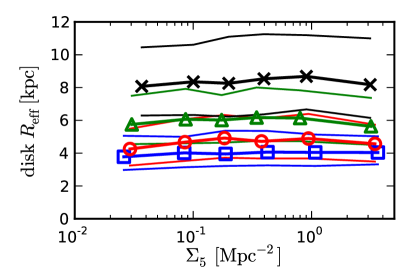
Fig. 10 strengthens the argument against morphological transformations by demonstrating there are no statistically significant correlations between disc half-light radius (measured in the band) and at fixed bulge mass. Neither the disc size nor mass changes significantly with increased density, as would be expected if galaxy harassment or mergers play a major role in galaxy evolution in high density environments. These results are in agreement with results from McIntosh et al. (2004). They find large differences in star formation rates between cluster galaxies and field galaxies, as evidenced by differences in disc colours and disc structures (e.g. spiral arms) between cluster and field galaxies, but they do not find changes in the bulge-total-ratio distributions for field and cluster galaxies at fixed galaxy colour.
It is important to keep in mind that Figs. 9 and 10 are based entirely on galaxies with classical bulges and discs. If we include ellipticals () in the sample, the median is a very weakly decreasing function of , but only for the highest mass bulges. This is expected since ellipticals are more strongly clustered than typical bulgedisc galaxies (see Fig. 4). Similarly, if we include bulge-less galaxies in Fig. 9 (and separate galaxies into bins of constant total stellar mass instead of constant bulge mass), the median is a decreasing function of . By focusing on galaxies with a bulge and a disc, we are investigating whether there are morphological transformations within this population that help explain the transition from disc-dominated galaxies in the field to bulge-dominated galaxies in large groups and clusters. The lack of evolution in with increasing indicates that either higher density environments do not lead to disc destruction or the transition from a disc-dominated galaxy to a bulge-dominated galaxy occurs on very short timescales, and we do not observe any galaxies in this transitional phase.
4.2.2 Inclination Angle
The previous section demonstrates that the changes in total galaxy colour for bulgedisc galaxies are due to changes in disc colour. However, these results could be biased by the inclusion of ellipticals in high density regions. In this section, we address this concern by dividing the sample into three bins of disc inclination angle. If we mistakenly model the elliptical outskirts and halo as a disc, we would expect no colour change with environment for face-on discs, where contamination from ellipticals is most significant. Conversely, if contamination from ellipticals is zero and our sample does not suffer from any biases based on disc inclination, we expect the same trends in bulge and disc properties with environment, irrespective of disc inclination.
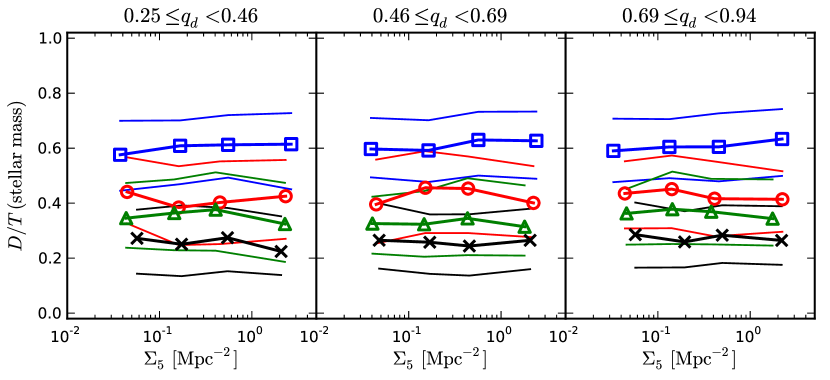
Figures 11 and 12 show the disc colour and disc-to-total stellar mass ratio as a function of for three bins in disc inclination angle. The galaxies plotted are the same as in previous figures (classical bulgedisc galaxies). The bins in inclination are chosen such that each panel shows the same number of galaxies. Assuming a flat disc, the inclination angle limits for each panel are (, , , ), where is face-on. From Fig. 20, it is clear that galaxies in the leftmost panels of Figs. 11 and 12, with , have a very low probability of being ellipticals, while the galaxies in the rightmost panel are the most likely to include ellipticals. The galaxies are divided into four bulge mass bins, using the same divisions as in Fig. 6. Note that the bulge mass bins do not all have the same number of galaxies, as they did above; at low (highly inclined galaxies), there are more massive bulges, while at high (face-on galaxies), there are more low mass bulges. However, the number of galaxies in each bin differs by at most , and each bin has galaxies on average. Therefore, any bias introduced by changes in average bulge mass with disc inclination will be small.
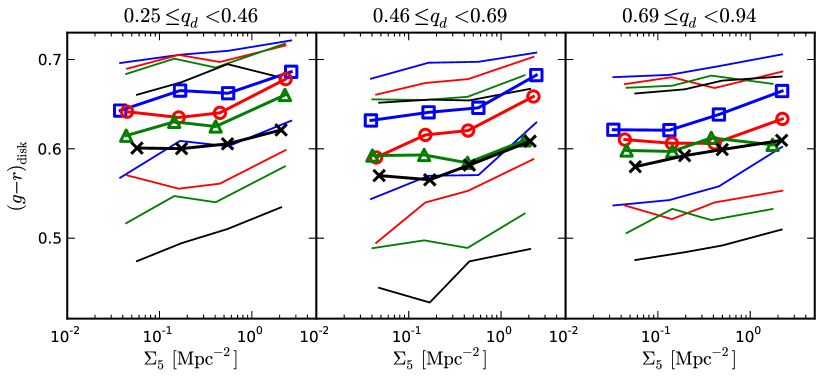
Figure 11 shows no statistically significant trend in as a function of density. Furthermore, is independent of disc inclination angle. This supports our previous conclusions. Namely, at constant bulge mass, disc mass is not a function of environment.
The dependence of disc colour on environment and disc inclination is less straightforward. Although the rank correlation coefficients are always positive, the trends are only statistically significant for the low mass bulges or highly inclined discs (see Table 3). This hints at contamination from elliptical galaxies in the highest and highest bulge mass bins. For the most inclined galaxies, where contamination from ellipticals is minimal, the slopes in disc colour reported in Table 3 agree with those reported for disc colours in Table 2. Additionally, for the lowest mass bulges (blue squares), the slope in with is essentially independent of . Although the trends for the higher mass bulges are not always statistically significant, the slopes measured are also in reasonable agreement with those for the whole sample. Together with the lack of correlation between and at fixed , the trends in disc colour with at fixed reinforce our conclusion that the changes in bulgedisc galaxy colour, while small, are entirely due to changes in disc colour with .
| p-value, | slope | ||
|---|---|---|---|
| Disc vs. , | |||
| 9.3–10.1 | 0.18 | 0.0 | |
| 10.1–10.3 | 0.12 | ||
| 10.3–10.6 | 0.14 | ||
| 10.6–11.2 | 0.12 | ||
| Disc vs. , | |||
| 9.3–10.1 | 0.23 | ||
| 10.1–10.3 | 0.20 | ||
| 10.3–10.6 | 0.09 | ||
| 10.6–11.2 | 0.07 | ||
| Disc vs. , | |||
| 9.3–10.1 | 0.16 | ||
| 10.1–10.3 | 0.06 | ||
| 10.3–10.6 | 0.06 | ||
| 10.6–11.2 | 0.09 | ||
The colours plotted in Fig. 12 are not corrected for disc inclination, which accounts for the differences in the median disc colour across the three panels. Without the intrinsic inclination correction, the redder colours for inclined discs are expected. However, using the uncorrected colours will allow us to verify the disc inclination correction used in the previous sections. Fig. 12 shows that the change in median colour as a function of is largest for the the two middle mass bins (red circles and green triangles). In this mass range, the median disc colour decreases by mag from the highest inclination to the lowest inclination galaxies. For the high and low mass bins, the median disc colours only decrease mag. This demonstrates that the intrinsic inclination correction should be a function of bulge mass; galaxies with very low mass bulges and very high mass bulges seem to suffer less intrinsic extinction in their discs. Following Maller et al. (2009), our extinction correction addresses the low bulge mass effect. The correction includes a term that depends on band magnitude such that higher mass galaxies have a larger extinction correction. Thus, our extinction correction is typically too large for galaxies with massive bulges. Finally, the lack of extinction due to “discs” around high mass bulges may be due to contamination from ellipticals, where we expect little extinction.
Reddening of discs is both a function of disc inclination and a function of the amount of dust in the disc. Above, we argue that discs in galaxies with different bulge masses suffer from different amounts of extinction. We can also use the differences in disc colour across the three panels in Fig. 12 to explore changes in the amount of extinction as a function of local density. In principle, the change in the correlation between the uncorrected disc colour and as a function of could be used to measure the change in extinction as a function of local density. However, this requires a detailed understanding of how extinction depends on both the amount of dust and the disc inclination. Reddening is a complicated, possibly non-monotonic, function of these variables (see Tuffs et al., 2004, for one parametrisation). Therefore, we limit ourselves to a simple test; if the extinction in high density environments is negligible, then the disc colour in the highest density environments should be independent of disc inclination. Fig. 12 shows this is not true, with the possible exception of the highest bulge mass galaxies (black crosses). As explained above, this mass bin is likely to contain misrepresented ellipticals, which would counter the change in disc colour with disc inclination. Therefore, any contamination from ellipticals strengthens the argument that discs in high density regions are not free from extinction.
5 Other environment measures
As discussed in §2.3, we compute environment metrics in addition to the local density measure, . Below, we use the group richness, , as our environment measure. We define richness as the number of galaxies in a group above the group catalogue magnitude limit, . We do not correct for contamination, nor do we attempt to include lower luminosity galaxies in . For rich groups, is closely related to a galaxy’s host dark matter halo mass, and is notably different from , which measures the local (intra-group) density around a galaxy. Since many of the effects of environment depend, at least indirectly, on the group potential, correlations between bulge and disc properties and may help determine which environmental effects are most relevant. In Section 5.2, we use crossing time, as a proxy for environment within relaxed, relatively rich groups. Unlike , is different for each galaxy in a group. It measures how long a galaxy has been affected by its host group.
In Fig. 13 we plot the trends in total, bulge, and disc colour as a function of group richness, , instead of . Unsurprisingly, the trends in galaxy colours with host group richness are similar to the trends with ; total galaxy colour and disc colour are increasing functions of richness, while the bulge colour decreases slightly with increasing . The latter effect is explained by the modelling bias we discuss in §4.1. Additionally, we find no significant correlation between and , in agreement with the lack of correlation in Fig. 9. However, the plots in Fig. 13 do indicate that galaxy colours (and disc colours) do not redden above . This is in agreement with results from previous studies (e.g. Balogh et al., 2004; van den Bosch et al., 2008). Balogh et al. (2004) show that the fraction of red galaxies is independent of cluster velocity dispersion for , which corresponds to . Thus, the majority of the colour evolution of bulgedisc galaxies occurs in smaller groups.
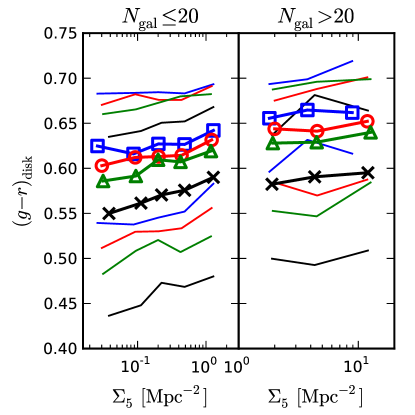
We can test this hypothesis by examining the colour–density relation in relatively rich groups and poor groups separately. This test is shown in Fig. 14; the left panel shows the relation between disc colour and for groups with at most members, while the right panel shows the same for larger groups. There is no statistically significant correlation between disc colour and in the large groups, but the trends are statistically significant for galaxies in the field and in smaller groups. Therefore, the transformation of disc colour does not require rich clusters, and star formation in discs is effectively halted by group density environments. This is in agreement with other studies of colour and environment (e.g. Zabludoff & Mulchaey, 1998; Gómez et al., 2003; Cooper et al., 2006; Blanton & Berlind, 2007). However, Fig. 14 does show a significant offset () in disc colour between galaxies in poor groups just below and galaxies in rich groups at . This density threshold is close to the density of the inflection point in the red fraction seen in Fig. 5.
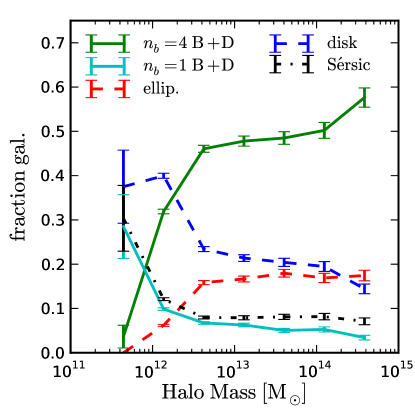
In addition to examining the changes in colour as a function of environment, we show the changes in morphological types as a function of and dark matter halo mass in Figs. 15 and 16. In general, the trends in morphological type fraction are in agreement with those in Fig. 3. For the largest groups, there is little change in the elliptical galaxy fraction as a function of halo mass, in agreement with Hoyle et al. (2012), who find that the fraction of early type galaxies is and independent of halo mass for masses above . Hoyle et al. (2012) use morphologies from the Galaxy Zoo project (Lintott et al., 2011), which are qualitative classifications, and cannot distinguish between face-on S0s and elliptical galaxies. As such, their definition of early type galaxies only corresponds approximately to our definition of ellipticals. There are certainly some early type galaxies in our classical bulgedisc category. In Fig. 15, the downturn in the elliptical fraction in rich groups is partially due to the inclusion of large, but not necessarily bound structures, in the FoF group catalogue. We work to eliminate these non-virialised groupings the next section.
5.1 Round groups
Although we show that the change in disc colour occurs in relatively small groups, the original morphology–density relation was constructed using cluster-centric distance as a proxy for environment (Oemler, 1974). Indeed, many studies compare galaxies on the outskirts of massive clusters to those at the centres (e.g. Dressler, 1980; Postman & Geller, 1984; Whitmore & Gilmore, 1991; Gómez et al., 2003; Treu et al., 2003; Smith et al., 2006; Weinmann et al., 2006; Trager et al., 2008; Hudson et al., 2010). Although our sample does not extend to significant redshifts, there are several massive groups included in the group catalogue which we use to study trends in bulge and disc properties with local density within groups. These trends may help reduce the scatter in the relations with and shown in Figs. 6 and 13.
In order to study trends within clusters, we first limit our sample to groups with at least members. However, as discussed in §2.3, the FoF grouping algorithm does not necessarily identify relaxed or even bound systems; filaments and merging galaxy groups are often identified by the FoF algorithm as galaxy groups. Furthermore, many large galaxy groups do not have well-defined centres (e.g. Zabludoff & Mulchaey, 1998; Skibba et al., 2011), making trends in galaxy properties with distance from the group centre almost meaningless. In order to use environment measures such as the crossing time or distance from the group centre, we select a sample of groups that have a symmetric projected distribution of galaxies. This eliminates groups in the process of forming or merging, for which the distance from the cluster centre has little physical meaning.
If a group is relaxed and approximately spherical, we expect that galaxies should have a rotationally symmetric distribution on the sky. We generalise the requirement of rotational symmetry by allowing galaxies to be evenly distributed along elliptical contours, instead of just circular ones. In practise, we accomplish this by compressing the coordinates along the minor axis of the group, making an elliptical group appear spherical. Allowing groups to be elliptical in projection does not accurately represent oblate, prolate, or triaxial groups in projection (expect from special viewing angles), but it does account for some of the asymmetries real groups.
We test whether a group is symmetric by comparing the distribution of galaxies observed for a given group, to a distribution drawn from a rotationally symmetric radial profile. The functional form of the radial profile, however, is uncertain (e.g. Adami et al., 2001). Instead of relying on an analytic function for the profile, we create separate comparison radial profiles for each galaxy group by fitting a smooth curve to the binned radial distribution of galaxies in each group. To limit the Poisson noise, this fit is smoothed using a Gaussian filter with a width () equal to half the root-mean-squared (rms) radius, , of the group.
We then compare the actual distribution of galaxies to the smoothed radial distribution using a test: , where is the number of galaxies observed in a region () and is the expected number of galaxies from the rotationally symmetric distribution. The denominator is the Poisson uncertainty in the number of galaxies. The size of the () region used in the sum will affect the value; if the region is too large, the two distributions will trivially agree. We use a square region which is on a side. This is large enough to ensure most regions in the sum have at least one galaxy, but small enough to distinguish between rotationally symmetric and asymmetric groups. If the galaxy distribution is rotationally symmetric, it will be statistically indistinguishable from the smoothed radial distribution. On the other hand, if the galaxy distribution is markedly non-symmetric (e.g. bimodal), the value will be large. We consider a group to be round if the value from this test has a probability between and . This selects of the groups with at least 20 members in the group catalogue. Below, we designate these groups round groups. Of these groups, are represented in the bulgedisc catalogue; the remainder are at redshifts greater than . There are classical bulgedisc galaxies in round groups, compared to classical bulgedisc galaxies in groups with .
5.2 Intra-group trends
In order to examine the effect of intra-group environment on bulges and discs, we define the crossing time () for each galaxy as the distance from the galaxy to the group centre divided by the line-of-sight velocity dispersion of the group. For a single galaxy, is unphysical, since the galaxy is typically not moving radially with the group velocity dispersion. However, for a large sample of galaxies, is a measure of how long galaxies have been affected by the group environment. Crossing time is anti-correlated with local density , although there is significant scatter. We have not divided our sample into central galaxies and satellite galaxies as previous studies have done (e.g. van den Bosch et al., 2008; Skibba & Sheth, 2009; Skibba, 2009; Peng et al., 2011). However, the number of groups is much smaller than the number of galaxies in this sample, so the contribution from central galaxies is small.
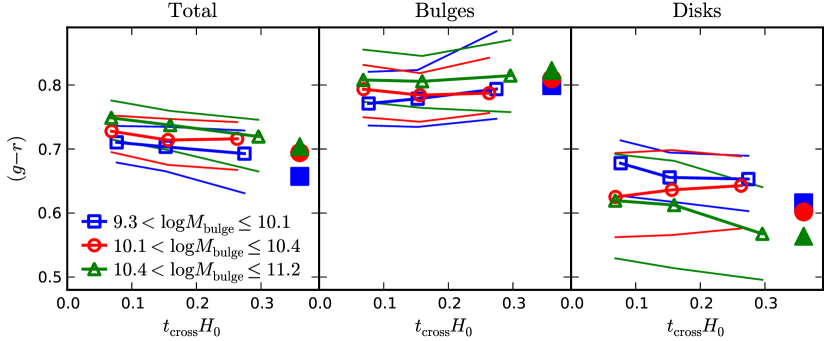
Fig. 17 shows the relation between galaxy colours and for classical bulgedisc galaxies in round groups with . Since these constraints greatly reduce the sample size ( classical bulgedisc galaxies), we only divide the galaxies into three mass bins and only show three median points in . The largest crossing times in our sample are less than 40 per cent of a Hubble time, in agreement with those found at higher redshift (Grützbauch et al., 2011) and with the timescale for relaxation (Gunn & Gott, 1972; Ferguson & Sandage, 1990). Crossing times shorter than the Hubble time indicate that the galaxies are not falling into a group for the first time, and have probably orbited the group centre at least once.
The crossing time gives an indication of how long a galaxy has been affected by the group environment; galaxies with the shortest crossing times have presumably passed through the centre of the group most often and have experienced the highest average local density. In addition, a small implies a high mass density within the group (); galaxies in compact groups will have smaller crossing times. Therefore, any trends in galaxy properties with will be sensitive to how the environmental processes causing the trends depend on local density and time, although the exact dependencies are not straightforward. In addition, the median distance to the group centre in our sample of round groups is two thirds of the group virial radius. The galaxies in our sample are all much closer to their host group centre than virial radii, the distance at which Gómez et al. (2003) find a large change in the star formation rate. Samples that extend to much larger radii are probably needed in order to see large trends in galaxy colours with group-centric distance.
The left panel in Fig. 17 shows that the total galaxy colour is anti-correlated with ; galaxies with short group crossing times typically have redder colours. The correlation is only statistically significant for the highest mass bulges. If we do not limit the sample to galaxies from round groups, the statistically significance of all the trends decreases. The middle panel in Fig. 17 shows no statistically significant trend in bulge colour with crossing time. For the smaller bulges, there is a weak correlation with , but, as shown in §4.1, these trends are likely due to uncertainties in the disc model. The final panel in Fig. 17 shows the disc colours as a function of . In this case, none of the correlations are statistically significant (for the highest mass bulges, and disc colour are anti-correlated with significance). These weak trends in disc colour are in agreement with the lack of correlation between and for all groups with more than 20 members (see Fig. 14). There are significant colour differences between discs in large groups and discs in the field. Isolated classical bulgedisc galaxy colours are denoted by solid points in Fig. 17, and, at least for low mass bulges, discs in the field are significantly bluer than discs in groups. This agrees with our earlier conclusion that most disc colour evolution occurs in smaller groups (see also van den Bosch et al., 2008; Cooper et al., 2006).
The lack of correlation between disc colour and is in contrast with the results of Hudson et al. (2010), who find a statistically significant correlation between disc colour and a galaxy’s distance to the group centre. This is probably due to the selection of the samples; Hudson et al. (2010) do not divide their sample into galaxies with bulges and discs only. If we include bulge-less galaxies in our sample, there is a statistically significant correlation with disc colour and crossing time.
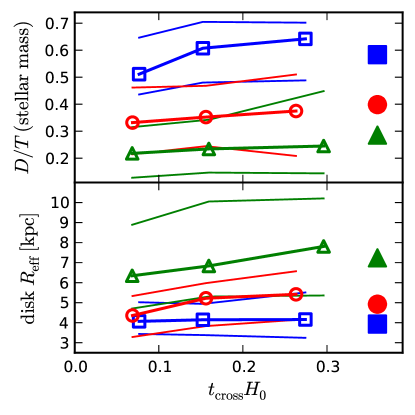
Fig. 18 shows the change in disc-to-total mass ratio and disc scale length as a function of . Unlike the case of the relations with , there are statistically significant correlations between disc mass and and between disc size and . The positive correlation between and is statistically significant for the highest and lowest mass bins, and significant at the level for the middle mass bin. For the highest mass bulges, the disc-to-total mass ratio increases by 6 per cent from to . There is no change in average bulge mass as a function of , so the change in is due entirely to changes in the disc mass. In addition, the lower panel of Fig. 18 shows a correlation between and the disc for the most massive bulges, which is significant at the level. Although these trends with are weak, they are also present if we substitute for (correlations become anti-correlations). These trends suggest that processes active in the highest density regions in groups either suppress disc formation or destroy discs around infalling galaxies. We can expand our sample to include ellipticals (), to determine if the trends in and continue until the disc is negligible. In this case, the correlation between and for the highest bulge mass bin becomes insignificant. Thus, at least for high mass bulges, the trend in with does not extend to disc-less ellipticals.
Together, Figs. 17 and 18 tentatively suggest that morphological changes play some role in the colour–density relation for galaxies in rich groups. This seems to conflict with the conclusions in §4.2, which show no significant trends in disc mass with density. Taken together, these results suggest that star formation quenching and morphological transformation are separate physical processes and that these transitions take place in different environments. This agrees with previous studies that find an increase in the number of passive, red discs as a function of time (Dressler et al., 1997; Moran et al., 2007; Bundy et al., 2010) and environment (Goto et al., 2003; McIntosh et al., 2004; Bundy et al., 2006; Bamford et al., 2009). The existence of these non-star forming disc galaxies demonstrates that star formation quenching occurs before morphological transformation. In addition, Skibba et al. (2009) note that there is a weak correlation between red galaxy morphology and density at small scales, in agreement with our findings. Namely, we demonstrate that morphological transformation may be taking place in rich groups and clusters, and that these transformations are not associated with star formation quenching since disc colours are not correlated with . Galaxy harassment, i.e. high-speed encounters between galaxies, is a plausible explanation for the decrease in disc mass we observe. The number of encounters a galaxy experiences will increase with galaxy number density, and galaxies with short crossing times are exposed to the highest average densities. Thus galaxy harassment would yield correlations between and disc mass and disc size similar to those in Fig. 18.
6 Summary
In this work, we examine the changes in bulge and disc properties for a sample of galaxies as functions of local projected density. Since galaxy mass and environment are strongly correlated, we divide the sample into bins of equal bulge mass in order to study any residual trends in bulge and disc properties with local density. Using 2-dimensional bulgedisc decompositions, we are able to study the colour–density and morphology–density relations for bulges and discs, separately. Our sample consists of galaxies with a classical, elliptical-like bulge surrounded by a disc. Classical bulges are observed to have the same characteristics as ellipticals of the same mass; the only difference is the encompassing disc. By studying the properties of classical bulge hosts in different environments, we can deduce if local density is the determining factor in whether or not a classical bulge acquires and retains a disc. In addition, we study whether the population of classical bulgedisc galaxies is undergoing a transition from disc-dominated and star-forming in low-density regions to bulge-dominated and passive in high-density regions, as is expected from the morphology–density and colour–density relations.
Based on our results, we can draw two conclusions about the effects of environment on discs around classical bulges. First, both the colour and the mass of these discs changes with increasing density, but these changes occur at different densities and, presumably, on different time-scales. This suggests that star formation quenching and morphological transformation are caused by different physical processes, in agreement with many previous studies of galactic environment (e.g. Goto et al., 2003; Gómez et al., 2003; McIntosh et al., 2004; Kauffmann et al., 2004; Christlein & Zabludoff, 2005; Cooper et al., 2006; Bundy et al., 2006; van den Bosch et al., 2008; Bamford et al., 2009; Skibba et al., 2009; Hudson et al., 2010). Second, although disc properties are a function of environment, the changes in disc colour and disc mass are insufficient to explain why classical bulges have discs and ellipticals do not have discs. While environment clearly affects disc formation and evolution around classical bulges, there must be other parameters that determine whether or not a classical bulge is surrounded by a disc.
The first piece of evidence for our conclusions comes from separating the colour–density relation for bulgedisc galaxies into relations for bulges and discs. We find that the correlation between total galaxy and local density is due entirely to changes in disc colour with density. The small change in bulge colour with increasing density depends on our choice of disc model, but this choice does not noticeably affect disc colours. At fixed bulge mass, disc mass and disc scale length are independent of local density. Thus, there is no evidence for morphological transformation as a function of local density, but there is evidence for star formation quenching in discs with increased local density. Morphological transformation and star formation quenching must occur separately, and any process responsible for star formation quenching cannot dramatically alter stellar discs.
Even for low bulge masses, where the colour–density relation is strongest, the change in disc colour with increasing density is small; increases by mag over two decades in projected galaxy number density. This colour change is not enough to explain the colour–density relation for the entire galaxy population, which is twice as steep. Therefore, the correlations between stellar mass and density and between stellar mass and galaxy colour contribute significantly to the colour–density relation for classical bulgedisc galaxies. We expect processes internal to galaxies, which may depend on stellar mass, are at least as important in moderating star formation as external, environment-related, processes.
The colour–density relation for discs is not linear. By dividing the sample into groups with more or fewer than members, we show that the relation between density and disc colour disappears for galaxies in rich groups, regardless of bulge mass. This is in agreement with results that star formation is quenched well before galaxies enter massive clusters (Gómez et al., 2003; Cooper et al., 2006; McIntosh et al., 2004). It also puts limits on the physical processes responsible for stopping star formation. For example, ram-pressure stripping requires cluster-scale velocities and is unlikely to account for star formation cessation in smaller groups. Strangulation, on the other hand, is effective at relatively low densities and is, therefore, a possible cause of star formation quenching in discs. Although our analysis is not sensitive to colour gradients in discs, changes in these gradients as a function of environment may put additional constraints on the physical processes responsible for disc fading as a function of local density (see Roediger et al., 2011).
After determining that star formation quenching occurs outside rich groups, we examine trends in bulge and disc properties within rich groups. Instead of local projected density, we use the group crossing time, , as a measure of environment. Since depends on distance to the group centre, we restrict our sample to “round” groups, which have a smooth angular distribution of galaxies. Even for these groups, the luminosity-weighted group centre may not be physically relevant; it is not unusual for the most massive galaxy to be offset from the group centre (Skibba et al., 2011; George et al., 2012). The average crossing time for galaxies in this restricted sample is roughly one third of a Hubble time, suggesting most of these galaxies have already orbited their host group at least once. We find no statistically significant correlations with disc colour and , but we do find moderately significant () correlations between disc-to-total mass ratio () and , and between disc scale length and , at fixed bulge mass. The trends in are not a result of correlations between group richness and , or between richness and . In addition, the correlations are also present at the same significance if we replace with local projected density. Like the changes in disc colour as a function of projected density, the changes in disc mass as a function of are small; the median decreases by less than per cent from the largest to the smallest crossing times. None the less, we infer that bulgedisc galaxies do undergo morphological transformations in large groups, but they do not undergo star formation quenching at the same time. This is direct evidence for the separation of morphological transformation and star formation quenching.
The above results demonstrate that environment has two distinct effects on the discs surrounding classical bulges. First, disc star formation is truncated in (relatively) poor groups, leading to the colour–density relation for discs (Fig. 6). Although gas-stripping requires relatively high velocities, tidal interactions and heating by the intra-group median may remove a disc’s outer halo gas supply (strangulation), thus quenching star formation over several gigayears (Larson et al., 1980). This preprocessing of galaxies in small groups has been suggested before as the origin of S0 galaxies (e.g. Dressler et al., 1997). The second effect is a morphological transformation. As these quenched galaxies enter higher density environments in larger groups, the stellar disc is disrupted over several orbits, leading to the observed – correlation. This disruption may be caused by galaxy harassment (Moore et al., 1996), which is most effective for galaxies in high density regions with short crossing times.
Although environment does affect discs around classical bulges, these effects are small. Therefore, while statistically significant, the changes in disc colour with density and disc mass with crossing time are insufficient to explain the full range of the colour–density relation and morphology–density relation. Furthermore, since the changes are small, present-day local density cannot be the determining factor in whether or not a classical bulge has a disc. There must be other processes, unrelated to present-day environment, which regulate disc formation around classical bulges. None the less, because classical bulges and ellipticals of the same mass seem to have the same formation history, the processes that regulate disc formation are probably external to the galaxy. By only examining trends with density at fixed bulge stellar mass, we cannot explore trends in bulge mass with density. Environmental processes, such as ram pressure stripping, may drive bulge growth (e.g. Tonnesen & Bryan, 2009). We plan to explore the effects of environment on bulges at fixed total stellar mass in a later paper.
One way to further explore disc formation around classical bulges would be to look for evolution in discs around classical bulges as a function of redshift. In this paper, we present correlations between disc properties with environment in the local universe. In drawing conclusions, we have assumed these correlations are signatures of the evolution of bulges and discs as galaxies move from low density environments to high density environments. However, these conclusions need to be supplemented with observations of bulges and discs at higher redshifts. The comparison data needed for such studies is easily available from space-based optical and near-infrared surveys. For example, using data from the CANDELS survey, Bruce et al. (2012) presents bulgedisc decompositions for massive galaxies beyond . Careful comparisons of bulges and discs at different redshifts and in different environments will better constrain what effect environment has on the evolution of galaxies and their component bulges and discs.
Acknowledgments
CNL is supported by NSF grant AST0908368.
This work makes extensive use of data from SDSS-III. Funding for SDSS-III has been provided by the Alfred P. Sloan Foundation, the Participating Institutions, the National Science Foundation, and the U.S. Department of Energy Office of Science. The SDSS-III web site is http://www.sdss3.org/.
SDSS-III is managed by the Astrophysical Research Consortium for the Participating Institutions of the SDSS-III Collaboration including the University of Arizona, the Brazilian Participation Group, Brookhaven National Laboratory, University of Cambridge, University of Florida, the French Participation Group, the German Participation Group, the Instituto de Astrofisica de Canarias, the Michigan State/Notre Dame/JINA Participation Group, Johns Hopkins University, Lawrence Berkeley National Laboratory, Max Planck Institute for Astrophysics, New Mexico State University, New York University, Ohio State University, Pennsylvania State University, University of Portsmouth, Princeton University, the Spanish Participation Group, University of Tokyo, University of Utah, Vanderbilt University, University of Virginia, University of Washington, and Yale University.
References
- Adami et al. (2001) Adami C., Mazure A., Ulmer M. P., Savine C., 2001, A&A, 371, 11
- Aihara et al. (2011) Aihara H., Allende Prieto C., An D., Anderson S. F., Aubourg É., Balbinot E., Beers T. C., Berlind A. A., Bickerton S. J., Bizyaev D., Blanton M. R., Bochanski J. J., Bolton A. S., Bovy J., Brandt W. N., Brinkmann J., Brown P. J., et al., 2011, ApJS, 193, 29
- Allen et al. (2006) Allen P. D., Driver S. P., Graham A. W., Cameron E., Liske J., de Propris R., 2006, MNRAS, 371, 2
- Athanassoula (2005) Athanassoula E., 2005, MNRAS, 358, 1477
- Baldry et al. (2006) Baldry I. K., Balogh M. L., Bower R. G., Glazebrook K., Nichol R. C., Bamford S. P., Budavari T., 2006, MNRAS, 373, 469
- Balogh et al. (2004) Balogh M. L., Baldry I. K., Nichol R., Miller C., Bower R., Glazebrook K., 2004, ApJ, 615, L101
- Balogh & Morris (2000) Balogh M. L., Morris S. L., 2000, MNRAS, 318, 703
- Balogh et al. (1999) Balogh M. L., Morris S. L., Yee H. K. C., Carlberg R. G., Ellingson E., 1999, ApJ, 527, 54
- Balogh et al. (2000) Balogh M. L., Navarro J. F., Morris S. L., 2000, ApJ, 540, 113
- Bamford et al. (2009) Bamford S. P., Nichol R. C., Baldry I. K., Land K., Lintott C. J., Schawinski K., Slosar A., Szalay A. S., Thomas D., Torki M., Andreescu D., Edmondson E. M., Miller C. J., Murray P., Raddick M. J., Vandenberg J., 2009, MNRAS, 393, 1324
- Bell et al. (2003) Bell E. F., McIntosh D. H., Katz N., Weinberg M. D., 2003, ApJS, 149, 289
- Berlind et al. (2006) Berlind A. A., Frieman J., Weinberg D. H., Blanton M. R., Warren M. S., Abazajian K., Scranton R., Hogg D. W., Scoccimarro R., Bahcall N. A., Brinkmann J., Gott III J. R., et al., 2006, ApJS, 167, 1
- Bernardi et al. (2006) Bernardi M., Nichol R. C., Sheth R. K., Miller C. J., Brinkmann J., 2006, AJ, 131, 1288
- Bernardi et al. (2003a) Bernardi M., Sheth R. K., Annis J., Burles S., Eisenstein D. J., Finkbeiner D. P., Hogg D. W., Lupton R. H., Schlegel D. J., SubbaRao M., Bahcall N. A., Blakeslee J. P., Brinkmann J., Castander F. J., Connolly A. J., Csabai I., et al., 2003a, AJ, 125, 1817
- Bernardi et al. (2003b) Bernardi M., Sheth R. K., Annis J., Burles S., Eisenstein D. J., Finkbeiner D. P., Hogg D. W., Lupton R. H., Schlegel D. J., SubbaRao M., Bahcall N. A., Blakeslee J. P., Brinkmann J., Castander F. J., Connolly A. J., Csabai I., et al., 2003b, AJ, 125, 1866
- Blanton & Berlind (2007) Blanton M. R., Berlind A. A., 2007, ApJ, 664, 791
- Blanton et al. (2005) Blanton M. R., Eisenstein D., Hogg D. W., Schlegel D. J., Brinkmann J., 2005, ApJ, 629, 143
- Blanton et al. (2006) Blanton M. R., Eisenstein D., Hogg D. W., Zehavi I., 2006, ApJ, 645, 977
- Blanton et al. (2003) Blanton M. R., Hogg D. W., Bahcall N. A., Baldry I. K., Brinkmann J., Csabai I., Eisenstein D., Fukugita M., Gunn J. E., Ivezić Ž., Lamb D. Q., Lupton R. H., Loveday J., et al., 2003, ApJ, 594, 186
- Blanton & Moustakas (2009) Blanton M. R., Moustakas J., 2009, ARA&A, 47, 159
- Blanton & Roweis (2007) Blanton M. R., Roweis S., 2007, AJ, 133, 734
- Boselli & Gavazzi (2006) Boselli A., Gavazzi G., 2006, PASP, 118, 517
- Brinchmann & Ellis (2000) Brinchmann J., Ellis R. S., 2000, ApJ, 536, L77
- Bruce et al. (2012) Bruce V. A., Dunlop J. S., Cirasuolo M., McLure R. J., Targett T. A., Bell E. F., Croton D. J., Dekel A., Faber S. M., Ferguson H. C., Grogin N. A., Kocevski D. D., Koekemoer A. M., Koo D. C., Lai K., Lotz J. M., McGrath E. J., Newman J. A., van der Wel A., 2012, preprint, (arXiv:1206.4322)
- Bruzual & Charlot (2003) Bruzual G., Charlot S., 2003, MNRAS, 344, 1000
- Bundy et al. (2006) Bundy K., Ellis R. S., Conselice C. J., Taylor J. E., Cooper M. C., Willmer C. N. A., Weiner B. J., Coil A. L., Noeske K. G., Eisenhardt P. R. M., 2006, ApJ, 651, 120
- Bundy et al. (2010) Bundy K., Scarlata C., Carollo C. M., Ellis R. S., Drory N., Hopkins P., Salvato M., Leauthaud A., Koekemoer A. M., Murray N., Ilbert O., Oesch P., Ma C.-P., Capak P., Pozzetti L., Scoville N., 2010, ApJ, 719, 1969
- Butcher & Oemler (1978) Butcher H., Oemler Jr. A., 1978, ApJ, 219, 18
- Cameron et al. (2009) Cameron E., Driver S. P., Graham A. W., Liske J., 2009, ApJ, 699, 105
- Caon et al. (1993) Caon N., Capaccioli M., D’Onofrio M., 1993, MNRAS, 265, 1013
- Christlein & Zabludoff (2005) Christlein D., Zabludoff A. I., 2005, ApJ, 621, 201
- Cibinel et al. (2012) Cibinel A., Carollo C. M., Lilly S. J., Bonoli S., Miniati F., Pipino A., Silverman J. D., van Gorkom J. H., Cameron E., Finoguenov A., Norberg P., Rudick C. S., Lu T., Peng Y., 2012, preprint, (arXiv:1206.6496)
- Clemens et al. (2006) Clemens M. S., Bressan A., Nikolic B., Alexander P., Annibali F., Rampazzo R., 2006, MNRAS, 370, 702
- Cooper et al. (2010) Cooper M. C., Gallazzi A., Newman J. A., Yan R., 2010, MNRAS, 402, 1942
- Cooper et al. (2006) Cooper M. C., Newman J. A., Croton D. J., Weiner B. J., Willmer C. N. A., Gerke B. F., Madgwick D. S., Faber S. M., Davis M., Coil A. L., Finkbeiner D. P., Guhathakurta P., Koo D. C., 2006, MNRAS, 370, 198
- Cooper et al. (2008) Cooper M. C., Tremonti C. A., Newman J. A., Zabludoff A. I., 2008, MNRAS, 390, 245
- Croton et al. (2007) Croton D. J., Gao L., White S. D. M., 2007, MNRAS, 374, 1303
- de Jong (1994) de Jong R. S., 1994, PhD thesis, Kapteyn Astronomical Inst.
- De Propris et al. (2004) De Propris R., Colless M., Peacock J. A., Couch W. J., Driver S. P., Balogh M. L., Baldry I. K., Baugh C. M., Bland-Hawthorn J., Bridges T., Cannon R., Cole S., Collins C., Cross N., Dalton G., Efstathiou G., Ellis R. S., et al., 2004, MNRAS, 351, 125
- de Vaucouleurs (1961) de Vaucouleurs G., 1961, ApJS, 5, 233
- Dressler (1980) Dressler A., 1980, ApJ, 236, 351
- Dressler et al. (1987) Dressler A., Lynden-Bell D., Burstein D., Davies R. L., Faber S. M., Terlevich R., Wegner G., 1987, ApJ, 313, 42
- Dressler et al. (1997) Dressler A., Oemler Jr. A., Couch W. J., Smail I., Ellis R. S., Barger A., Butcher H., Poggianti B. M., Sharples R. M., 1997, ApJ, 490, 577
- Elmegreen et al. (2009) Elmegreen B. G., Elmegreen D. M., Fernandez M. X., Lemonias J. J., 2009, ApJ, 692, 12
- Emsellem et al. (1996) Emsellem E., Bacon R., Monnet G., Poulain P., 1996, A&A, 312, 777
- Falcón-Barroso et al. (2002) Falcón-Barroso J., Peletier R. F., Balcells M., 2002, MNRAS, 335, 741
- Ferguson & Sandage (1990) Ferguson H. C., Sandage A., 1990, AJ, 100, 1
- Fisher (2006) Fisher D. B., 2006, ApJ, 642, L17
- Fisher & Drory (2008) Fisher D. B., Drory N., 2008, AJ, 136, 773
- Gadotti (2009) Gadotti D. A., 2009, MNRAS, 393, 1531
- Gallazzi et al. (2006) Gallazzi A., Charlot S., Brinchmann J., White S. D. M., 2006, MNRAS, 370, 1106
- Gallazzi et al. (2005) Gallazzi A., Charlot S., Brinchmann J., White S. D. M., Tremonti C. A., 2005, MNRAS, 362, 41
- George et al. (2012) George M. R., Leauthaud A., Bundy K., Finoguenov A., Ma C.-P., Rykoff E. S., Tinker J. L., Wechsler R. H., Massey R., Mei S., 2012, ApJ, 757, 2
- Gómez et al. (2003) Gómez P. L., Nichol R. C., Miller C. J., Balogh M. L., Goto T., Zabludoff A. I., Romer A. K., Bernardi M., Sheth R., Hopkins A. M., Castander F. J., Connolly A. J., Schneider D. P., Brinkmann J., Lamb D. Q., SubbaRao M., York D. G., 2003, ApJ, 584, 210
- Goto et al. (2003) Goto T., Yamauchi C., Fujita Y., Okamura S., Sekiguchi M., Smail I., Bernardi M., Gomez P. L., 2003, MNRAS, 346, 601
- Grützbauch et al. (2011) Grützbauch R., Conselice C. J., Varela J., Bundy K., Cooper M. C., Skibba R., Willmer C. N. A., 2011, MNRAS, 411, 929
- Gunn & Gott (1972) Gunn J. E., Gott J. R. I., 1972, ApJ, 176, 1
- Hamilton (1988) Hamilton A. J. S., 1988, ApJ, 331, L59
- Hansen et al. (2009) Hansen S. M., Sheldon E. S., Wechsler R. H., Koester B. P., 2009, ApJ, 699, 1333
- Hashimoto et al. (1998) Hashimoto Y., Oemler Jr. A., Lin H., Tucker D. L., 1998, ApJ, 499, 589
- Hogg et al. (2003) Hogg D. W., Blanton M. R., Eisenstein D. J., Gunn J. E., Schlegel D. J., Zehavi I., Bahcall N. A., Brinkmann J., Csabai I., Schneider D. P., Weinberg D. H., York D. G., 2003, ApJ, 585, L5
- Hoyle et al. (2012) Hoyle B., Masters K. L., Nichol R. C., Jimenez R., Bamford S. P., 2012, MNRAS, p. 3144
- Hudson et al. (2010) Hudson M. J., Stevenson J. B., Smith R. J., Wegner G. A., Lucey J. R., Simard L., 2010, MNRAS, 409, 405
- Kauffmann et al. (2003) Kauffmann G., Heckman T. M., White S. D. M., Charlot S., Tremonti C., Brinchmann J., Bruzual G., Peng E. W., Seibert M., Bernardi M., Blanton M., Brinkmann J., et al., 2003, MNRAS, 341, 33
- Kauffmann et al. (2004) Kauffmann G., White S. D. M., Heckman T. M., Ménard B., Brinchmann J., Charlot S., Tremonti C., Brinkmann J., 2004, MNRAS, 353, 713
- Kormendy (1977) Kormendy J., 1977, ApJ, 218, 333
- Kormendy (1993) Kormendy J., 1993, in H. Dejonghe & H. J. Habing ed., Galactic Bulges Vol. 153 of IAU Symposium, Kinematics of extragalactic bulges: evidence that some bulges are really disks. pp 209–+
- Kormendy & Kennicutt (2004) Kormendy J., Kennicutt Jr. R. C., 2004, ARA&A, 42, 603
- Kregel et al. (2002) Kregel M., van der Kruit P. C., de Grijs R., 2002, MNRAS, 334, 646
- Kroupa (2002) Kroupa P., 2002, Science, 295, 82
- Lackner & Gunn (2012) Lackner C. N., Gunn J. E., 2012, MNRAS, p. 2423
- Larson et al. (1980) Larson R. B., Tinsley B. M., Caldwell C. N., 1980, ApJ, 237, 692
- Leauthaud et al. (2012) Leauthaud A., George M. R., Behroozi P. S., Bundy K., Tinker J., Wechsler R. H., Conroy C., Finoguenov A., Tanaka M., 2012, ApJ, 746, 95
- Lewis et al. (2002) Lewis I., Balogh M., De Propris R., Couch W., Bower R., Offer A., Bland-Hawthorn J., Baldry I. K., Baugh C., Bridges T., Cannon R., et al., 2002, MNRAS, 334, 673
- Lintott et al. (2011) Lintott C., Schawinski K., Bamford S., Slosar A., Land K., Thomas D., Edmondson E., Masters K., Nichol R. C., Raddick M. J., Szalay A., Andreescu D., Murray P., Vandenberg J., 2011, MNRAS, 410, 166
- MacArthur et al. (2010) MacArthur L. A., Ellis R. S., Treu T., Moran S. M., 2010, ApJ, 709, L53
- MacArthur et al. (2008) MacArthur L. A., Ellis R. S., Treu T., U V., Bundy K., Moran S., 2008, ApJ, 680, 70
- Macciò et al. (2008) Macciò A. V., Dutton A. A., van den Bosch F. C., 2008, MNRAS, 391, 1940
- Maller et al. (2009) Maller A. H., Berlind A. A., Blanton M. R., Hogg D. W., 2009, ApJ, 691, 394
- McIntosh et al. (2004) McIntosh D. H., Rix H.-W., Caldwell N., 2004, ApJ, 610, 161
- Merritt (1984) Merritt D., 1984, ApJ, 276, 26
- Moore et al. (1996) Moore B., Katz N., Lake G., 1996, ApJ, 457, 455
- Moore et al. (1998) Moore B., Lake G., Katz N., 1998, ApJ, 495, 139
- Moore et al. (1999) Moore B., Quinn T., Governato F., Stadel J., Lake G., 1999, MNRAS, 310, 1147
- Moorthy & Holtzman (2006) Moorthy B. K., Holtzman J. A., 2006, MNRAS, 371, 583
- Moran et al. (2007) Moran S. M., Loh B. L., Ellis R. S., Treu T., Bundy K., MacArthur L. A., 2007, ApJ, 665, 1067
- Mulchaey & Zabludoff (1999) Mulchaey J. S., Zabludoff A. I., 1999, ApJ, 514, 133
- Muldrew et al. (2012) Muldrew S. I., Croton D. J., Skibba R. A., Pearce F. R., Ann H. B., Baldry I. K., Brough S., Choi Y.-Y., Conselice C. J., Cowan N. B., Gallazzi A., Gray M. E., Grützbauch R., Li I.-H., et al., 2012, MNRAS, 419, 2670
- Oemler (1974) Oemler Jr. A., 1974, ApJ, 194, 1
- Peletier & Balcells (1996) Peletier R. F., Balcells M., 1996, AJ, 111, 2238
- Peletier et al. (1999) Peletier R. F., Balcells M., Davies R. L., Andredakis Y., Vazdekis A., Burkert A., Prada F., 1999, MNRAS, 310, 703
- Peng et al. (2011) Peng Y., Lilly S. J., Renzini A., Carollo M., 2011, preprint, (arXiv:1106.2546)
- Peng et al. (2010) Peng Y.-j., Lilly S. J., Kovač K., Bolzonella M., Pozzetti L., Renzini m., Zamorani G., Ilbert O., Knobel C., Iovino A., Maier C., Cucciati O., Tasca L., Carollo C. M., Silverman J., et al., 2010, ApJ, 721, 193
- Postman et al. (2005) Postman M., Franx M., Cross N. J. G., Holden B., Ford H. C., Illingworth G. D., Goto T., Demarco R., Rosati P., Blakeslee J. P., Tran K., et al., 2005, ApJ, 623, 721
- Postman & Geller (1984) Postman M., Geller M. J., 1984, ApJ, 281, 95
- Roediger et al. (2011) Roediger J. C., Courteau S., MacArthur L. A., McDonald M., 2011, MNRAS, 416, 1996
- Schawinski et al. (2009) Schawinski K., Lintott C., Thomas D., Sarzi M., Andreescu D., Bamford S. P., Kaviraj S., Khochfar S., Land K., Murray P., Nichol R. C., Raddick M. J., Slosar A., Szalay A., Vandenberg J., Yi S. K., 2009, MNRAS, 396, 818
- Schlegel et al. (1998) Schlegel D. J., Finkbeiner D. P., Davis M., 1998, ApJ, 500, 525
- Simard et al. (2011) Simard L., Mendel J. T., Patton D. R., Ellison S. L., McConnachie A. W., 2011, ApJS, 196, 11
- Skibba (2009) Skibba R. A., 2009, MNRAS, 392, 1467
- Skibba et al. (2009) Skibba R. A., Bamford S. P., Nichol R. C., Lintott C. J., Andreescu D., Edmondson E. M., Murray P., Raddick M. J., Schawinski K., Slosar A., Szalay A. S., Thomas D., Vandenberg J., 2009, MNRAS, 399, 966
- Skibba & Sheth (2009) Skibba R. A., Sheth R. K., 2009, MNRAS, 392, 1080
- Skibba et al. (2011) Skibba R. A., van den Bosch F. C., Yang X., More S., Mo H., Fontanot F., 2011, MNRAS, 410, 417
- Smith et al. (2005) Smith G. P., Treu T., Ellis R. S., Moran S. M., Dressler A., 2005, ApJ, 620, 78
- Smith et al. (2006) Smith R. J., Hudson M. J., Lucey J. R., Nelan J. E., Wegner G. A., 2006, MNRAS, 369, 1419
- Strateva et al. (2001) Strateva I., Ivezić Ž., Knapp G. R., Narayanan V. K., Strauss M. A., Gunn J. E., Lupton R. H., Schlegel D., Bahcall N. A., Brinkmann J., Brunner R. J., Budavári T., et al., 2001, AJ, 122, 1861
- Tanaka et al. (2004) Tanaka M., Goto T., Okamura S., Shimasaku K., Brinkmann J., 2004, AJ, 128, 2677
- Tasca et al. (2009) Tasca L. A. M., Kneib J.-P., Iovino A., Le Fèvre O., Kovač K., Bolzonella M., Lilly S. J., Abraham R. G., Cassata P., Cucciati O., Guzzo L., Tresse L., Zamorani G., Capak P., Garilli B., et al., 2009, A&A, 503, 379
- Thomas et al. (2005) Thomas D., Maraston C., Bender R., Mendes de Oliveira C., 2005, ApJ, 621, 673
- Thomas et al. (2007) Thomas D., Maraston C., Schawinski K., Sarzi M., Joo S.-J., Kaviraj S., Yi S. K., 2007, in Vazdekis A., Peletier R. F., eds, IAU Symposium Vol. 241 of IAU Symposium, Environment and the epochs of galaxy formation in the SDSS era. pp 546–550
- Tonnesen & Bryan (2009) Tonnesen S., Bryan G. L., 2009, ApJ, 694, 789
- Trager et al. (2008) Trager S. C., Faber S. M., Dressler A., 2008, MNRAS, 386, 715
- Trager et al. (2000) Trager S. C., Faber S. M., Worthey G., González J. J., 2000, AJ, 120, 165
- Tremonti et al. (2004) Tremonti C. A., Heckman T. M., Kauffmann G., Brinchmann J., Charlot S., White S. D. M., Seibert M., Peng E. W., Schlegel D. J., Uomoto A., Fukugita M., Brinkmann J., 2004, ApJ, 613, 898
- Treu et al. (2003) Treu T., Ellis R. S., Kneib J.-P., Dressler A., Smail I., Czoske O., Oemler A., Natarajan P., 2003, ApJ, 591, 53
- Tuffs et al. (2004) Tuffs R. J., Popescu C. C., Völk H. J., Kylafis N. D., Dopita M. A., 2004, A&A, 419, 821
- van den Bosch et al. (2008) van den Bosch F. C., Aquino D., Yang X., Mo H. J., Pasquali A., McIntosh D. H., Weinmann S. M., Kang X., 2008, MNRAS, 387, 79
- Weinmann et al. (2006) Weinmann S. M., van den Bosch F. C., Yang X., Mo H. J., 2006, MNRAS, 366, 2
- Weinzirl et al. (2009) Weinzirl T., Jogee S., Khochfar S., Burkert A., Kormendy J., 2009, ApJ, 696, 411
- Whitmore & Gilmore (1991) Whitmore B. C., Gilmore D. M., 1991, ApJ, 367, 64
- Worthey (1994) Worthey G., 1994, ApJS, 95, 107
- Wyse et al. (1997) Wyse R. F. G., Gilmore G., Franx M., 1997, ARA&A, 35, 637
- Yang et al. (2007) Yang X., Mo H. J., van den Bosch F. C., Pasquali A., Li C., Barden M., 2007, ApJ, 671, 153
- Zabludoff & Mulchaey (1998) Zabludoff A. I., Mulchaey J. S., 1998, ApJ, 496, 39
Appendix A Classification of Galaxies
Below, we describe the galaxy classification scheme briefly outlined in §2.1.1. We explain the classification of each type of galaxy, paying special attention to the probabilistic separation of ellipticals, classical bulgedisc galaxies, and pseudo-bulgedisc galaxies.
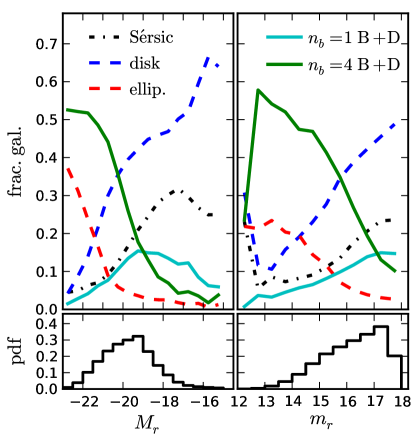
-
1.
Bulge-less galaxies: First, we identify galaxies which are best fit by a disc-only model. We assign them a probability of being fit by a single exponential equal to one. These bulge-less galaxies are selected because they have an de Vaucouleurs bulge-to-total luminosity ratio in the band () smaller than per cent, or because there is no statistically significant improvement in the fit by adding a bulge component. These galaxies account for per cent of the L12 sample ( galaxies). These galaxies are not strictly bulge-less, but include galaxies with bulges too small to detect using bulgedisc decompositions. Fig. 19 shows that these galaxies are predominately intrinsically (and apparently) faint, as expected for disc galaxies with, at most, very small bulges. Because we use a bright () subset of galaxies from L12, bulge-less galaxies are a smaller fraction ( per cent) of our sample than of the whole L12 sample.
-
2.
Ellipticals and red disc galaxies: Next, we select a sample of elliptical galaxies. As above, galaxies with are assumed to be disc-less elliptical galaxies. As discussed in L12 (see also Allen et al., 2006), 2-dimensional bulge+disc models of elliptical galaxies usually consist of a de Vaucouleurs profile and a low surface brightness “disc”. This model “disc” component has several possible origins: the outer halo of ellipticals, a Sérsic index larger than , and/or inadequate sky subtraction around bright galaxies in SDSS. This model “disc” component makes elliptical galaxies indistinguishable from dustless, face-on, red classical bulgedisc galaxies based on photometry alone. Therefore, we must use other information to separate red ellipticals from face-on red classical bulgedisc galaxies. Below, we describe a method for separating face-on bulgedisc galaxies from ellipticals. We only apply this separation to galaxies with red colours for both the model de Vaucouleurs bulge and model disc: (Strateva et al., 2001). This colour cut ensures that the outer exponential halo around elliptical galaxies will not be star-forming. However, we cannot identify blue ellipticals in our sample using this colour cut.
Despite their similarities, we can separate red bulgedisc galaxies and ellipticals based on the statistics of the modelled disc axis ratios, . If the discs are randomly oriented, then should be uniformly distributed for values larger than the disc scale height to scale length ratio, . The probability density function is given by . We use , which is smaller than the average value (Kregel et al., 2002). However, any less than 0.2 has a negligible effect on the results. If the bulgedisc models are applied to ellipticals, then the distribution of will be skewed to higher values, mimicking face-on discs. Although it is impossible to distinguish a dustless, face-on classical bulgedisc galaxy from an elliptical, we can assign each galaxy a probability of being an elliptical or bulgedisc galaxy based on its model .
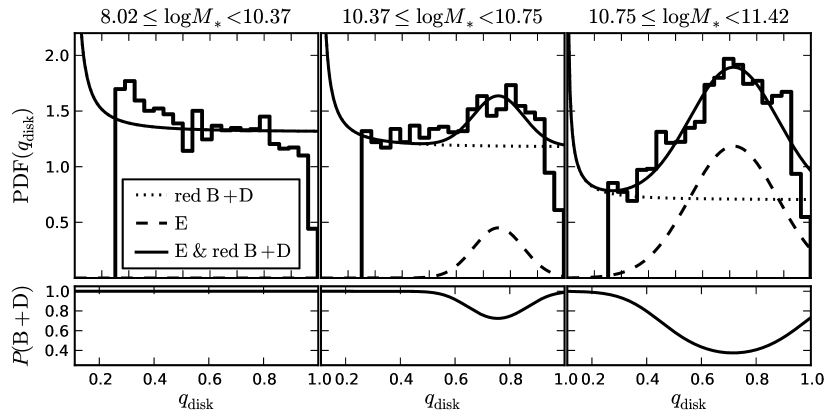
Figure 20: Top row: The disc axis ratio distribution for red bulgered disc galaxies and ellipticals divided into three stellar mass bins. These galaxies are selected to have red () bulges and discs. The dotted curve is the best-fitting disc axis ratio distribution for red BD galaxies (flat above ) and the dashed curve is a Gaussian fit to the distribution of disc axis ratios from bulgedisc models fit to ellipticals. The sum of these curves is shown by the solid line, which is fit to the histogram. Bottom row: The probability that a red galaxy with a given axis ratio and mass is a red classical bulgered disc galaxy as opposed to an elliptical. Fig. 20 shows the statistical separation of red bulgedisc and ellipticals for galaxies divided into three stellar mass bins. The upper panels show the distribution of for galaxies with red () model de Vaucouleurs bulge and exponential disc colours, and . Each distribution of axis ratios has two contributions, one from disc galaxies, which follows the distribution for randomly oriented discs, and one from ellipticals, which we model as a Gaussian distribution in with an arbitrary centroid and width. We separately fit each distribution of in Fig. 20 with a linear combination of these two probability density functions. Since small measured axis ratios are often due to poor fits, we only use galaxies with for the fitting. The fractional contribution from each function gives the probability that a galaxy with a given is an elliptical or a red classical bulgered disc galaxy (lower panels Fig. 20). For low mass galaxies, the distribution of axis ratios does not show any contribution from ellipticals. At any stellar mass, a small value for implies a galaxy has a real disc. For , the probability that a galaxy is an elliptical rises to per cent for the highest mass galaxies.
This method of distinguishing between bulgedisc galaxies and ellipticals does not allow us to definitively assign a galaxy to either category, but we can still examine the properties of the whole sample, simply by weighting each galaxy by its likelihood of being an red bulgered disc galaxy or an elliptical. Counting all galaxies with as ellipticals, we find that per cent ( galaxies) of the L12 sample are red bulgered disc galaxies and per cent ( galaxies) are ellipticals.
When selecting galaxies with red bulge and disc components for Fig. 20, we first correct the bulge and disc colours for inclination in order to eliminate edge-on, dusty galaxies. However, if the inclination corrections are too large, there will be fewer galaxies with small , and the fraction of ellipticals will be enhanced. Therefore, we iteratively adjust the inclination corrections in and such that, after identifying elliptical galaxies, there is no residual trend in corrected disc colour with disc inclination for red bulgered disc galaxies. The final adjustments make the inclination corrections in and smaller than those in L12, but the adjustments are minimal. They change the number of ellipticals in sample by less than per cent of the total sample ( galaxies). If we used no inclination correction, the number of ellipticals in the sample would decrease by galaxies.
-
3.
Classical and pseudo-bulges: After identifying ellipticals and red classical bulgedisc galaxies, we classify the remaining galaxies as either classical bulge hosts or pseudo-bulge hosts. We separate classical bulges and pseudo-bulges based on the age of the central stellar populations. Fisher (2006) show that pseudo-bulges selected by morphology have higher central star formation rates than classical bulges, in agreement with the notion that pseudo-bulges form via secular processes in discs which drive gas inwards and enhance the central star formation (Kormendy & Kennicutt, 2004). Fig. 21 shows the distribution of the Å break strength for the classical and pseudo-bulge galaxies. These values are taken from the MPA/JHU catalogue of measured spectroscopic quantities from SDSS (Tremonti et al., 2004; Aihara et al., 2011)555http://www.mpa-garching.mpg.de/SDSS/DR7/raw_data.html. The value plotted is the narrow definition of the Å break, D (Balogh et al., 1999). The SDSS spectrograph uses arcsec fibres; two-thirds of the galaxies shown have a bulge-to-total flux ratio within 3 arcsec larger than . Therefore, the fibre spectroscopic quantities are typically dominated by the stellar light from the bulge.
Fig. 21 shows there are two populations of bulges, those with recent star formation (within Gyr) and small and those without recent star formation and large .
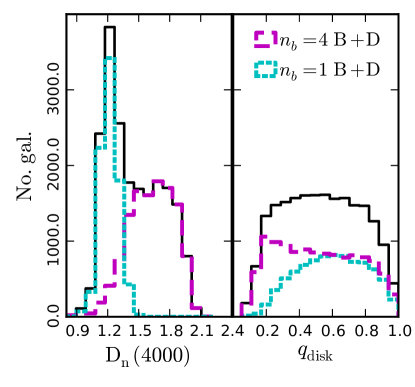
Figure 21: Left: The distribution of the Å break (D) for classical (magenta) and pseudo- (cyan) bulges. The total distribution (black line) is fit with two Gaussians in order to separate the the two types of bulges. Right: The distribution of the disc axis ratios for classical and pseudo-bulges. The excess of edge-on discs around classical bulges is due to the inclusion of edge-on red BD galaxies. The lack of edge on discs around pseudo-bulges is due to the difficulty of detecting a flat pseudo-bulge in an edge-on disc. This suggests that can be used to separate quiescent classical bulges from star-forming pseudo-bulges. We fit the distribution of with two Gaussians and assign each galaxy a probability of having a classical bulge or pseudo-bulge based on the ratio of the Gaussians at a given . Once again, an individual galaxy’s type is unknown, but the statistical properties of the whole sample can be examined. Sixty per cent of the bulges in Fig. 21 are classical bulges. Classical bulge galaxies make up per cent of the total L12 sample, while pseudo-bulges represent percent.
The right panel of Fig. 21 shows the distribution of disc axis ratios for classical and pseudo-bulge host discs. This is one test of our separation of pseudo-bulges and classical bulges, as we expect the distributions to match the flat distribution for randomly oriented discs. Although the distribution of for classical bulge host discs together with pseudo-bulge host discs is flat, the separate distributions for classical and pseudo-bulge hosts are not. The pseudo-bulge host discs have axis ratios which are too large. This is expected, since pseudo-bulges are typically flattened, making them difficult to detect in edge-on discs. Edge-on pseudo bulge hosts are more likely to be considered bulge-less galaxies.
The slight excess of low axis ratio discs around classical bulges is due to the inclusion of inclined, but dust-poor, red bulgered disc galaxies. When selecting red bulgedisc galaxies and ellipticals above, we included an inclination correction, although we expect that some bulgedisc (and most ellipticals) will be essentially dust-free. Correcting these galaxies for inclination shifts their colours bluewards, removing them from the red sample. This is especially true for highly-inclined (low ) galaxies, where the colour corrections are largest. Therefore, the excess of small classical bulges galaxies consists mainly of red classical bulgered disc galaxies. Since all these galaxies host classical bulges, it is not important to accurately separate them based on colour.
The physical origins of classical and pseudo-bulges are very different. Classical bulges are thought to have formed by the same mechanisms as ellipticals, while pseudo-bulges arise from secular processes in discs (disc instabilities, bars, etc) (e.g. Kormendy & Kennicutt, 2004). Furthermore, the absolute magnitude distribution of pseudo-bulge galaxies in Fig. 19 is more similar to that of bulge-less and unclassifiable galaxies than it is to classical bulge hosts. In this work, we will consider galaxies with pseudo-bulges as a subset of bulge-less disc galaxies. Because pseudo-bulges galaxies are relatively faint, they are a small fraction ( per cent) of the bright () subsample from L12 used below. Therefore, the exclusion of pseudo-bulge hosts from bulgedisc galaxies does significantly affect our results.
-
4.
Unclassifiable galaxies: The unclassifiable galaxies in our sample are modelled by a single Sérsic profile. These are galaxies which are not well fit by any of the other models, i.e. they have model bulges which are larger than their discs, or they have fluxes in , , or consistent with zero for the bulge or disc (or both). They are given a probability of being fit by a Sérsic profile equal to unity. Of the galaxies in L12, ( per cent) are deemed unclassifiable. The average unclassifiable galaxy is magnitudes fainter than the average galaxy in the sample (see Fig. 19). Seventy-five percent of unclassifiable galaxies have a Sérsic index less than and the same fraction lie in the blue cloud (). These galaxies are probably disc-like irregulars, which are unlikely to have a well-defined bulge and disc. The remaining per cent of unclassifiable galaxies are mostly merger remnants, starbursts, and other complicated morphologies. None the less, because the majority of unclassifiable galaxies exhibit disc-like properties, we group them with other bulge-less galaxies described above. Since the sample used here is a bright subsample of the L12 sample, the unclassifiable galaxies make up a smaller fraction (less than per cent) of the bright subsample than of the whole L12 sample.