The VLT-FLAMES Tarantula Survey. IX. The interstellar medium seen through Diffuse Interstellar Bands and neutral sodium
Abstract
Context. The Tarantula Nebula (a.k.a. 30 Dor) is a spectacular star-forming region in the Large Magellanic Cloud (LMC), seen through gas in the Galactic Disc and Halo. Diffuse Interstellar Bands (DIBs) offer a unique probe of the diffuse, cool–warm gas in these regions.
Aims. The aim is to use DIBs as diagnostics of the local interstellar conditions, whilst at the same time deriving properties of the yet-unknown carriers of these enigmatic spectral features.
Methods. Spectra of over 800 early-type stars from the Very Large Telescope Flames Tarantula Survey (VFTS) were analysed. Maps were created, separately, for the Galactic and LMC absorption in the DIBs at 4428 and 6614 Å and – in a smaller region near the central cluster R 136 – neutral sodium (the Na i D doublet); we also measured the DIBs at 5780 and 5797 Å.
Results. The maps show strong 4428 and 6614 Å DIBs in the quiescent cloud complex to the south of 30 Dor but weak absorption in the harsher environments to the north (bubbles) and near the OB associations. The Na maps show at least five kinematic components in the LMC and a shell-like structure surrounding R 136, and small-scale structure in the Milky Way. The strengths of the 4428, 5780, 5797 and 6614 Å DIBs are correlated, also with Na absorption and visual extinction. The strong 4428 Å DIB is present already at low Na column density but the 6614, 5780 and 5797 Å DIBs start to be detectable at subsequently larger Na column densities.
Conclusions. The carriers of the 4428, 6614, 5780 and 5797 Å DIBs are increasingly prone to removal from irradiated gas. The relative strength of the 5780 and 5797 Å DIBs clearly confirm the Tarantula Nebula as well as Galactic high-latitude gas to represent a harsh radiation environment. The resilience of the 4428 Å DIB suggests its carrier is large, compact and neutral. Structure is detected in the distribution of cool–warm gas on scales between one and pc in the LMC and as little as pc in the Sun’s vicinity. Stellar winds from the central cluster R 136 have created an expanding shell; some infalling gas is also detected, reminiscent of a galactic “fountain”.
Key Words.:
ISM: individual objects: Tarantula Nebula (30 Doradus Nebula) – ISM: kinematics and dynamics – ISM: lines and bands – ISM: molecules – ISM: structure – local interstellar matter1 Introduction
Diffuse Interstellar Bands (DIBs) were discovered more than a century ago (Heger 1922; cf. Whittet 1992). Over 400 DIBs are now known, mostly in the 4000–9000 Å spectral range, displaying a rich variety in strength, width and shape (Hobbs et al. 2008, 2009). They can be used to trace the diffuse, cool–warm interstellar medium (ISM) (cf. Wolfire et al. 2003). Their correlation with interstellar reddening, , and the abundance of atoms (e.g., H, K, Na, Ca+) and simple molecules (e.g., CN, CH, CH+) ranges from excellent to poor (Merrill & Wilson 1938; Krełowski et al. 1999; Friedman et al. 2011); this suggests the carriers of the DIBs are different from ordinary dust grains, atoms and simple molecules and thus offer a unique probe of the interstellar environment. For instance, the 5780 and 5797 Å DIBs display different relative strength in harsh ( clouds) and mild ( clouds) radiation fields (Krełowski & Westerlund 1988; Cami et al. 1997; Krełowski et al. 1999; van Loon et al. 2009; Vos et al. 2011); DIBs are generally associated with the diffuse ISM as opposed to dense molecular clouds (see, e.g., Herbig 1993).
The situation is rather embarrassing as the carriers of the DIBs remain unknown. The strength of the DIBs are often correlated among themselves but not always (Cami et al. 1997; Moutou et al. 1999; McCall et al. 2010), which implies a diversity of carriers. The prevailing suspicion at the moment is that the carriers are complex, carbon-based (i.e. “organic”) molecular structures, possibly Polycyclic Aromatic Hydrocarbons (PAHs – Crawford, Tielens & Allamandola 1985; van der Zwet & Allamandola 1985; Léger & D’Hendecourt 1985); they are probably ionized, perhaps protonated (Herbig 1995), and may constitute % of the total PAH abundance (Cox 2011), the latter being measured from their infrared (IR) emission bands. Perhaps most mysterious is the total lack of DIBs in other environments, e.g., circumstellar envelopes or comets (see Cox 2011), where PAHs are seen.
The strongest, and one of the broadest, the 4428 Å DIB was discovered by Merrill (1934). The profile is well represented by a Lorentzian profile, which Snow, Zukowski & Massey (2002) interpreted as due to broadening by natural damping in a molecular carrier; they also showed “saturation” of the growth of equivalent width for mag, which they explained by the carrier being present in the skins of clouds but not deeper inside (see also Herbig 1995). The 6614 Å DIB reaches similar depth as the 4428 Å DIB but is much narrower; it displays sub-structure resembling a blend of transitions (Sarre et al. 1995), which was taken as further evidence for a molecular carrier (see also Cami et al. 2004). These two DIBs are the main focus of the study we present here.
DIBs have been detected in the ISM of the Magellanic Clouds (e.g., Walker 1963; Hutchings 1964; Vladilo et al. 1987; Ehrenfreund et al. 2002), whose red-shifts of km s-1 (Small Magellanic Cloud – SMC) and km s-1 (Large Magellanic Cloud – LMC) allow easy separation of Galactic foreground absorption and internal Magellanic Cloud absorption for relatively narrow DIBs such as the 6614 Å DIB but not for the broader DIBs such as the 4428 Å DIB. Any dependency on metallicity (% and % solar in the SMC and LMC, respectively), or lack thereof, could reveal clues about the composition of the carrier of the DIB. Welty et al. (2006), for instance, found both the 5780 and 5797 Å DIBs are weaker by a factor 7–9 in the LMC and 20 in the SMC relative to H i in comparison to Galactic sightlines, a stronger difference than explained by metallicity alone; individual elemental abundances may be key, such as the nitrogen abundance which is more depleted than carbon in the Magellanic Clouds (van Loon et al. 2010a,b). Cox et al. (2006, 2007) suggest that besides metallicity, the generally harsher ultraviolet (UV) radiation field in lower-metallicity ISM is the other factor determining the behaviour of the DIBs in the Magellanic Clouds.
Multi-object or integral-field spectroscopic capabilities offer an efficient way in which to map the ISM. Following the first atomic absorption-line map of the intervening ISM towards the Galactic globular cluster Centauri (van Loon et al. 2007) we also mapped the 5780 and 5797 Å DIBs in that direction and found a high ratio indicative of the harsh radiation field that characterises the extra-planar environment of the Milky Way (van Loon et al. 2009). We have since embarked on a programme to construct maps of the DIB strength across large areas of the Magellanic Clouds, and here present the first such map of the 4428 and 6614 Å DIBs covering the Tarantula Nebula in the LMC, arguably the most prolific star-forming region in the Local Group, as well as Galactic high-latitude foreground gas.
| Mode | setting | FWHM | sightlines | DIB | ||
|---|---|---|---|---|---|---|
| (Å) | available | accepted | (Å) | |||
| LMC | Galactic | |||||
| Medusa | LR02 | 0.61 | 893 | 786 | 786 | 4428 |
| HR15N | 0.41 | 893 | 657 | 608 | 6614 | |
| ARGUS | LR02 | 0.40 | 42a | 40a | 40a | 4428 |
| UVES | 520(L) | 0.10 | 25 | 24 | 24 | 4428 |
| 520(U) | 0.10 | 25 | 25 | 24 | 5780 | |
| 520(U) | 0.10 | 25 | 25 | 25 | 5797 | |
Notes: – includes a spectrum of the unresolved core of R 136.
2 Measurements
The optical spectra were all obtained as part of the Very Large Telescope FLAMES Tarantula Survey (VFTS; Evans et al. 2011). They comprise three sets, arising from the use of different modes and settings of the FLAMES instrument (Pasquini et al. 2002), of which Table 1 summarises the spectral resolution (Full Width at Half Maximum – FWHM), the number of sightlines we extracted, and the DIB that we analyse here. Additional DIBs are covered by the spectral ranges but they are too weak for a meaningful analysis of the kind intended here. We also searched for the sharp lines from CH and CH+ molecules at 4300 and 4232 Å, respectively (cf. Welty et al. 2006), but found no trace of them above a 3- level of Å; this is not unexpected as in Welty et al.’s sample of 20 sightlines only one exceeded this limit (and only in CH).
2.1 Diffuse Interstellar Bands
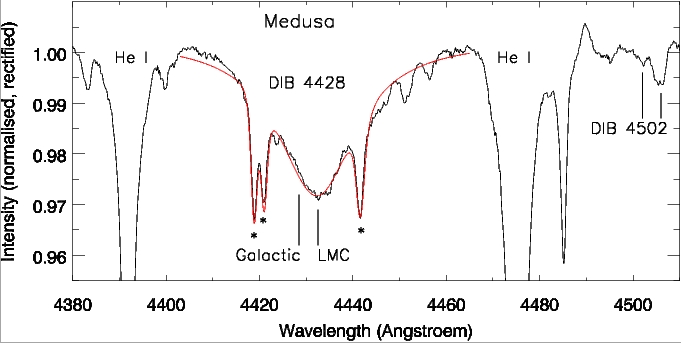
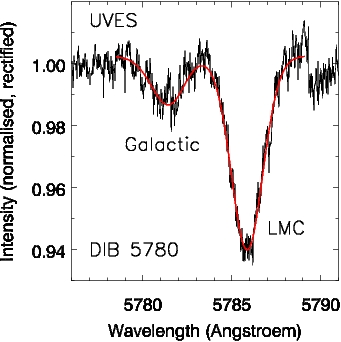
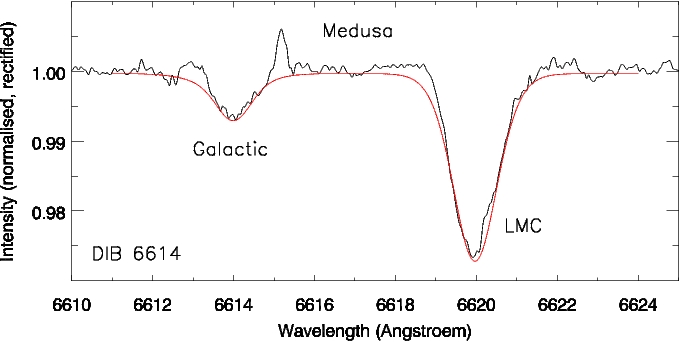
The Medusa spectra were acquired using different settings with somewhat different spectral resolution. A total of 800 sightlines were analysed, comprising O-type stars and B-type stars; 93 additional spectra of A- or later type stars were excluded from the present analysis as the interstellar features are more affected by the photospheric lines. Six spectra were obtained for each star, within a year (some stars were observed more often). These spectra were normalised and rectified in the spectral region surrounding the interstellar features using a -order polynomial, before being averaged using weights according to the r.m.s. scatter in the “continuum” regions chosen to be as little troubled by spectral features as possible. The r.m.s.(squared)-weighted averages of those (normalised and rectified) spectra with reasonable fits (see Appendix) to the 4428 and 6614 Å DIBs are displayed in Figs. 1 and 2, respectively.
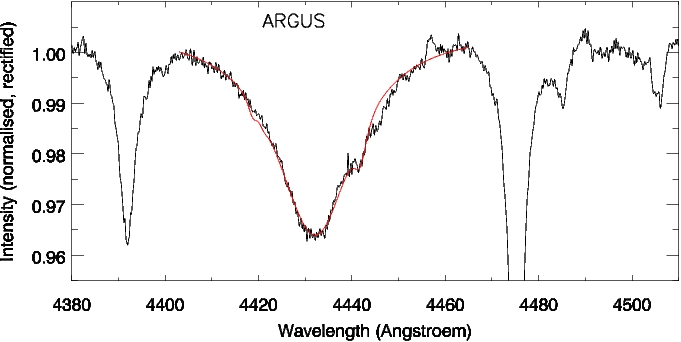
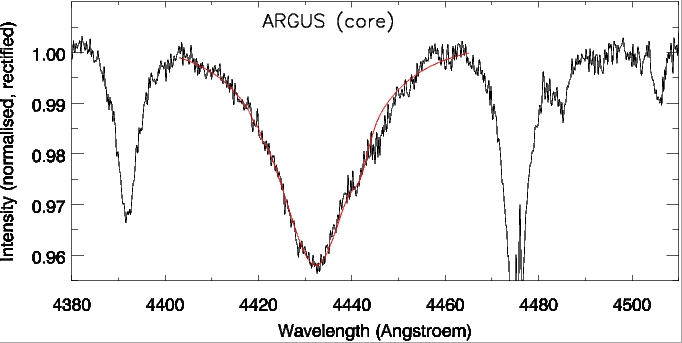
The ARGUS spectra were acquired with the same LR02 setting also used with Medusa, on five occasions. ARGUS is an integral-field unit which was used to more reliably extract the spectra of stars in the proximity of the R 136 cluster core – a spectrum of the unresolved core was also extracted. These spectra are dominated by O-type stars, in contrast to the Medusa spectra that are dominated by B-type stars. Stars VFTS 542, 570 and 585 were observed both with Medusa and ARGUS. The ARGUS spectra were treated in the same manner as the Medusa spectra. The r.m.s.(squared)-weighted average of those (normalised and rectified) spectra with reasonable fits (see Appendix) to the 4428 Å DIB is displayed in Fig. 1, along with the spectrum of the unresolved core of R 136.
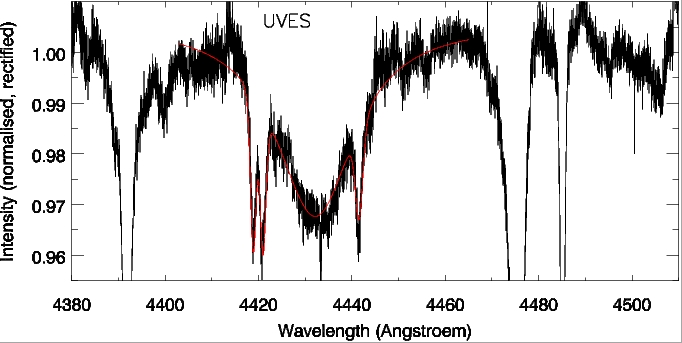
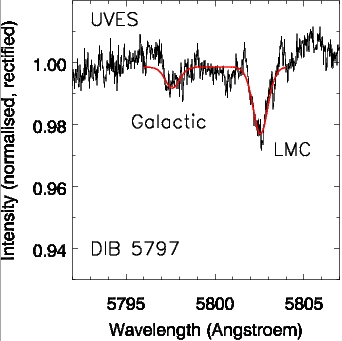
The UVES spectra were acquired at the same time as the ARGUS spectra. They have a significantly higher resolving power as well as wider spectral range, providing access to the 4428 Å DIB as well as two other strong DIBs at 5780 Å and 5797 Å, and the atomic doublet of Na i D at 5889.95 and 5895.92 Å. In total, 25 sightlines were analysed, all in the inner part of 30 Dor. All have also Medusa spectra except VFTS 416, 482, 545, 562 and 641 (VFTS 545 does have an ARGUS spectrum). VFTS 542 was observed with UVES as well as ARGUS and Medusa. The UVES spectra were treated in the same manner as the Medusa spectra. The r.m.s.(squared)-weighted average of those (normalised and rectified) spectra with reasonable fits (see Appendix) to the 4428 Å DIB is displayed in Fig. 1; with the 5780 and 5797 Å DIBs displayed in Fig. 2.
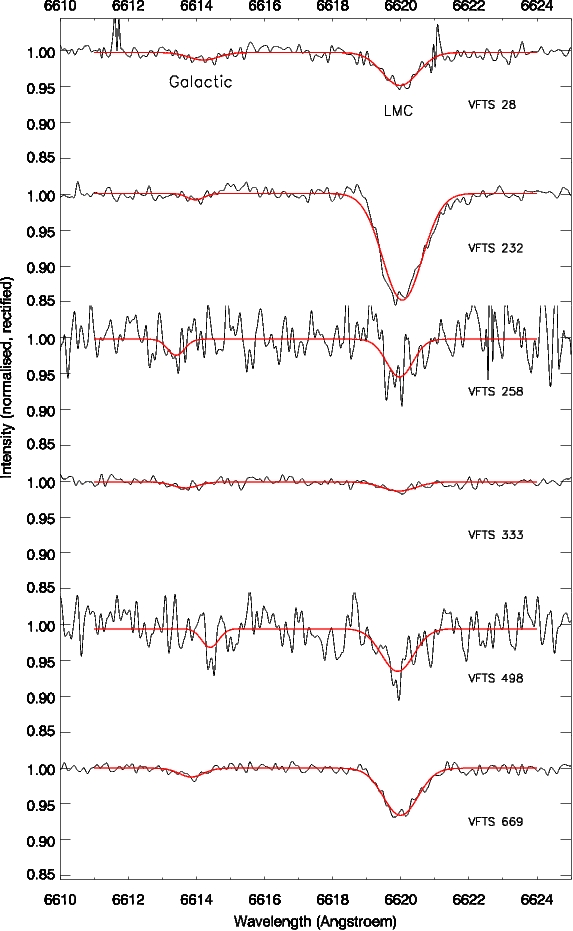
The first thing to notice is that the 4428 Å DIB absorption trough spans Å, far wider than the separation of the Galactic and LMC components ( Å), whilst the 6614 Å DIB is sufficiently narrow for the two components to be well resolved ( Å). The second thing to notice is that the LMC component is, at least on average for the 6614 Å DIB, almost four times stronger than the Galactic component. We also note that the 4428 Å DIB towards R 136 is stronger than what is typical across the wider region of the VFTS. Finally, the 4502 Å DIB (Herbig 1975) is clearly present in the LMC but its Galactic absorption is very weak (Fig. 1; see Section 4.1).
The strongest DIBs are detected in VFTS 232, at a peak depth of 11% and 15% of the continuum for the 4428 and 6614 Å DIBs, respectively (see Fig. A2). The runaway star VFTS 16 reported in Evans et al. (2010) was noted for its prominent 4428 Å DIB, but the DIBs in VFTS 16 are several times weaker than in VFTS 232 and in fact not atypical for the region in the Tarantula Nebula covered by the VFTS.
2.2 Sodium
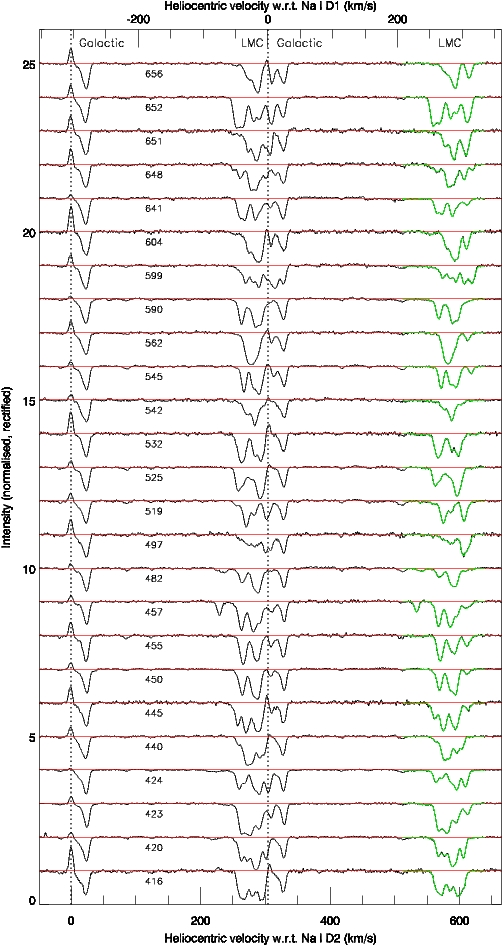
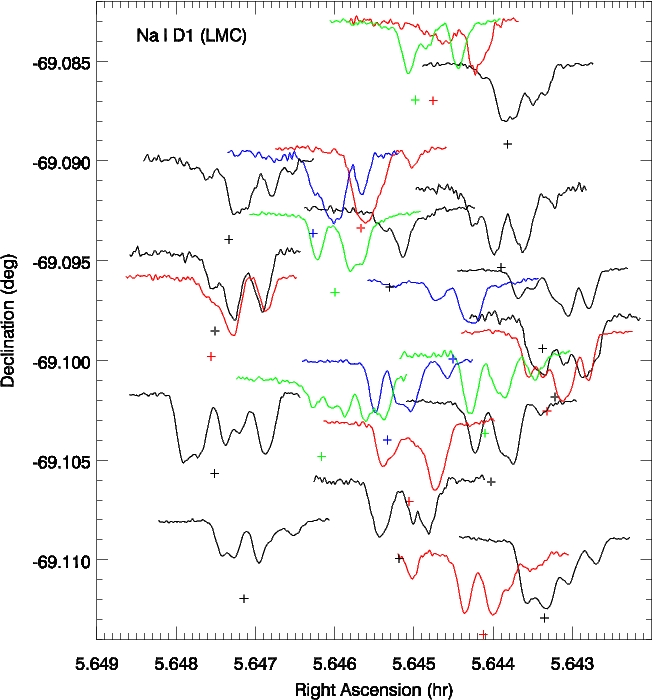
The Na i D doublet of neutral sodium atoms is superbly detected in all UVES spectra both for the Galactic and LMC component (Fig. 3). The D1 absorption from the LMC component (5900.3–5902.2 Å) is unaffected by other spectral features, as judged from the correspondence with the D2 absorption (5894.2–5896.1 Å), but the D2 absorption from the LMC component is not (always) completely separate from the D1 absorption from the Galactic component. The absorption from the Galactic component is generally affected (if sometimes only very slightly) by sharp telluric emission at the rest wavelength (which also affects the D2 absorption from the LMC component).
The Galactic absorption has one dominant component red-shifted by Å ( km s-1, i.e. comparable to the local standard of rest velocity in that direction of 15 km s-1) but also a (much) weaker component red-shifted by about half that amount. The latter shows clear signs of variations among the different sightlines. The LMC absorption has multiple components – five or more – spanning a heliocentric velocity range of about 230–320 km s-1; there are huge variations among the different sightlines. While interesting (see Sections 3.3 and 4.2), this clearly complicates the analysis of the DIBs, which are not resolved at this level of detail. We have attempted to quantify the kinematic components in the D1 line by simultaneously fitting seven Gaussians centred between 5900.3 and 5902.2 Å (Table 2; the combined fits are overplotted in Fig. 3). Seven was the minimum number of Gaussians needed to satisfactorily identify all the components that can be readily recognised by visual inspection, for every spectrum; in most cases one or more of these Gaussian components were found to be insignificant, and we have omitted from Table 2 those fitted components with a peak depth below one per cent of the continuum.
The analysis of the Na i D absorption is complicated as the strongest components are saturated: the oscillator strengths of the D1 and D2 transitions compare as 1:2 but the observed ratio in our spectra is much closer to unity.
| VFTS | 1 | 2 | 3 | 4 | 5 | 6 | 7 | ||||||||||||||
|---|---|---|---|---|---|---|---|---|---|---|---|---|---|---|---|---|---|---|---|---|---|
| FWHM | FWHM | FWHM | FWHM | FWHM | FWHM | FWHM | |||||||||||||||
| 416 | 259 | 8 | .41 | 268 | 11 | .70 | 280 | 8 | .48 | 294 | 15 | .77 | 303 | 5 | .21 | ||||||
| 420 | 262 | 6 | .32 | 272 | 18 | .52 | 283 | 7 | .46 | 289 | 9 | .70 | 301 | 8 | .60 | 313 | 5 | .01 | |||
| 423 | 245 | 15 | .04 | 262 | 9 | .65 | 273 | 13 | .76 | 279 | 8 | .34 | 290 | 12 | .56 | 306 | 10 | .25 | 310 | 6 | .11 |
| 424 | 259 | 9 | .35 | 269 | 7 | .22 | 283 | 10 | .36 | 292 | 8 | .53 | 304 | 9 | .49 | ||||||
| 440 | 259 | 10 | .15 | 272 | 10 | .68 | 280 | 8 | .55 | 291 | 10 | .49 | 300 | 7 | .31 | 311 | 5 | .02 | |||
| 445 | 232 | 5 | .02 | 258 | 11 | .46 | 268 | 6 | .38 | 273 | 9 | .69 | 283 | 5 | .15 | 289 | 13 | .78 | 308 | 8 | .20 |
| 450 | 243 | 8 | .01 | 255 | 6 | .07 | 265 | 9 | .64 | 281 | 10 | .61 | 290 | 8 | .67 | 307 | 8 | .15 | |||
| 455 | 232 | 18 | .02 | 266 | 10 | .77 | 281 | 7 | .30 | 288 | 10 | .51 | 307 | 10 | .31 | ||||||
| 457 | 229 | 7 | .31 | 263 | 10 | .74 | 253 | 5 | .05 | 281 | 13 | .77 | 292 | 7 | .31 | 306 | 14 | .20 | |||
| 482 | 237 | 11 | .07 | 251 | 5 | .02 | 265 | 12 | .25 | 282 | 9 | .42 | 290 | 9 | .46 | 304 | 10 | .07 | 315 | 5 | .03 |
| 497 | 239 | 5 | .04 | 254 | 5 | .08 | 272 | 14 | .15 | 280 | 5 | .06 | 285 | 12 | .23 | 301 | 9 | .60 | 309 | 8 | .35 |
| 519 | 235 | 5 | .03 | 256 | 10 | .07 | 271 | 10 | .63 | 282 | 8 | .31 | 290 | 5 | .03 | 301 | 8 | .43 | 305 | 10 | .22 |
| 525 | 243 | 13 | .02 | 257 | 7 | .35 | 263 | 11 | .40 | 282 | 18 | .30 | 291 | 9 | .65 | 298 | 8 | .37 | 313 | 7 | .03 |
| 532 | 238 | 18 | .03 | 259 | 8 | .18 | 264 | 13 | .64 | 283 | 8 | .47 | 303 | 5 | .08 | 294 | 10 | .66 | 317 | 9 | .02 |
| 542 | 257 | 18 | .04 | 270 | 9 | .22 | 284 | 5 | .12 | 283 | 12 | .49 | 298 | 9 | .11 | 313 | 5 | .02 | |||
| 545 | 254 | 5 | .03 | 267 | 8 | .65 | 281 | 7 | .41 | 290 | 12 | .61 | 313 | 7 | .21 | ||||||
| 562 | 253 | 5 | .05 | 274 | 12 | .82 | 283 | 9 | .55 | 290 | 7 | .32 | 297 | 5 | .03 | 308 | 9 | .22 | |||
| 590 | 267 | 18 | .16 | 263 | 8 | .43 | 285 | 11 | .68 | 293 | 7 | .44 | 301 | 14 | .11 | ||||||
| 599 | 248 | 5 | .03 | 266 | 18 | .10 | 270 | 7 | .26 | 281 | 10 | .35 | 290 | 7 | .42 | 303 | 10 | .52 | 315 | 9 | .51 |
| 604 | 251 | 13 | .08 | 276 | 11 | .44 | 286 | 10 | .76 | 293 | 8 | .55 | 306 | 8 | .51 | ||||||
| 641 | 223 | 18 | .02 | 260 | 8 | .40 | 269 | 9 | .44 | 284 | 6 | .28 | 288 | 16 | .29 | 299 | 5 | .01 | 307 | 9 | .18 |
| 648 | 261 | 17 | .20 | 277 | 7 | .38 | 285 | 14 | .60 | 303 | 8 | .44 | 315 | 7 | .17 | ||||||
| 651 | 232 | 8 | .04 | 254 | 13 | .06 | 273 | 7 | .23 | 278 | 18 | .30 | 287 | 10 | .70 | 307 | 9 | .51 | 302 | 11 | .34 |
| 652 | 254 | 9 | .76 | 265 | 12 | .77 | 281 | 8 | .59 | 291 | 11 | .47 | 306 | 10 | .73 | 313 | 6 | .28 | |||
| 656 | 239 | 5 | .02 | 254 | 7 | .04 | 276 | 15 | .30 | 286 | 10 | .49 | 291 | 7 | .39 | 310 | 9 | .44 | |||
We resolved to measure the equivalent width by integration of the spectrum (i.e. not by fitting analytical functions), of the D1 line of the LMC component and of the D2 line of the Galactic component (just avoiding the telluric emission). As these appear to reach similar maximum depth they will also be affected to a similar degree by saturation effects.
3 Analysis
3.1 Maps of interstellar absorption
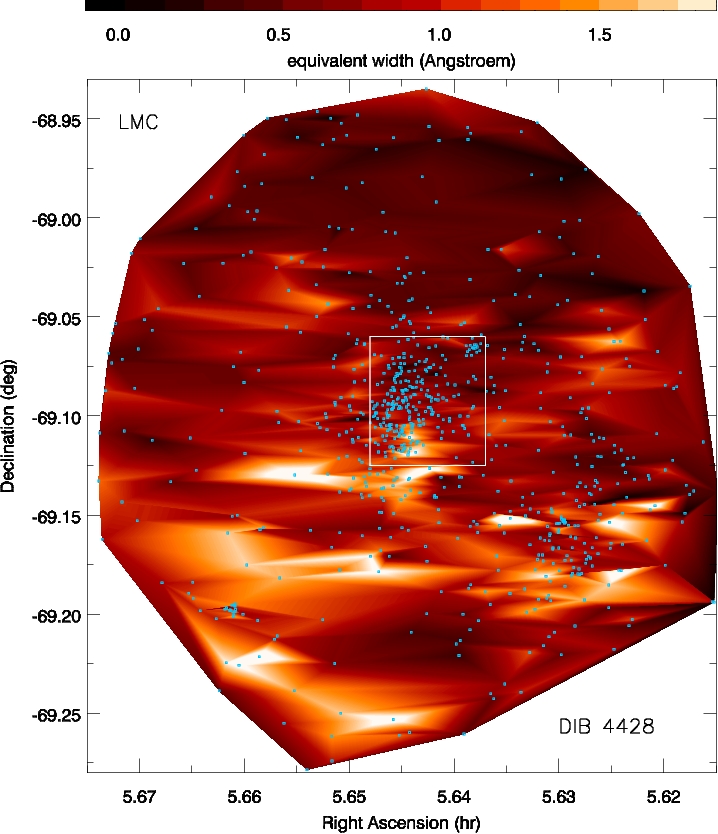
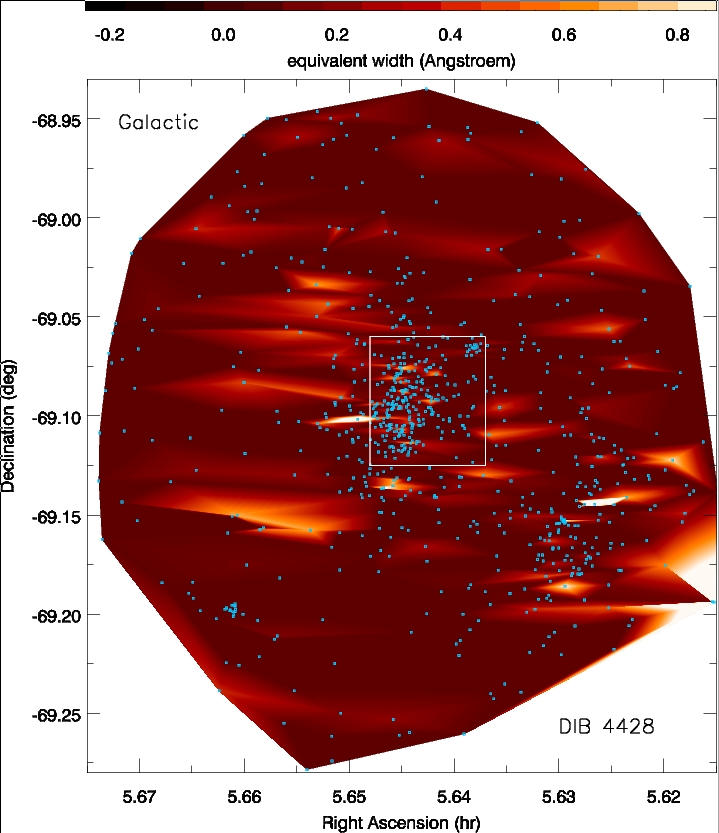
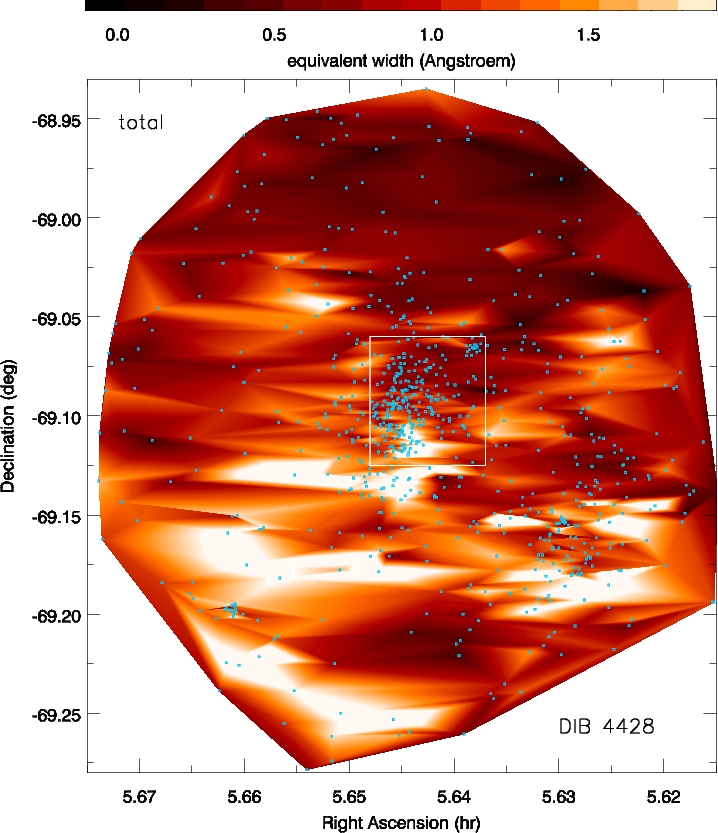
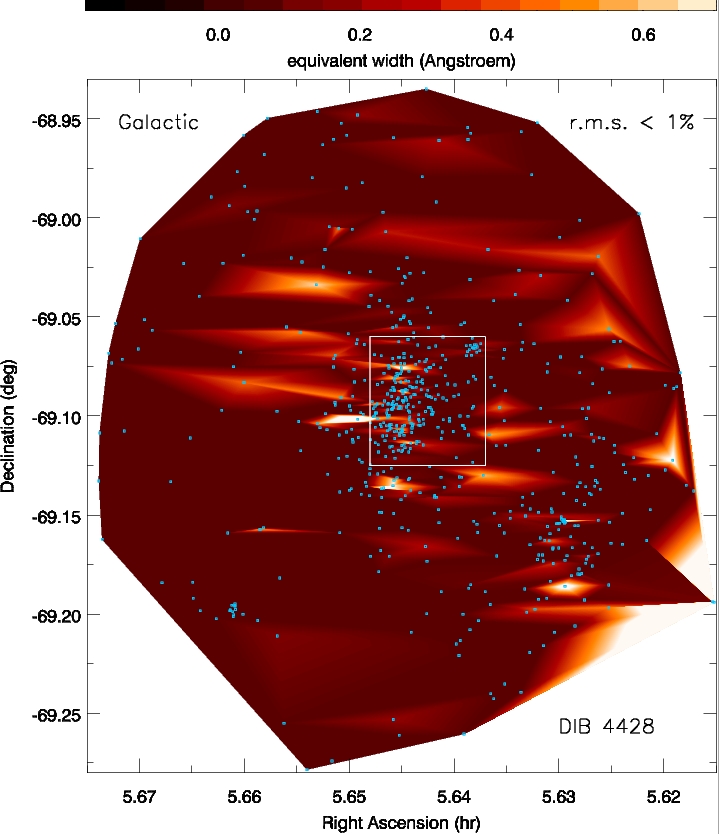
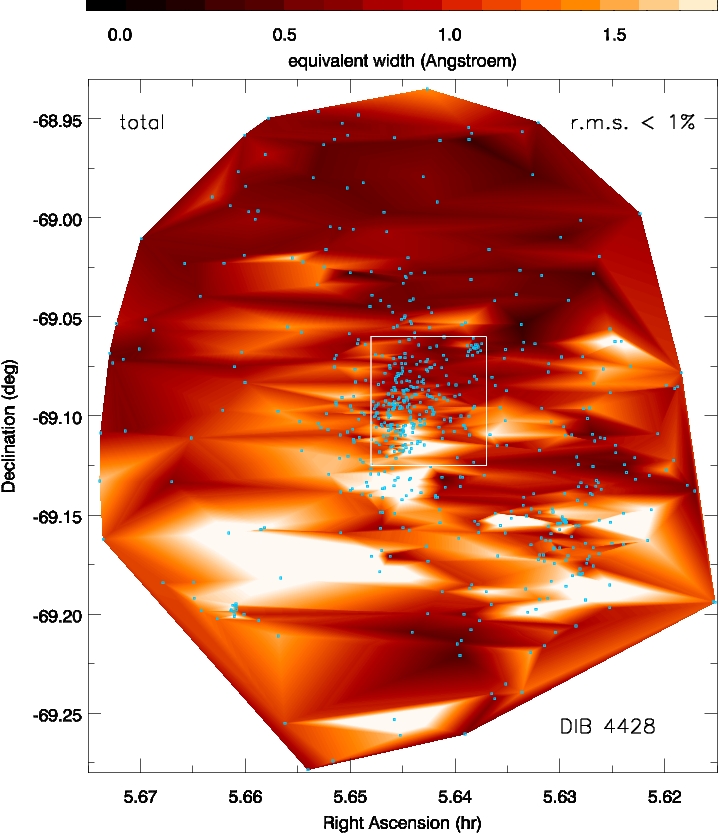
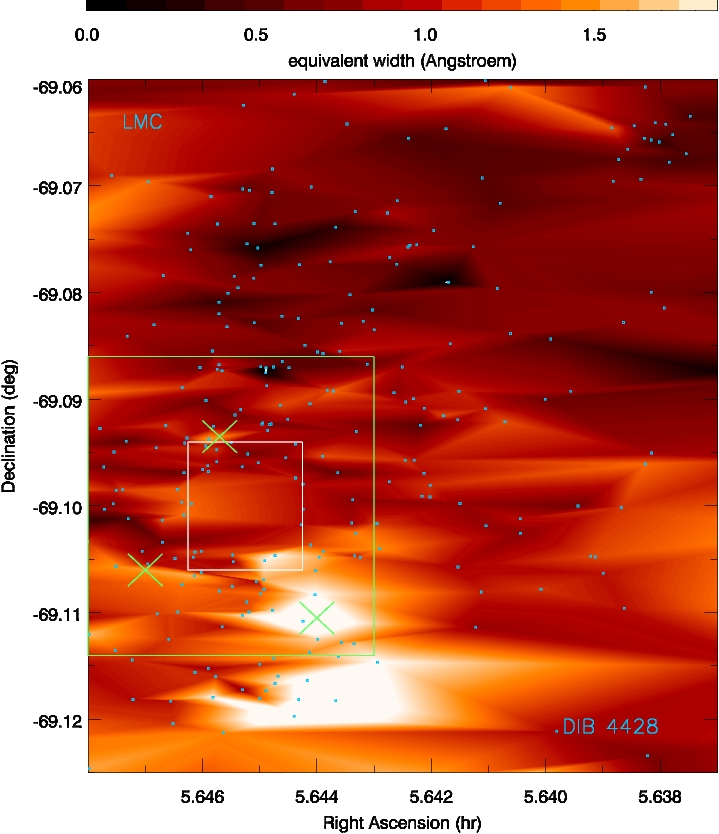
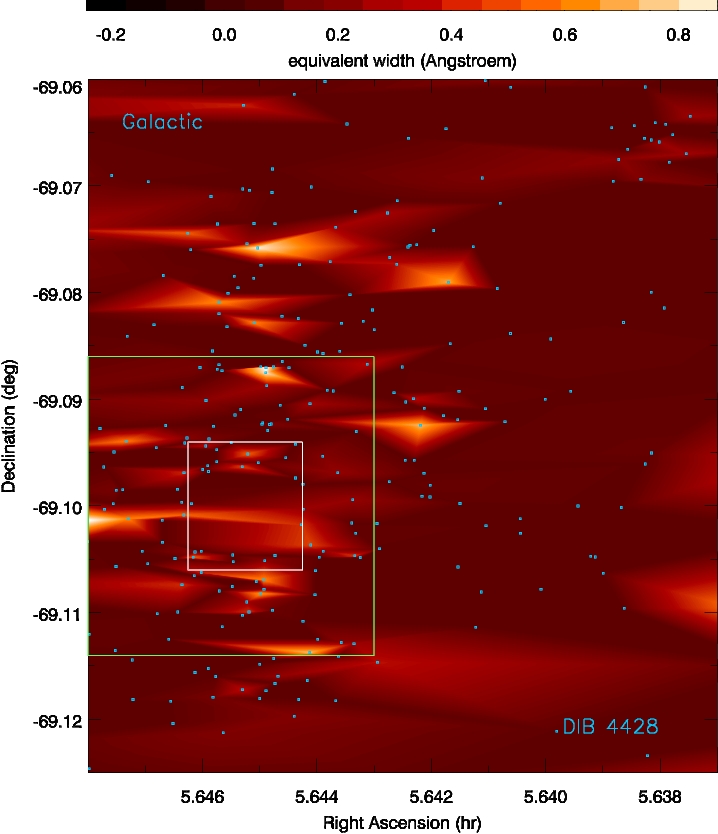
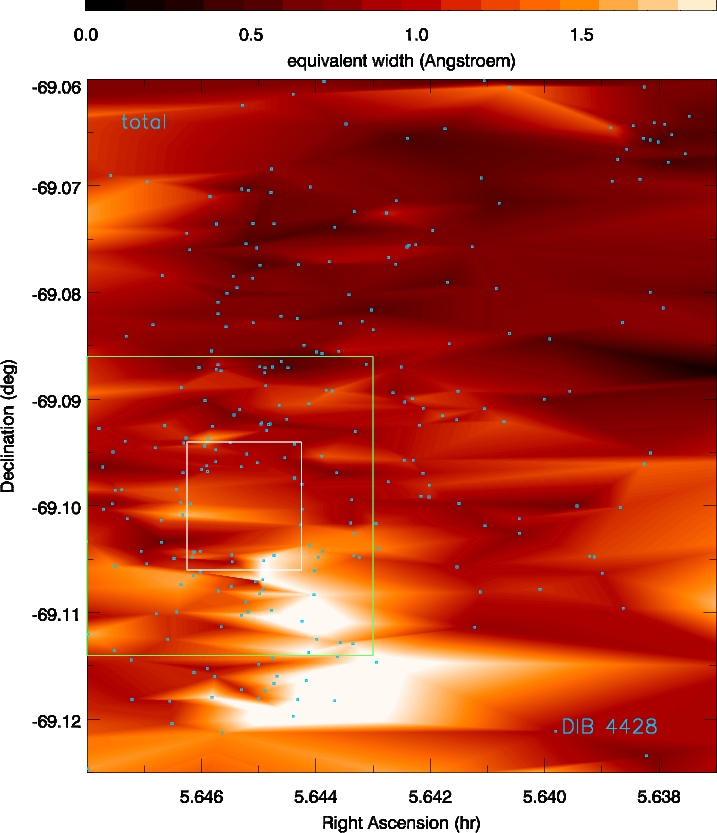
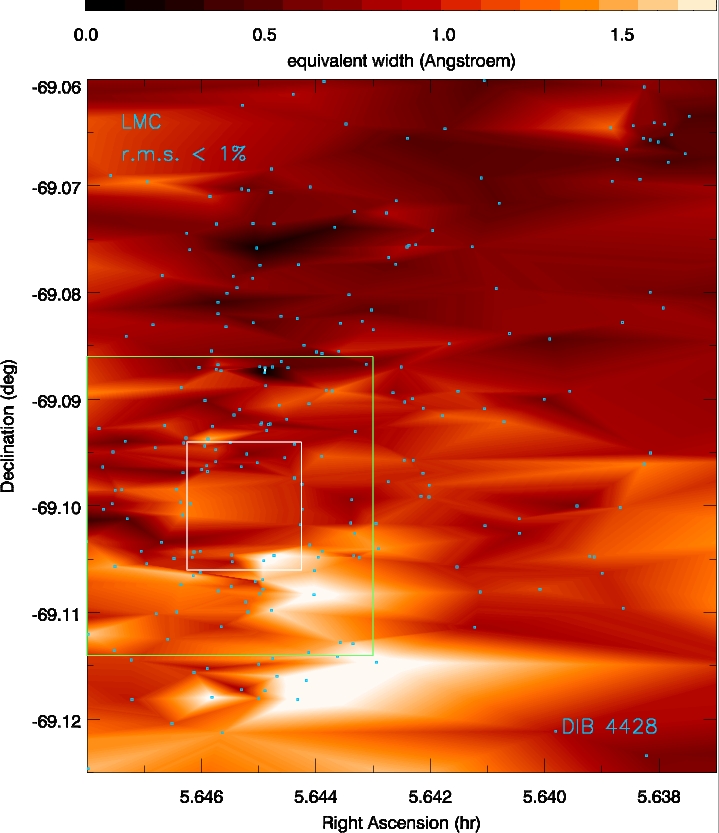
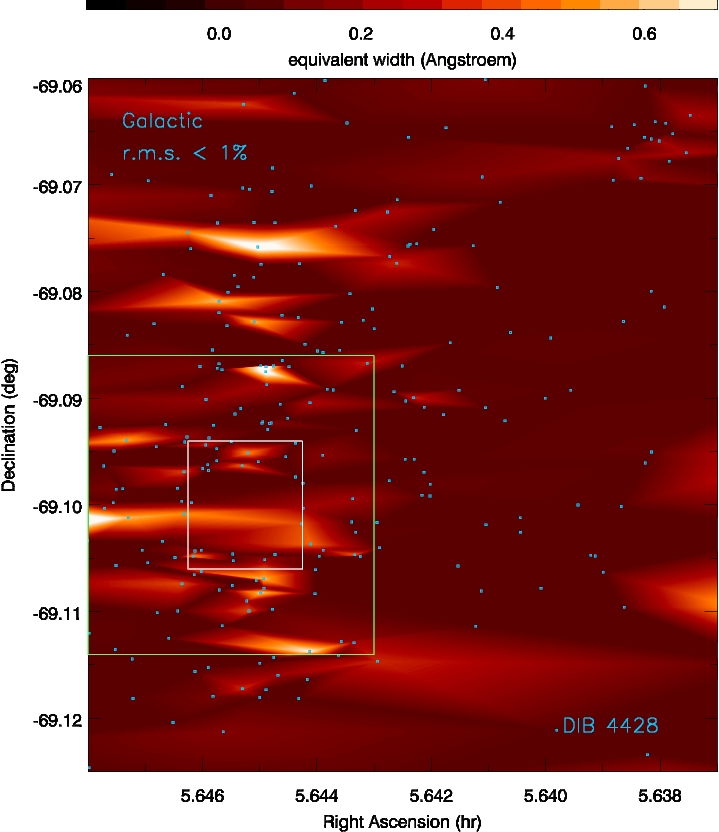
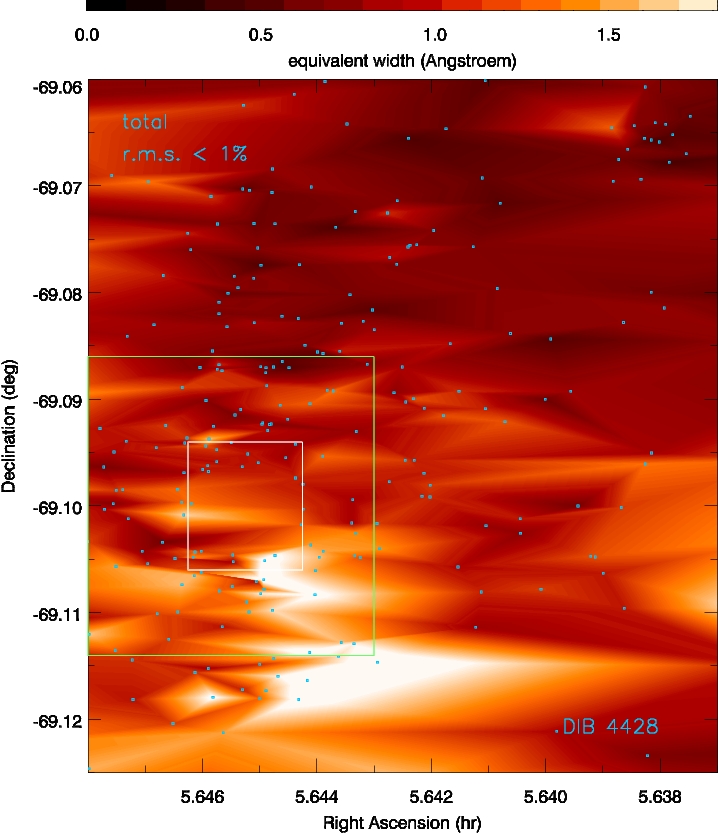
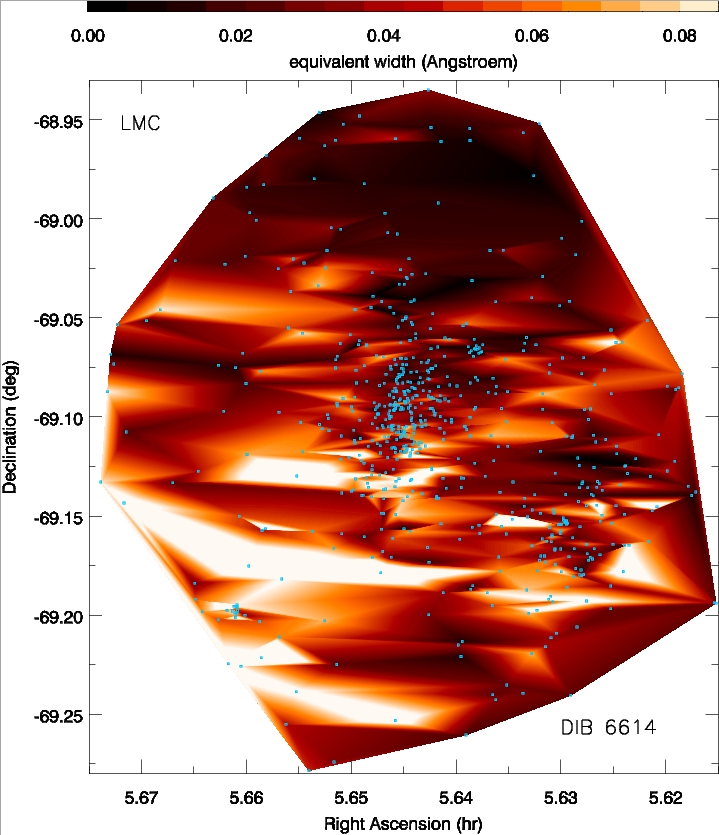
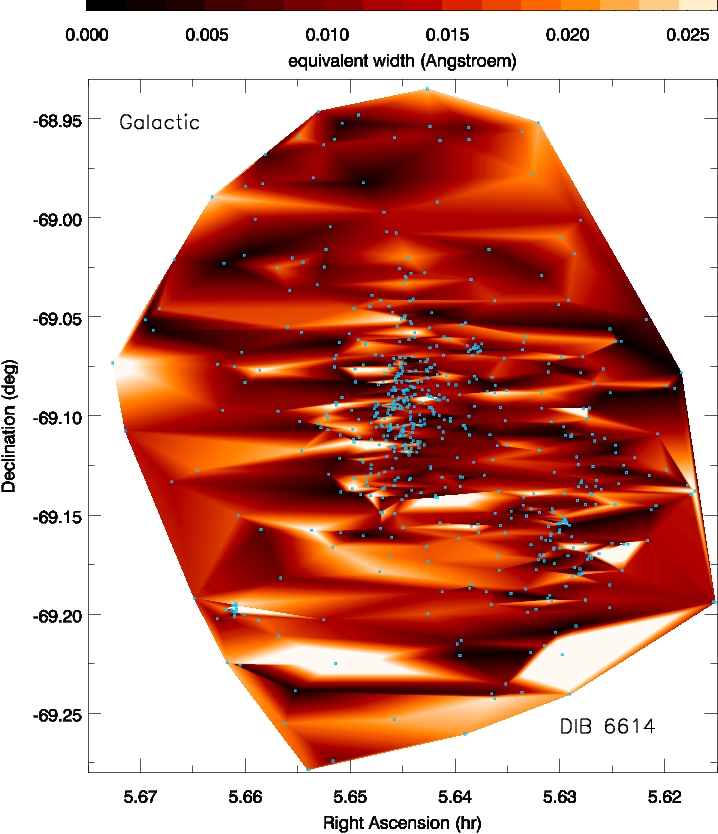
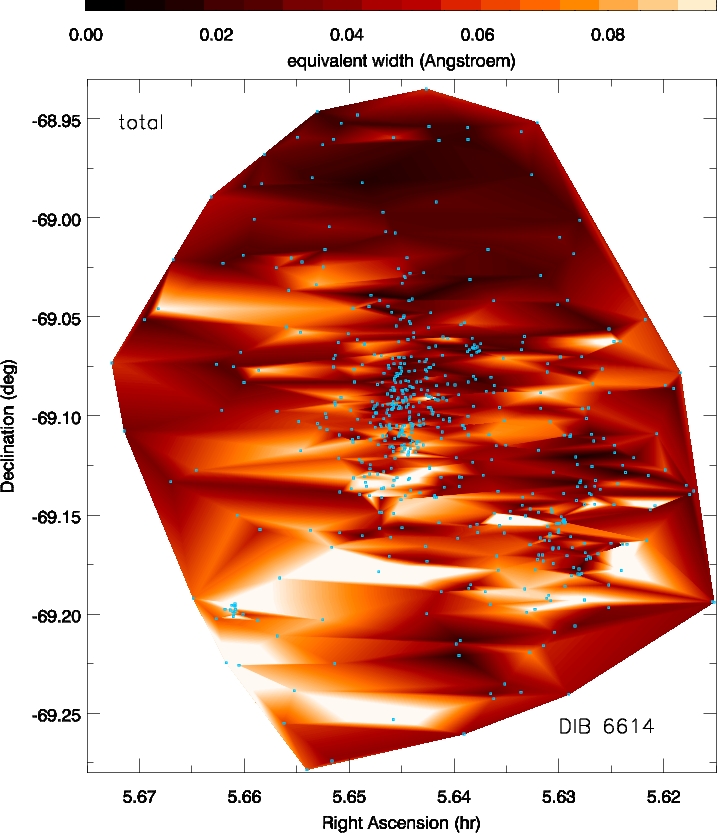
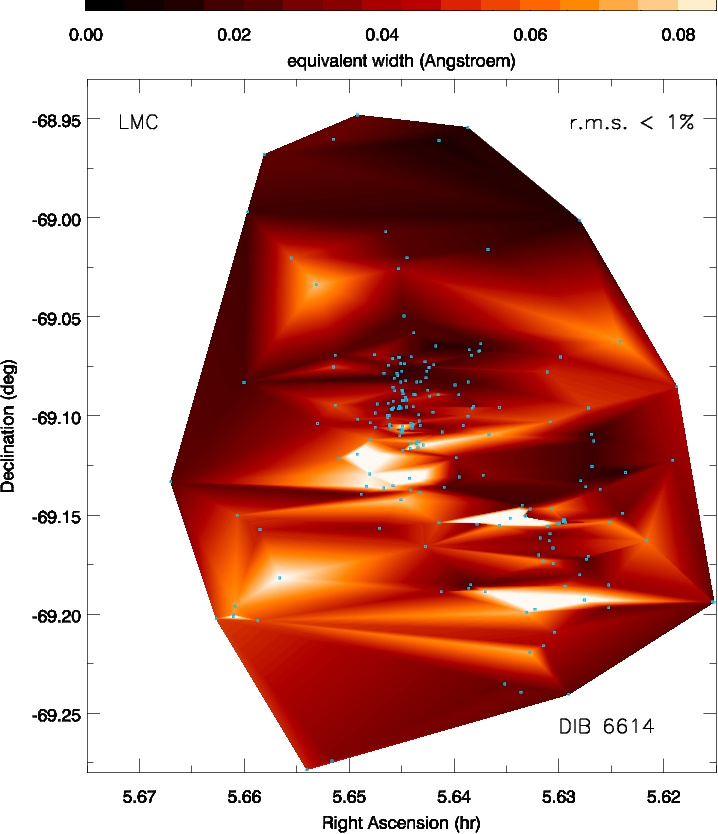
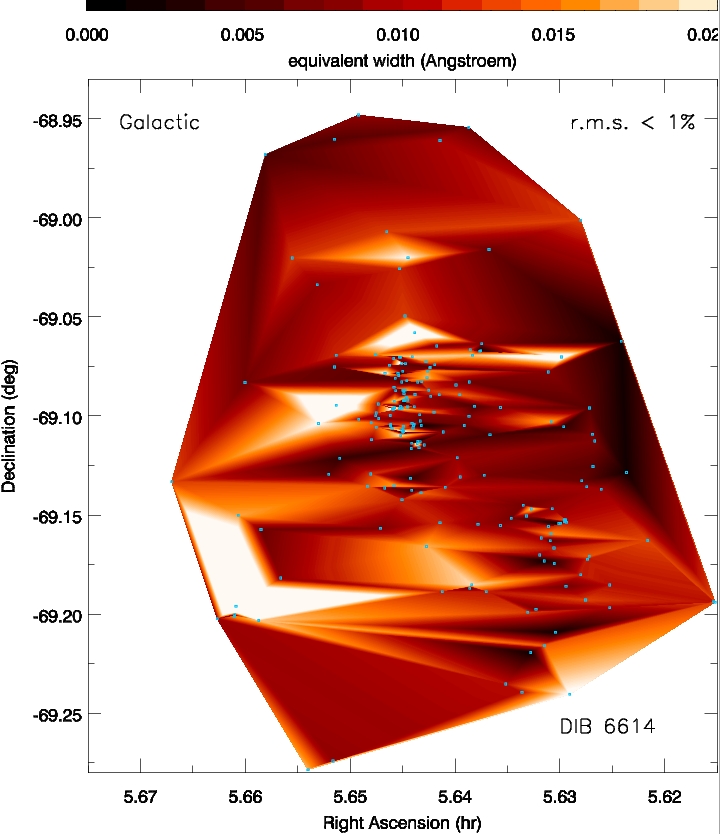
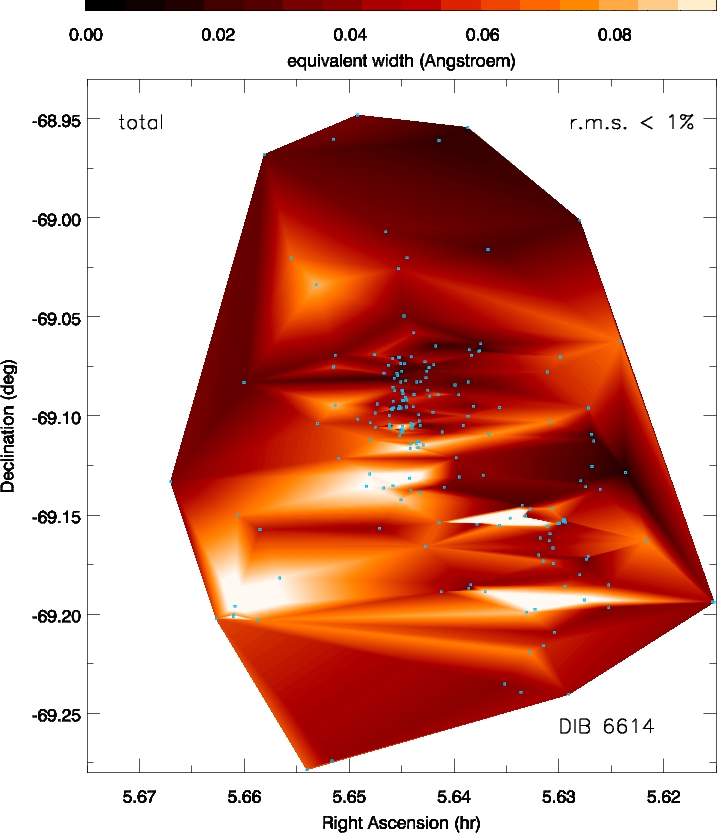
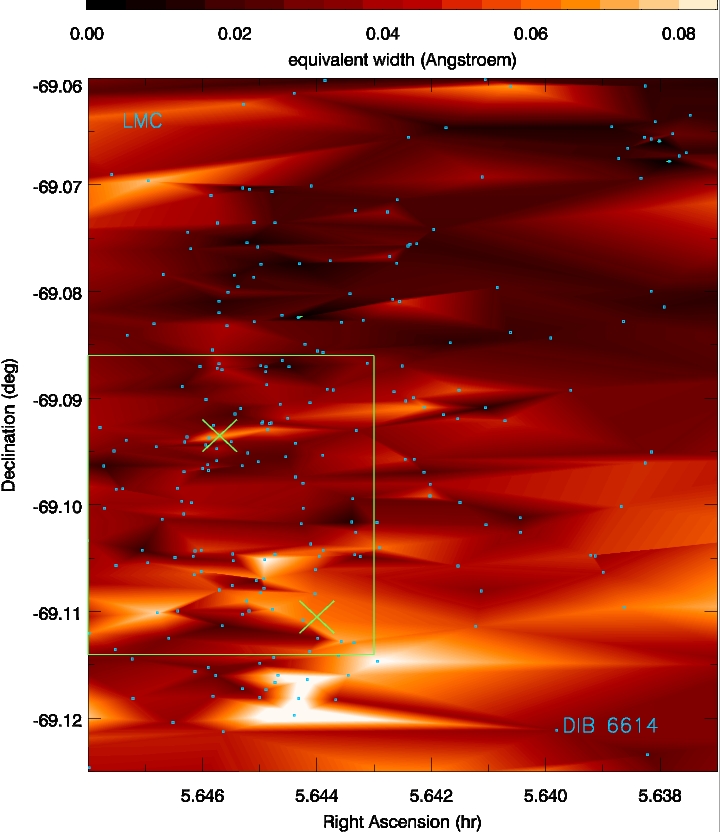
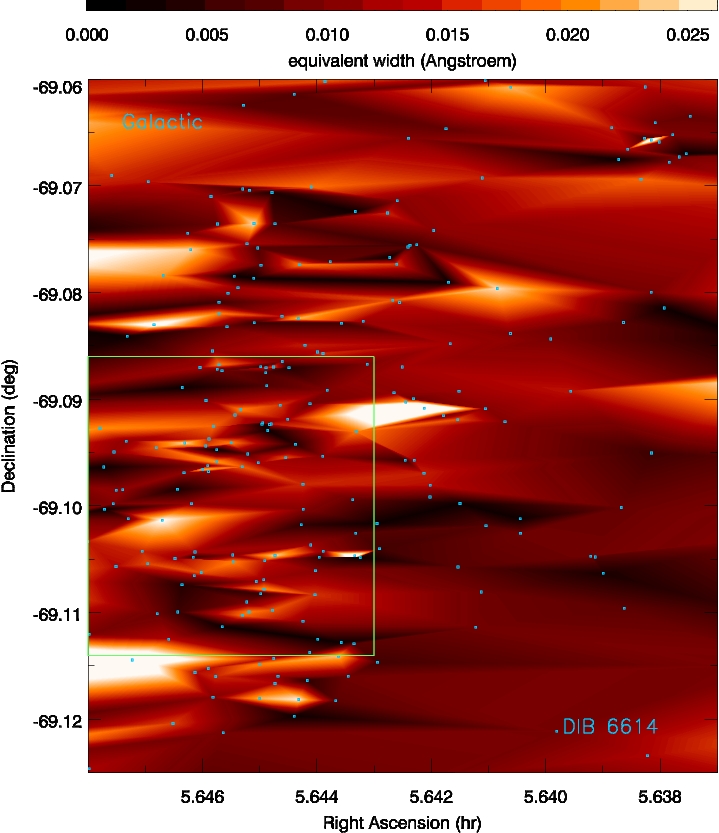
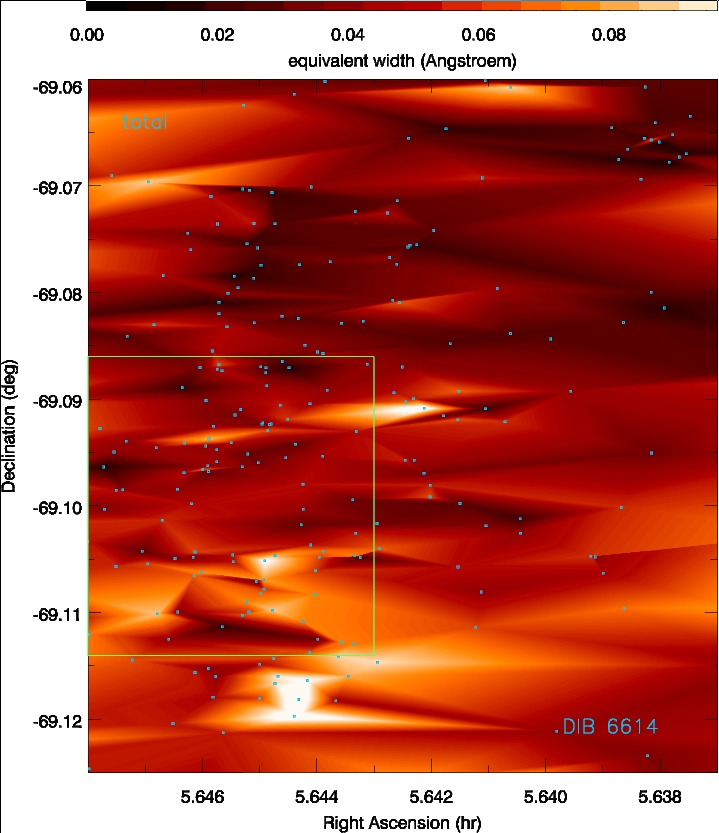
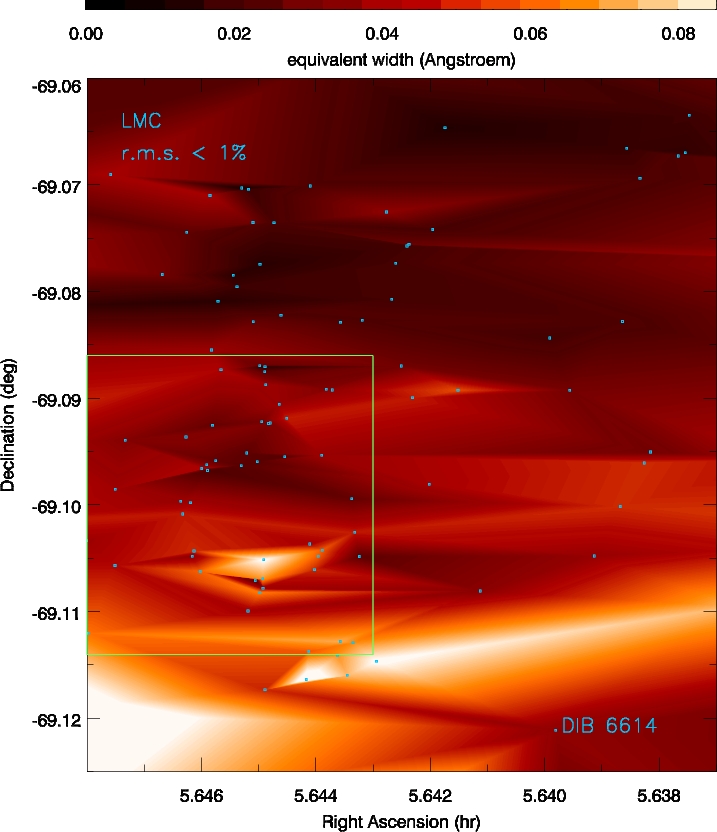
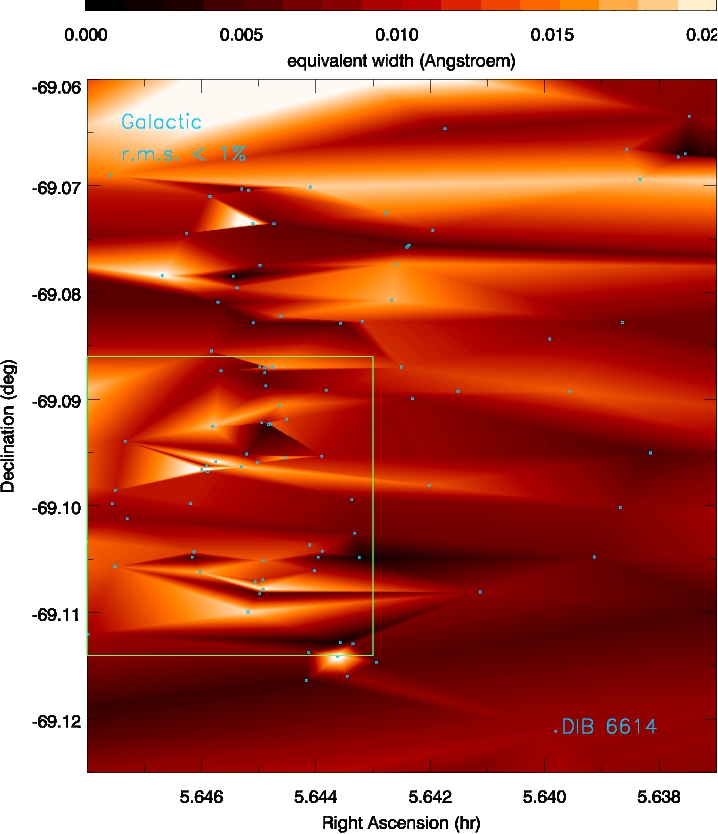
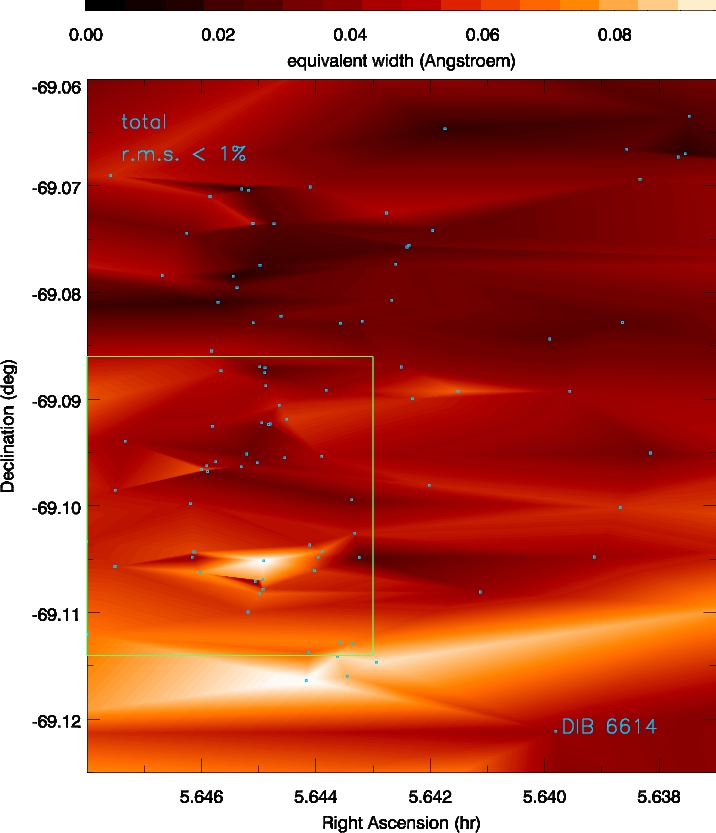
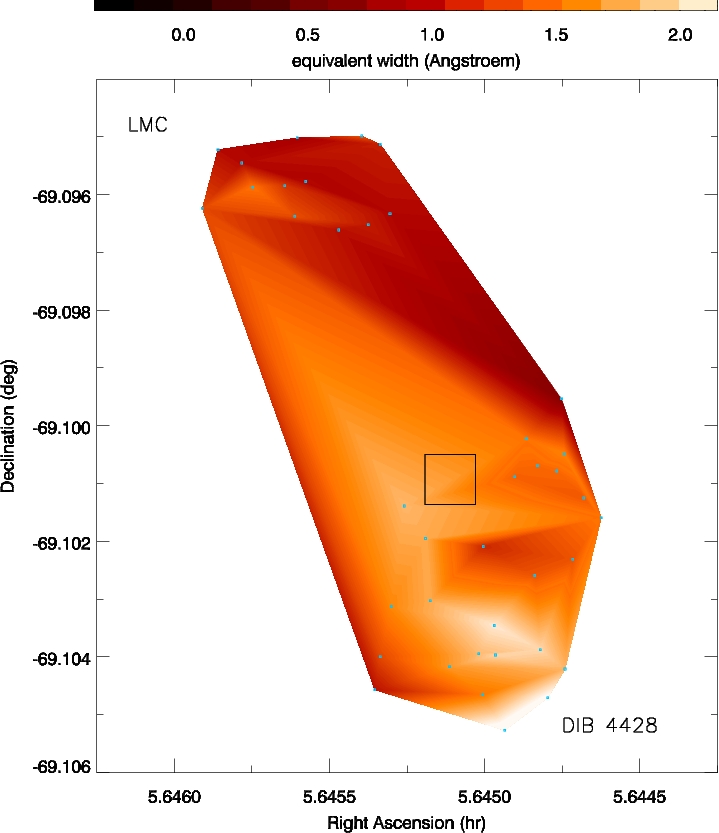
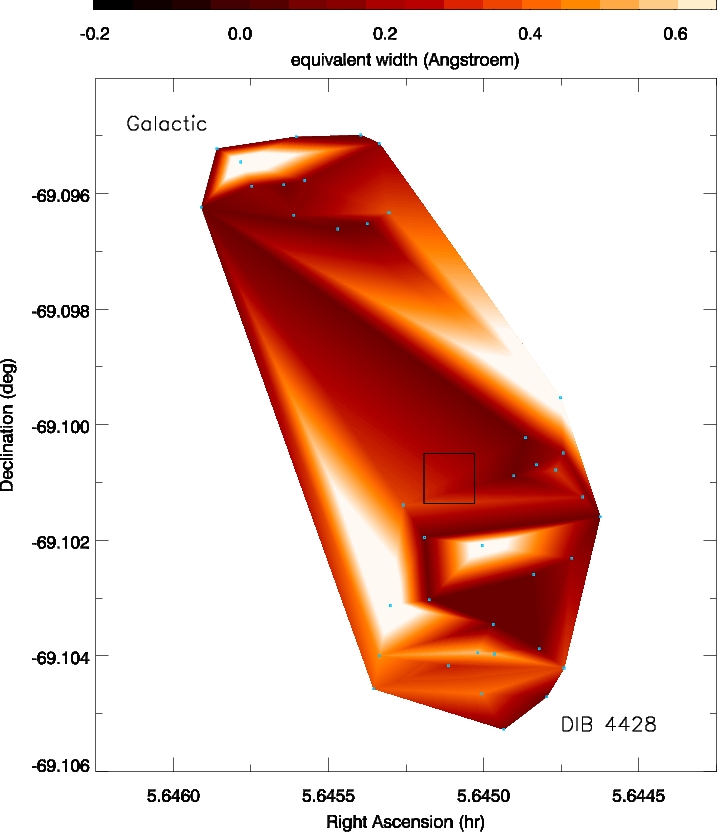
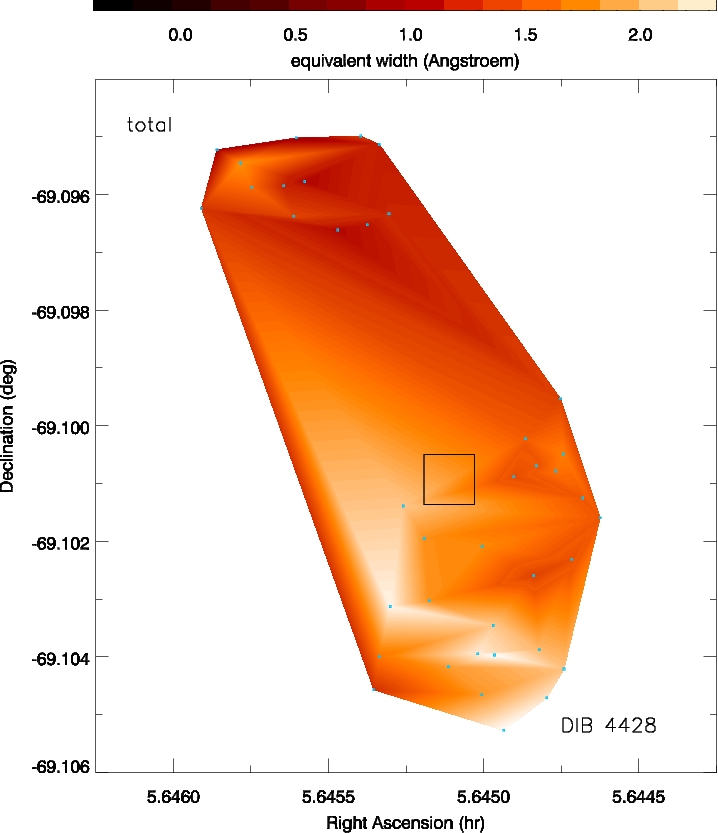

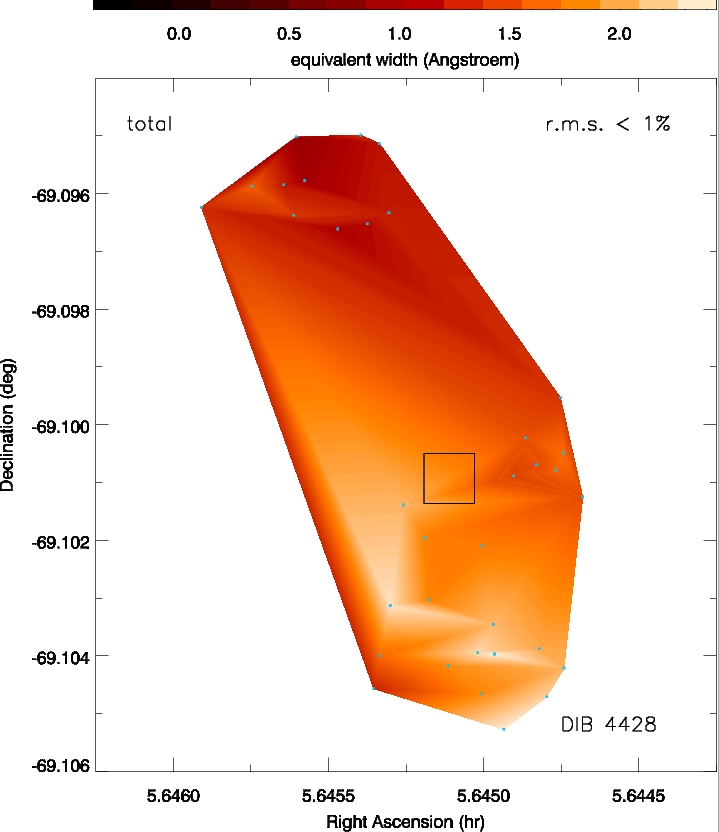
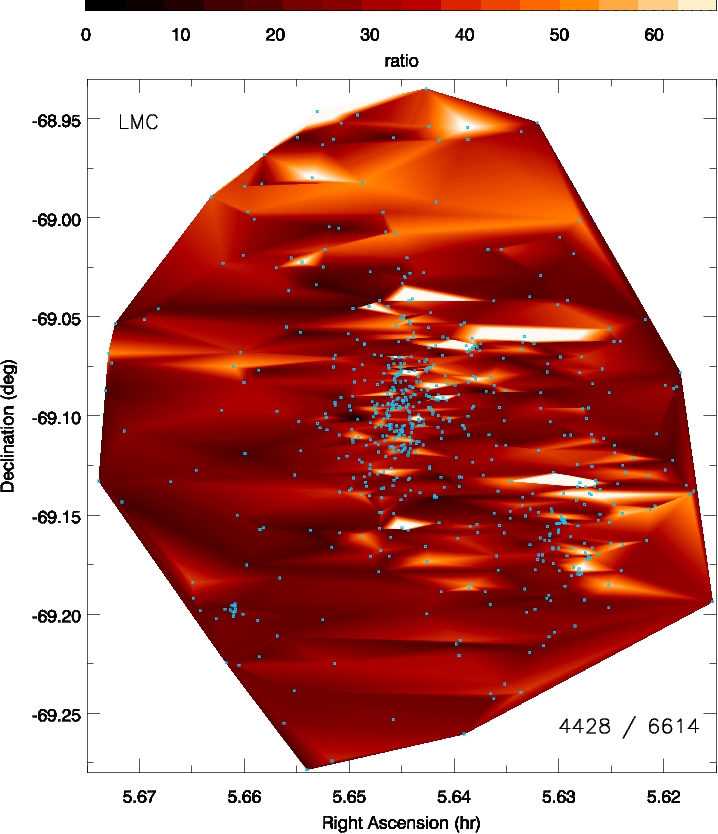
Maps of the 4428 Å and 6614 Å DIB equivalent width are presented in Figs. 4 and 6 for the region covered by the Medusa spectra, in Figs. 5 and 7 zoomed in on the central region where the sampling is densest, and in Fig. 8 (ARGUS spectra, 4428 Å only) for the region immediately surrounding the R 136 cluster as well as the cluster core itself. The maps are presented for the LMC and Galactic components separately as well as jointly; we remind the reader that the 6614 Å DIB is separated completely but the 4428 Å DIB is a blend.
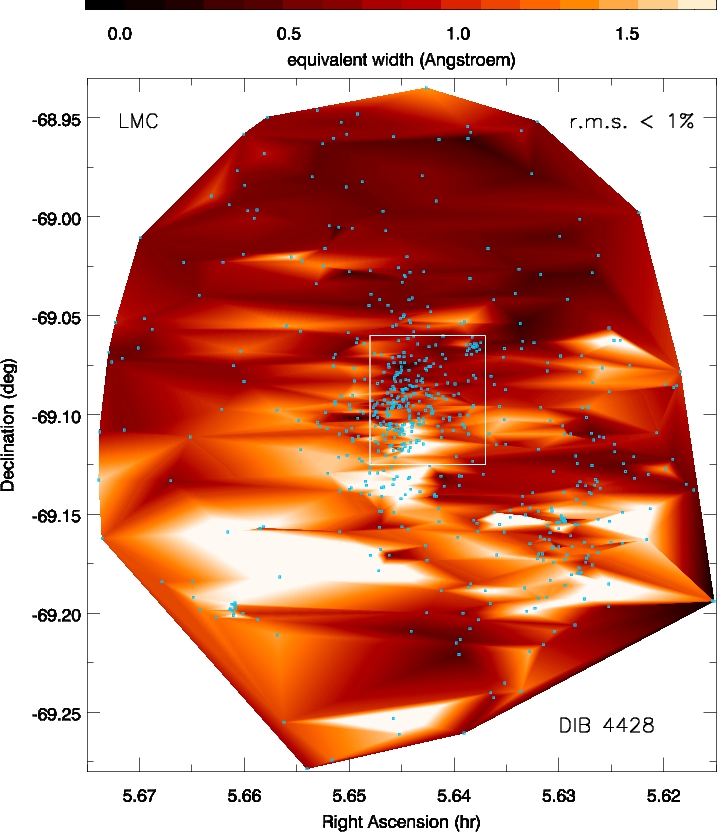
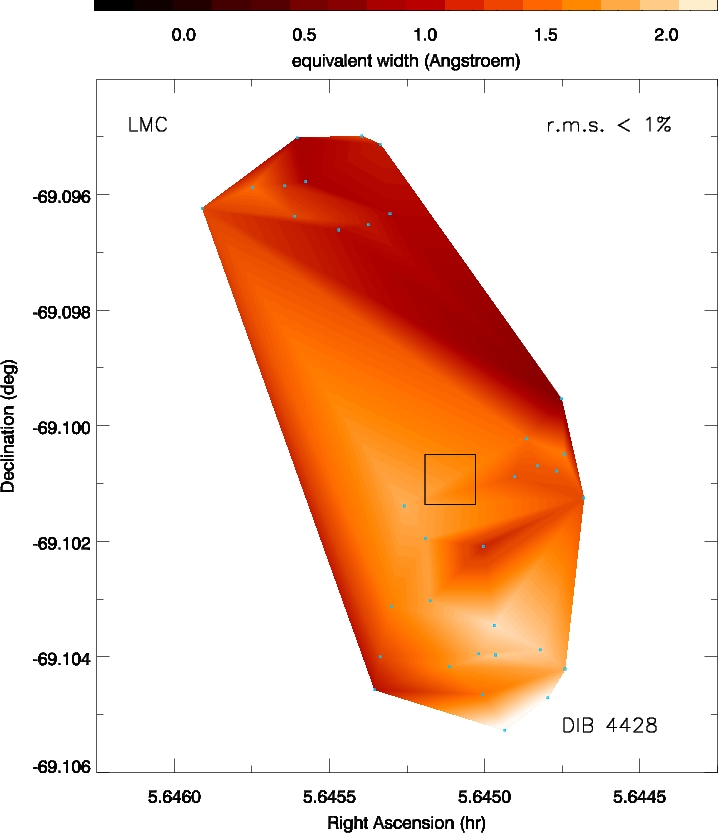
The two challenges inherent to presenting such maps are (i) the sparse and non-uniform sampling and (ii) the difficulty of distinguishing small-scale structure from noise fluctuations. The latter can be appreciated by presenting maps using all reasonable fits to the spectral features and those making use exclusively of the spectra with r.m.s. %. Because the latter are based on fewer sightlines the differences between the maps also give an impression of the way the sparsity and non-uniformity of the sampling affect the maps. The maps with only r.m.s. % spectra miss some of the structures present in the complete maps, but the reality of those structures is less certain; there is not much one can do about that. On the other hand, because of the sparse sampling and the “filling up” of the maps, structures in the r.m.s. % maps may seem exacerbated in their extent. On balance, the 4428 Å and 6614 Å DIB maps of the LMC component show more similarity when accepting all reasonable fits than when limiting oneself to the r.m.s. % fits, because of the lack of commonality in sightlines. Intriguingly, this in itself would suggest that real structure is presented at scales below the sampling of the “all-inclusive” maps, i.e. at several pc.
The LMC and Galactic maps look totally different. This is to be expected, as there is no physical connection between these two disparate regions in the universe. However, the discerning eye may notice a certain level of anti-correlation between the strongest features in the Galactic maps of the 4428 Å DIB and rather weak features at the corresponding positions in the LMC maps – a consequence of the difficulty of disentangling the two components in this broad DIB. This does not necessarily mean that the Galactic feature is unreliable, though its strength must be taken with caution. A corresponding structure in the 6614 Å DIB would lend credit to its reality.
3.2 Correlation between DIBs
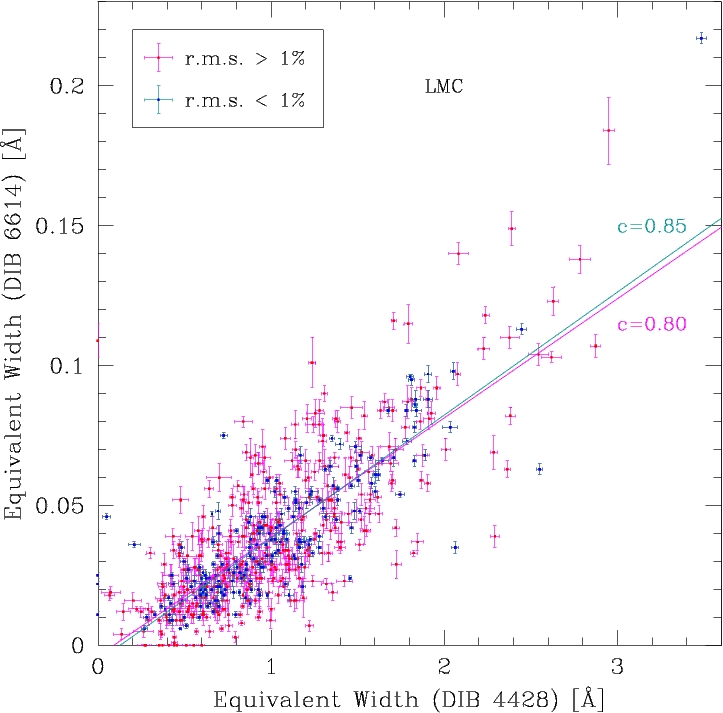
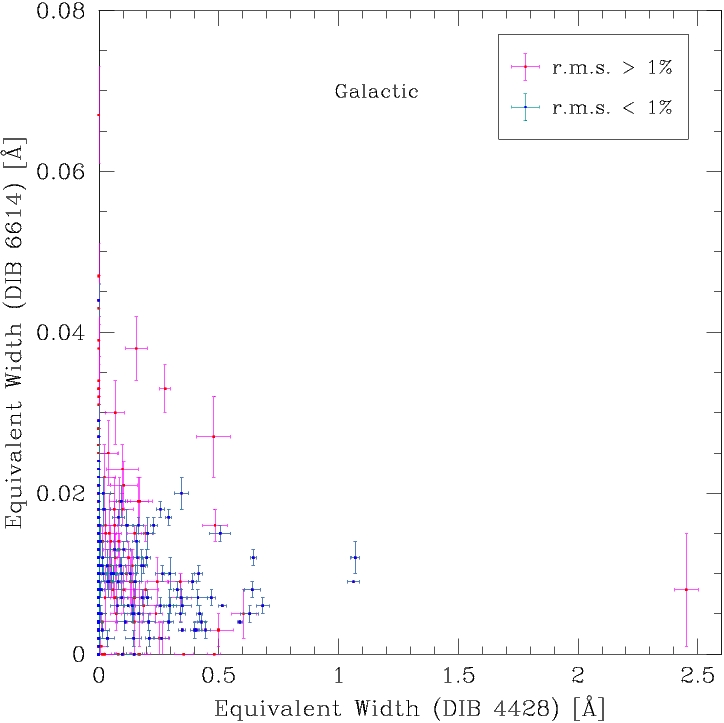
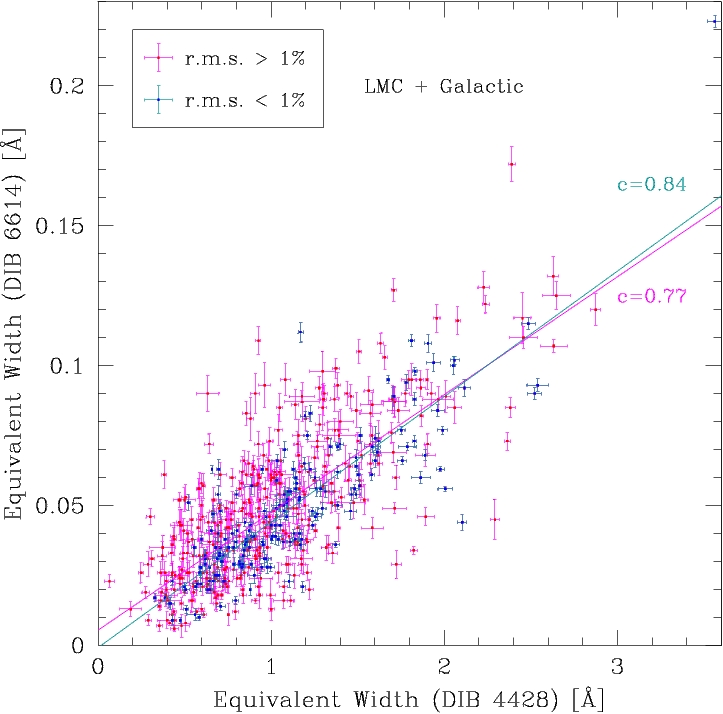
As noted in the maps, the equivalent widths of the 4428 Å and 6614 Å DIBs are correlated. This is very clear for the LMC component (Fig. 9, left, correlation coefficient ) though not so for the Galactic component (Fig. 9, middle, correlation coefficient ).
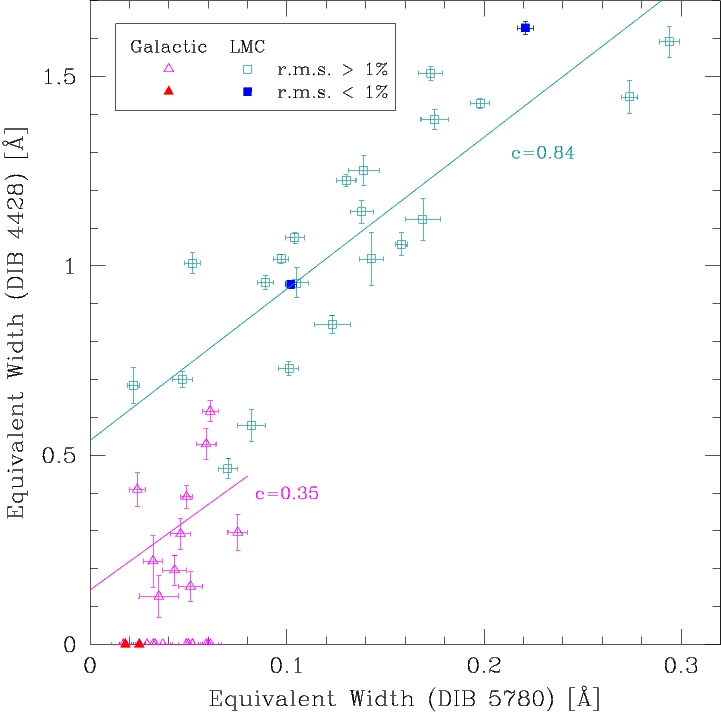
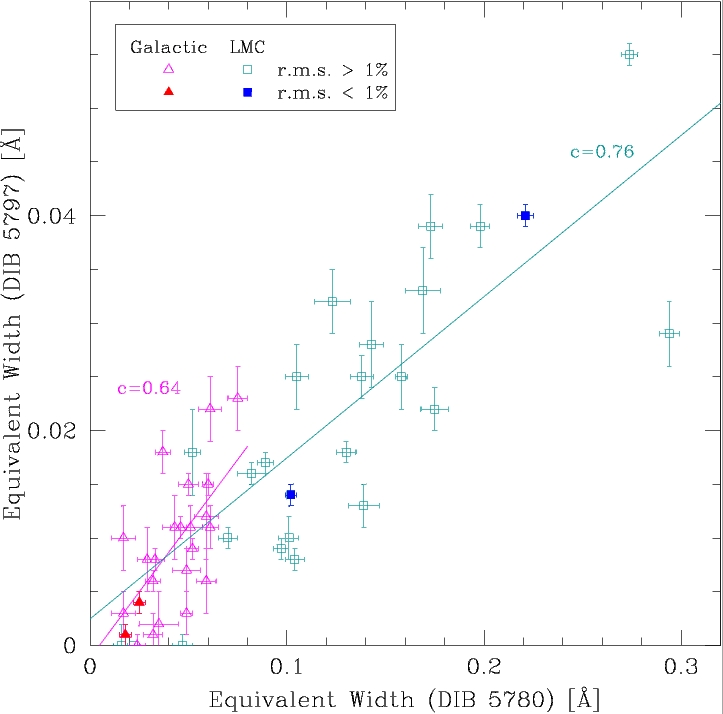
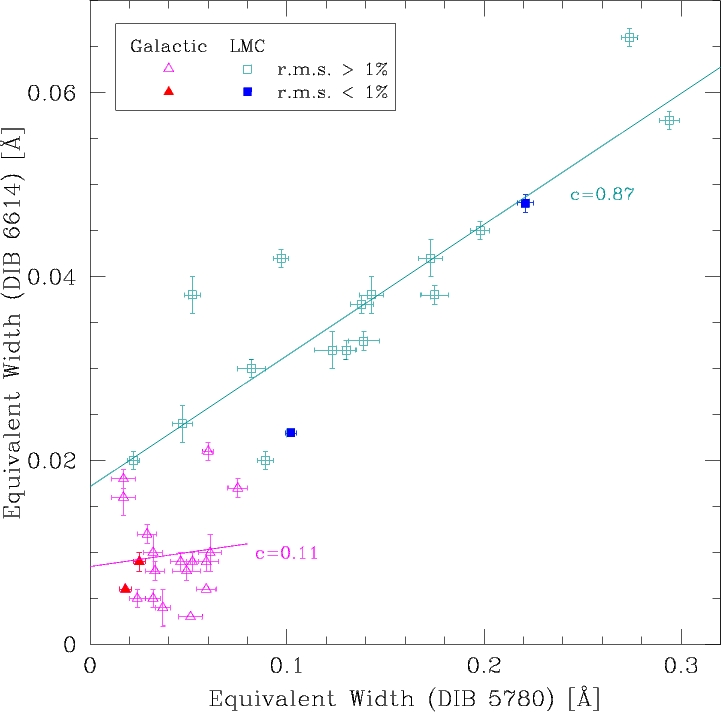
The equivalent width of the 4428 Å DIB is also correlated with that of the 5780 Å DIB (Fig. 10, left), but not perfectly. In the LMC, the 4428 Å DIB is already obvious when the 5780 Å DIB is still weak, implying the carrier of the former is more abundant and suggesting its carrier may already – or still – be present when the carrier of the latter is not. One can also notice that – at least in the weak 5780 Å DIB regime – the 4428 Å DIB is a lot stronger in the LMC than in the Milky Way, which means that either the carrier of the 4428 Å DIB is relatively abundant in the LMC or the carrier of the 5780 Å DIB is depleted in the LMC (or both). These conclusions might be affected by the difficulty in separating the LMC and Galactic components in the broad 4428 Å DIB. However, they are corroborated by the behaviour of the 6614 Å DIB where no such blending occurs (Fig. 10, right); the inferences with regard to the carrier of the 4428 Å DIB may therefore also hold for the carrier of the 6614 Å DIB. The equivalent width of the 5797 Å DIB is rather well correlated with that of the 5780 Å DIB (Fig. 10, middle).
The growth of the equivalent width of the 4428 Å DIB appears to slow down as the equivalent width of the 5780 Å DIB grows. This might be understood if the ISM becomes depleted of the building blocks that make up the carrier of the 4428 Å DIB, or if the carrier of the 4428 Å DIB itself is being depleted in regions where the 5780 Å DIB is particularly strong.
3.3 Correlation between DIBs and atomic gas
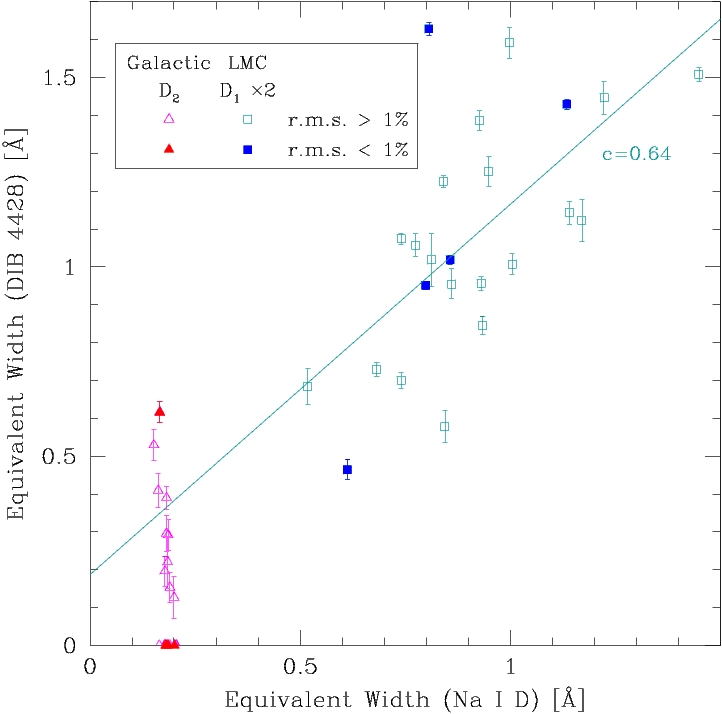
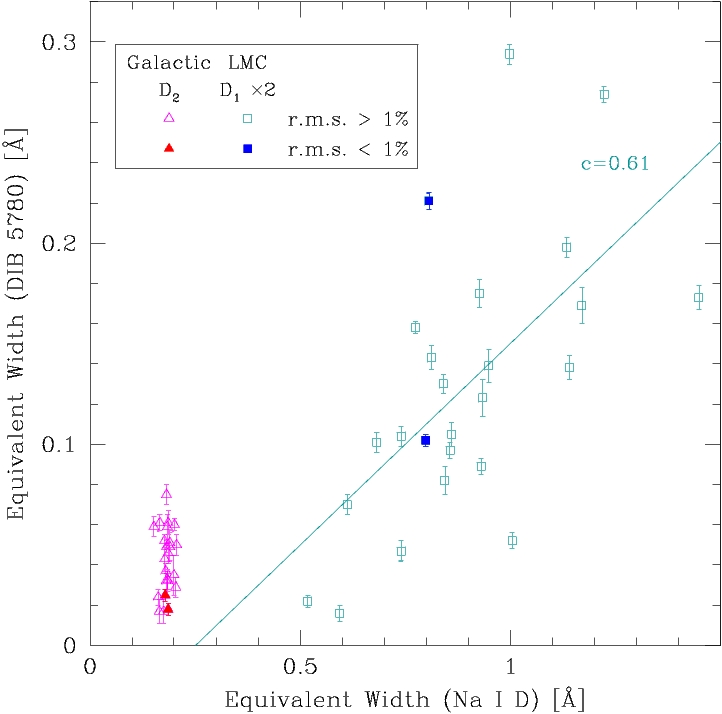
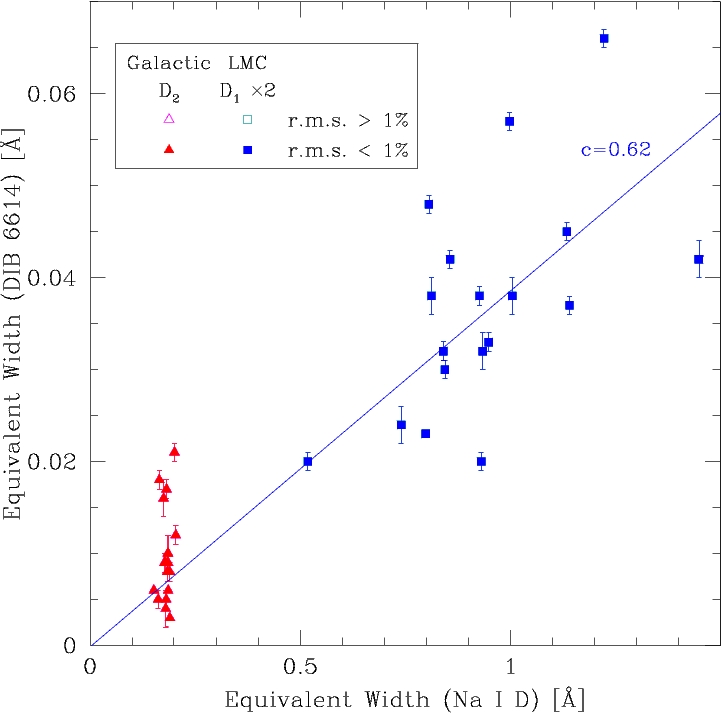
The LMC component of the DIBs shows a clear correlation with the strength of Na i D absorption (Fig. 11) despite the latter suffering from saturation effects. If the equivalent width of the Na i D1 line in the LMC component largely reflects the number of kinematically separated clouds then this could mean that the DIBs are associated with each of these clouds as opposed to certain clouds but not others. However, at the same Na equivalent width the DIBs can display variations in excess of a factor two (see for example the two very good spectra of the 5780 Å DIB in Fig. 11).
The Galactic component of the Na i D absorption does not exhibit much variation despite significant scatter in the DIB absorption; this might be due to saturation of the Na i D2 line. If anything there seems to be some indication of an anti-correlation between the 4428 Å DIB and Na i D, but we discard this as this is the most difficult DIB for which to separate the weak Galactic component from the stronger LMC component and the other DIBs do not show such anti-correlation.
There appears to be a threshold in Na column density below which the 5780 Å DIB is not detected in the LMC; while we have no sightlines with such low Na column densities it appears evident from extrapolation (Fig. 11, middle). This is certainly not evident for the 4428 Å DIB (Fig. 11, left); the behaviour of the 6614 Å DIB in this respect is in between that of the 4428 and 5780 Å DIBs. This suggests that, as the neutral atomic gas abundance grows, first the carrier of the 4428 Å DIB appears subsequently followed by that of the 6614 Å DIB and finally that of the 5780 Å DIB. This can be reconciled with the scenario in which the carrier of the 5780 Å DIB resides in the “skin” of clouds as such clouds are not prevalent in relatively warm and diffuse gas. The carrier of the 4428 Å DIB may then, by inference, reside in the inter-cloud medium (as well).
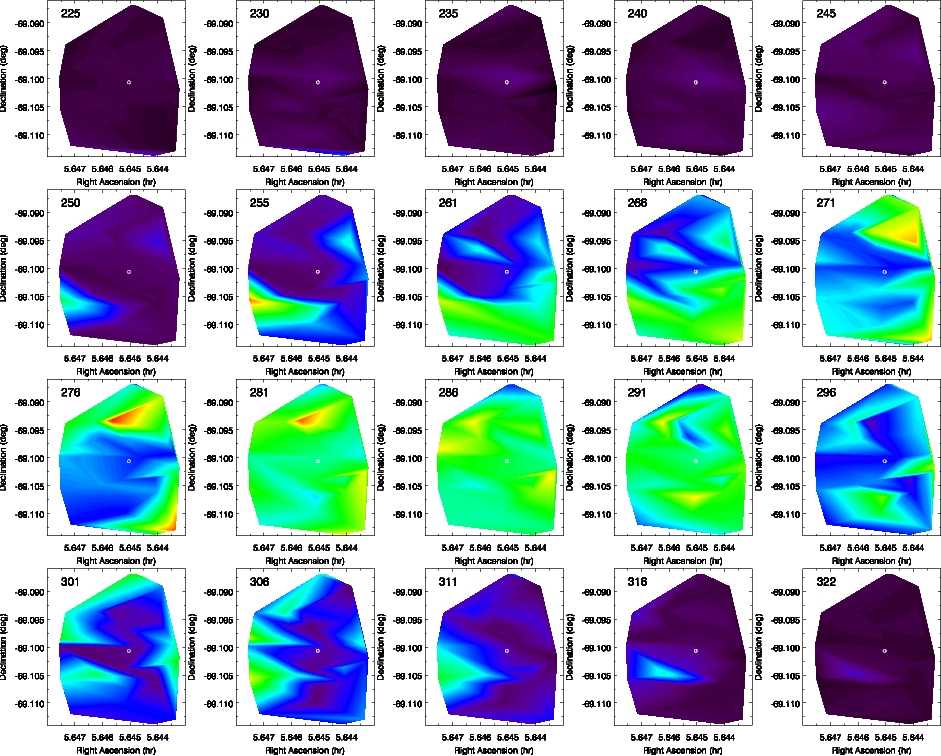
As noted before, the Na i D absorption shows a great deal of complexity both in kinematic and spatial respect. To visualize this, we display “channel maps” of km s-1 wide slices through the D1 line profile of the LMC component (Fig. 12). One may note that the region in the immediate vicinity of R 136 is devoid of gas compared to its surroundings at all velocities except for the high-speed gas cloud at km s-1 which is centered exactly at it. This suggests that the stellar winds emanating from R 136 have carved a cavity of roughly a dozen pc across, and spat out the blue-shifted gas which is now moving outward at a speed of nearly 40 km s-1.
Not surprisingly, it is the strongest Na i D1 structures that are easiest to associate with features in the DIB maps (Figs. 5 & 7): the discrete cloud around 276 km s-1 at (RA,Dec) can be seen as an equally discrete structure in both the 4428 Å and 6614 Å DIB absorption; the absorption in the south–west corner of the Na i D1 map around 276 km s-1 is associated with strong 4428 Å DIB absorption around (RA,Dec) ; and the filament around 255 km s-1 stretching towards the West from (RA,Dec) has a counterpart in the 4428 Å DIB absorption as well.
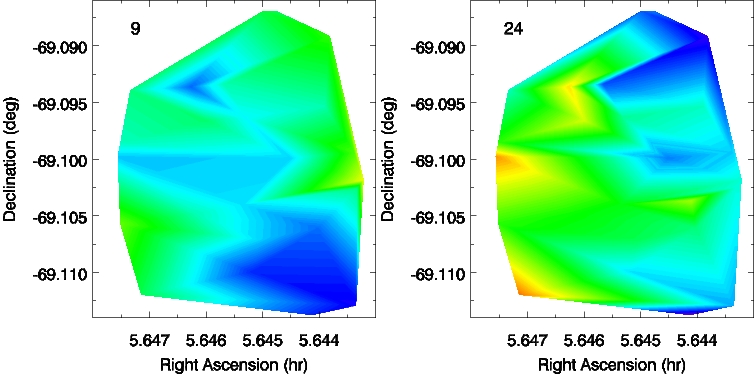
The Galactic component is split into two slices: one centered at 9 km s-1 and 7 km s-1 wide, and another centered at 24 km s-1 and 15 km s-1 wide (Fig. 13). Structure is seen in both kinematic components on scales of , or 0.01 pc at 40 pc distance. We discuss this further in Section 4.2.2. There is no clear association between individual features in the Na i D maps and the DIBs (Figs. 4–8), so we cannot conclude whether the carriers of the DIBs are more prevalent in the nearby or more distant gas.
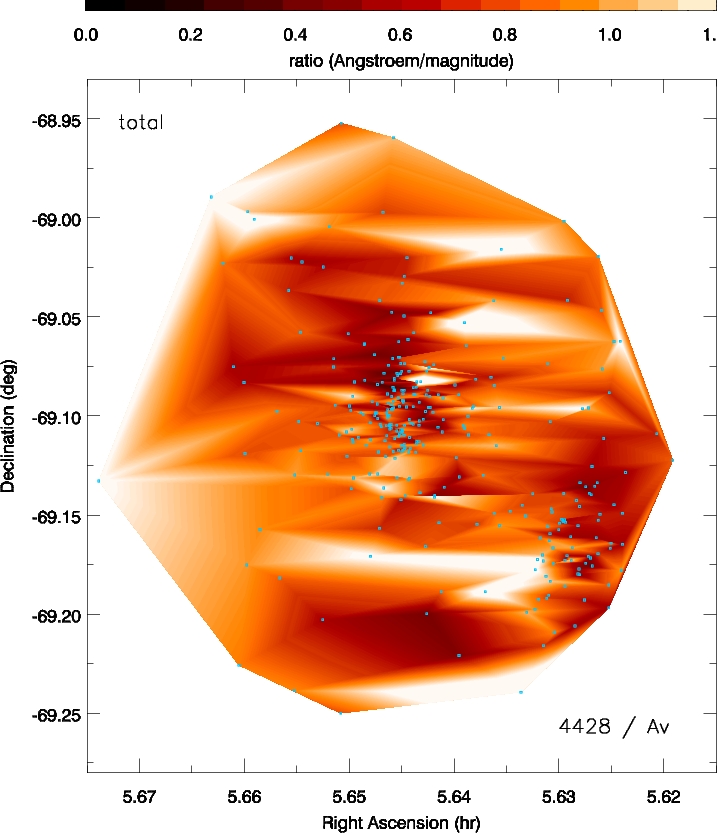
3.4 Correlation between DIBs and visual extinction
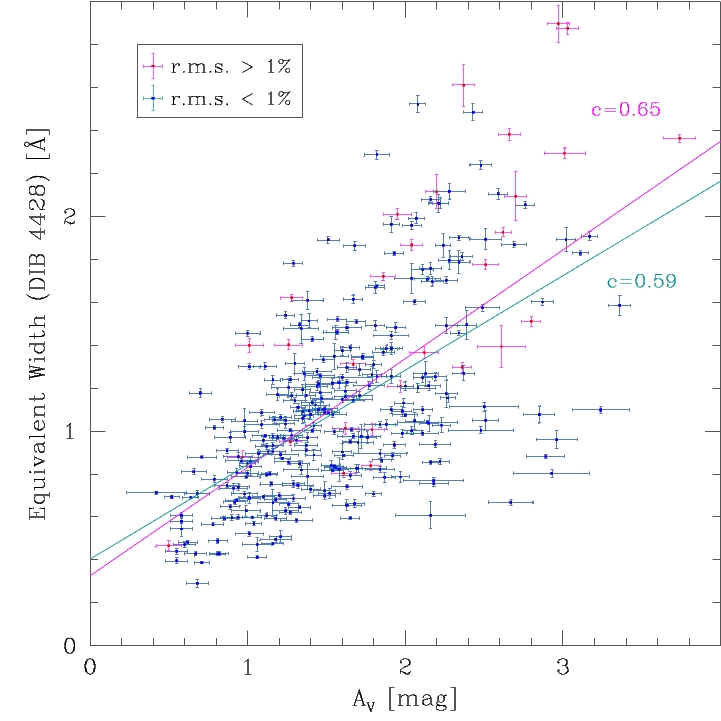
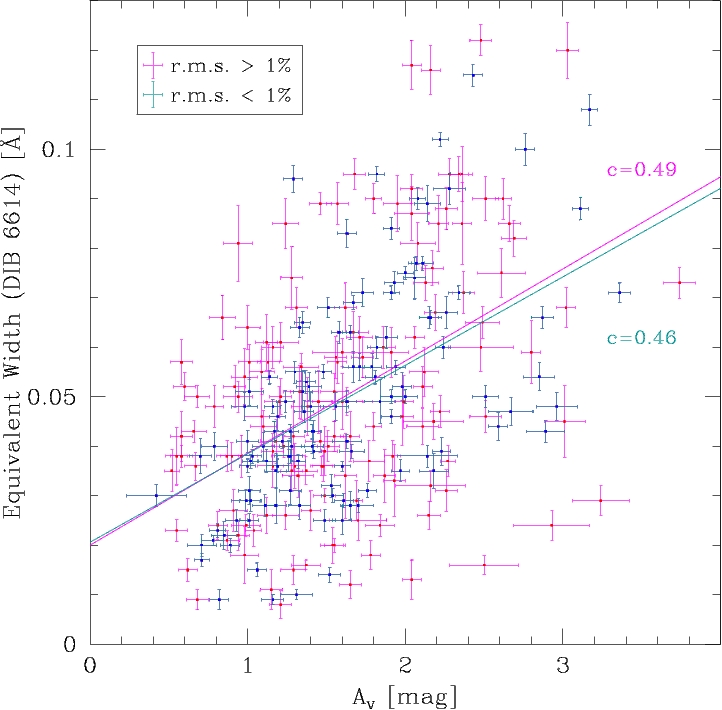
Because no distinction can be made between the LMC and Galactic components contributing to the interstellar attenuation due to dust grains, we only inspect the correlation between the total (i.e. LMC + Galactic) DIB absorption and visual extinction, AV. The latter was derived from a comparison between photometry and spectral modelling of a subset of the VFTS sample – mostly O-type stars (Maíz Apellániz et al. in prep.). There is quite a good correlation (Fig. 14), at least for mag. The correlation seems better for the 4428 Å DIB than for the 6614 Å DIB. Strong DIBs are only seen through dusty sightlines, but the reverse is not true: some dusty sightlines have clear but not particularly strong DIBs.
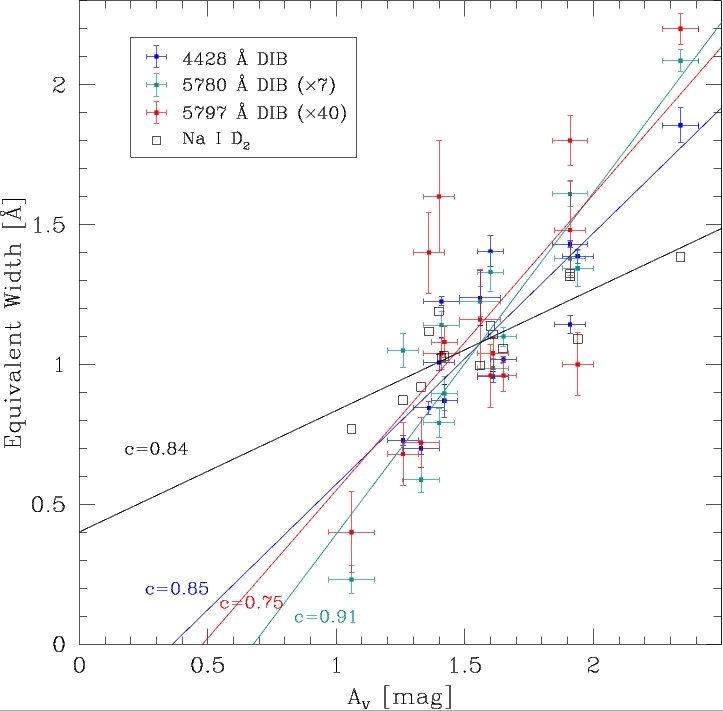
The 4428, 5780 and 5797 Å DIBs as well as Na i D absorption are all correlated with AV (Fig. 15, which only shows sightlines in common, i.e. in the direction of R 136). However, when extrapolating towards the origin, the Na absorption does not vanish when AV does, whilst the 5780 and 5797 Å DIBs seem to require a threshold in AV of about 0.6 mag; the behaviour of the 4428 Å DIB is consistent with it vanishing when AV does, especially given that the full sample (Fig. 14) does not support an extinction threshold for this ubiquitous DIB.
4 Discussion
4.1 The nature of the carriers of DIBs
While we use the DIBs to map the ISM this is done without knowing the nature of the carriers of these absorption bands, but by doing so we gain insight into their behaviour which may help constrain their possible character. Clues may be had from the shapes of the bands, from correlations between the bands and between bands and other ISM tracers such as atomic absorption lines or the attenuation or emission by dust grains, or from the spatial distribution of the DIB absorption strength in relation to physical structures in the ISM.
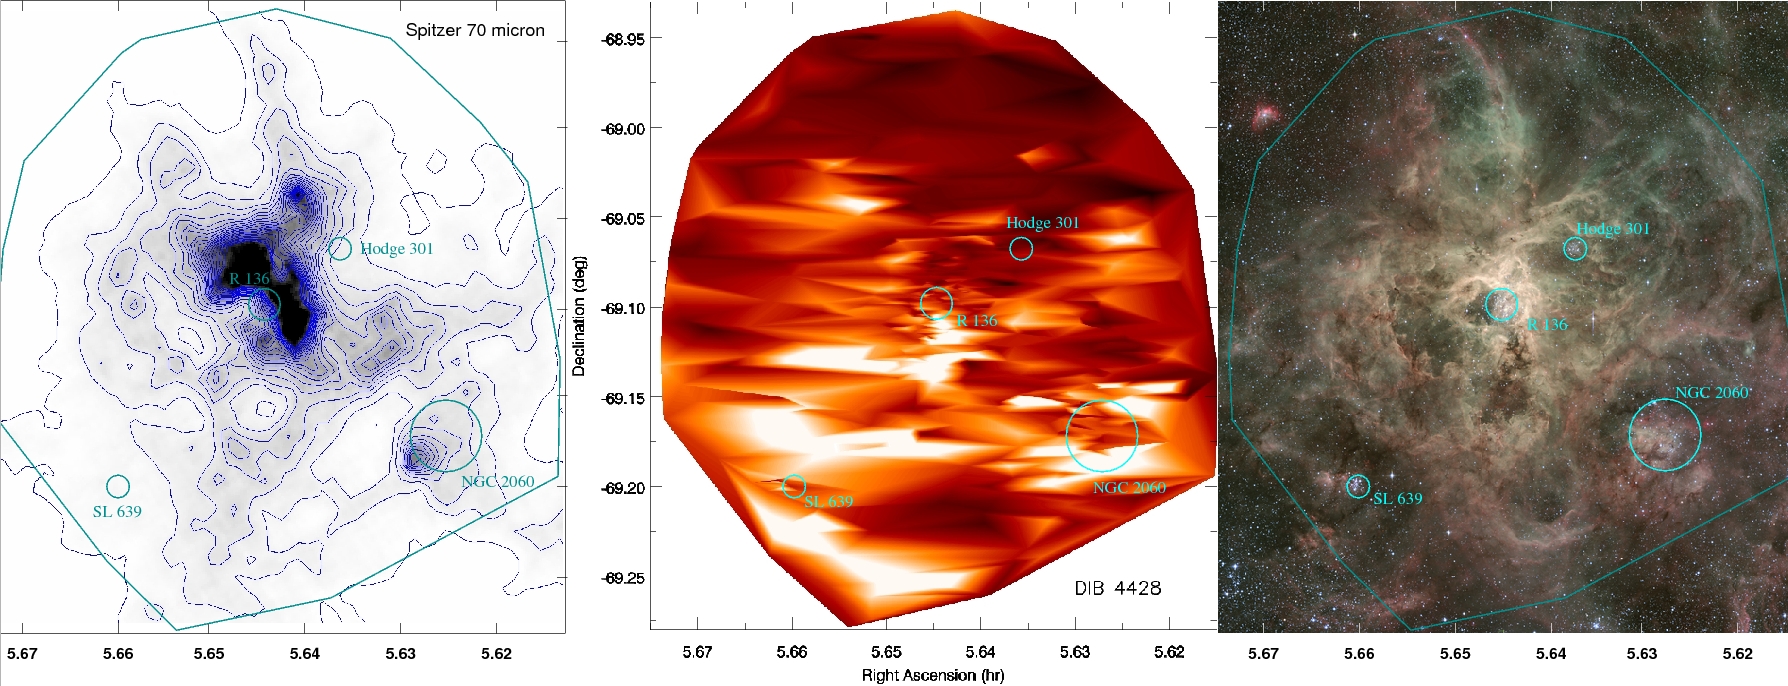
To start with the latter approach, we compare the (Medusa, total) 4428 Å DIB map with an optical and a far-IR view of the same region (Fig. 16). The optical picture is a composite of broad-band images showing mainly stars and some reflection nebulosity, and narrow-band images centered on the [O iii] (green) and H (red) emission lines. Besides stars – in particular the four clusters R 136, NGC 2060, Hodge 301 and SL 639 – the optical appearance features emitting or reflecting (yellow/brown) nebulosity as well as dark patches and filaments obscuring optical light from stars and nebulosity behind them. The far-IR image is a broad-band 70-m image obtained with the Spitzer Space Telescope for the SAGE-LMC legacy survey (Meixner et al. 2006); it shows thermal emission from cool dust. Note that the DIB map is solely based on material absorbing light from the stars behind them: clouds of DIB carriers lying behind stars will remain unnoticed. At the same time, our sample is biased against probing very dense clouds as the high visual extinction would render the stars too faint. That said, there is remarkably little correspondence between the DIB map and the dust map. The already imperfect link between DIB absorption and visual extinction is lost when the effects of geometry (spatial distribution of stars and dust) and variations in dust temperature and illumination (hence IR surface brightness) are folded in.
More striking is the lack of DIBs at the exact positions of the four star clusters, but their prominence adjacent to (or even surrounding) at least three of them. While there is no clear correspondence between the DIB map and the diffuse optical emission, the lack of DIBs in the north–west corresponds to regions where the [O iii] emission is strong; strong DIBs are found instead in the H-dominated regions in the direction of the molecular ridge to the south of the Tarantula Nebula (cf. Wong et al. 2011). The north–west is littered with superbubbles created by multiple supernovae predating the formation of R 136 (Kim et al. 1999); the intense [O iii] emission might arise from shocks at the rims of those bubbles, and the bubbles themselves might be largely “empty”. This suggests that the carriers of the DIBs – and/or their excitation – reside in relatively diffuse, weakly ionized gas and that they are diminished in dense, cold clouds as well as in hot bubbles and when directly irradiated by hot stars. This setting the stage, we now look in more detail into the properties and behaviour of the DIBs.
4.1.1 Band profiles
The profile of the 4428 Å DIB in our data was better represented with a Lorentzian profile than with a Gaussian profile, in accordance with the findings by Snow et al. (2002b) who interpreted this as evidence for a molecular carrier which would give rise to the damping wings of the profile. The 6614 Å DIB in our data was better represented with a Gaussian profile, though one may discern in the combined spectrum (Fig. 2) that the short-wavelength edge is steeper and more abrupt than the long-wavelength edge, and that the core seems to have a “shoulder”. These observations are in agreement with the substructure noted by Sarre et al. (1995) and Cami et al. (2004) in high-resolution spectra. In this regard, the 4428 and 6614 Å DIBs display similar characteristics both in the LMC and in the Milky Way.
The FWHM of the 4428 Å DIB was fixed to 20 Å; we saw no indications that individual profiles of strong absorption deviated from this at any significant level. Such width is typical of Galactic sightlines as probed by, e.g., Snow et al. (2002b) and Hobbs et al. (2008, 2009) who found slightly (of order 10%) smaller and larger values, respectively. This suggests a great deal of uniformity of the carrier and insensitivity of the excitation of the band to environmental conditions, as also noted by Snow et al. The FWHMs of the 5780, 5797 and 6614 Å DIBs were measured for both the LMC and Galactic sightlines in our sample, and the results are listed in Table 3. For the 6614 Å DIB we had the luxury of numbers to limit the tabulated values to those measured in the best spectra with r.m.s. %; the median FWHM for spectra with r.m.s. % is % smaller but with a somewhat larger standard deviation (in all cases we omitted values of zero). As an independent reference, the values in Hobbs et al. (2009) based on one spectrum are 2.14, 0.91 and 1.08 Å for the 5780, 5797 and 6614 Å DIBs, i.e. similar to both components in our sample. Nonetheless, one could argue that, if anything, the profiles in the LMC are narrower than those in the Milky Way – especially considering that the kinematic broadening may be more important in the LMC than in (at least our) Galactic sightlines. Indeed, we have seen clear evidence of strong absorption from sodium over more than 40 km s-1, which in itself would yield a DIB profile FWHM of 0.8–0.9 Å. The latter cannot be true as the FWHM of the 5797 Å DIB does not exceed that value and the intrinsic width of the DIBs is certainly more than a few tenths of Å (see below for further discussion). If impurities in the carrier cause additional sub-structure, e.g., as seen in the 5797 Å by Kerr et al. (1998) and/or broadening then one could envisage a scenario in which such impurities are suppressed in a metal-depleted environment such as that of the LMC as compared to that of the Milky Way Disc (Milky Way Halo clouds being metal-poor).
4.1.2 Correlations
The 4428, 5780, 5797 and 6614 Å DIBs are all correlated with one another. Moutou et al. (1999), in spectra of nearby stars, found that the 6614 Å DIB correlates well with the 5780 and 5797 Å DIBs but not with the 4428 Å DIB. In contrast, our data shows a rather good correlation between the 6614 and 4428 Å DIBs (Fig. 9). There is some scatter in this relation, and in particular there seem to be a number of LMC sightlines with relatively weak 6614 Å DIB for the observed strength of the 4428 Å DIB in that direction. Looking at where these are distributed on the sky (Fig. 17) one may notice that these sightlines are found near to the two main OB associations, viz. R 136 and NGC 2060 (see Fig. 16), and the northern part of the field, but not in the molecular cloud complexes to the south. This could signify a DIB selection process driven by UV irradiation, with the 4428 Å DIB being more resilient in the harsh radiation environment even though it too is suppressed in those environments (Fig. 16).
The ratio between the equivalent widths of the 5797 and 5780 Å DIBs, in the Galactic sightlines of our own sample, and 0.15 in the LMC, i.e. firmly typical of -type clouds characterised by a harsh radiation field. This is not surprising as the high Galactic latitude sightlines probe hot gas in the Local Bubble similar to the extra-planar gas of the Milky Way for which this was already demonstrated (van Loon et al. 2009), and the Tarantula Nebula is exposed to the irradiation by many young massive O-type stars. The data in Welty et al. (2006) suggest , 0.40 and 0.37 for Galactic, LMC and SMC sightlines, respectively. This suggests generally stronger 5780 and/or weaker 5797 Å DIBs for decreasing metallicity, but our lower values in both the Galactic and LMC sightlines through particularly harsh irradiation environments suggest that enhanced irradiation further drives the EW(5780)/EW(5797) ratio towards lower values. This broadly corroborates variations noted by Welty et al. within each of their Magellanic Clouds and Milky Way samples. Likewise, Vos et al. (2011) find a ratio towards the Upper Scorpius star-forming region similar to that in our sightlines, , but with deviations in individual sightlines up to .
| component | Galactic | LMC | ||||
|---|---|---|---|---|---|---|
| median | st.dev. | error | median | st.dev. | error | |
| 5780 Å DIB | 2.34 | 0.35 | 0.07 | 1.97 | 0.33 | 0.07 |
| 5797 Å DIB | 0.86 | 0.17 | 0.03 | 0.81 | 0.15 | 0.03 |
| 6614 Å DIB | 0.97 | 0.47 | 0.03 | 1.24 | 0.30 | 0.02 |
Our LMC sample displays a ratio of equivalent widths of the 6614 and 5780 Å DIBs, (up to in some cases). This contrasts with the Galactic data presented in Friedman et al. (2011) which suggests that at a given strength of the 5780 Å DIB, the LMC sightlines have 5797 and 6614 Å DIBs that are only half as strong. But this ratio varies in the Milky Way, too, with in the sample presented by Moutou et al. 1999), but only towards the Upper Scorpius star-forming region (Vos et al. 2011). We thus conclude, for now, that our LMC sightlines show either enhanced 5780 Å DIBs or depleted 5797 and 6614 Å DIBs, by a factor of two at most, or a combination of both (by smaller factors).
We now look at how the DIBs compare to the attenuation by dust grains, realising that we cannot separate the Magellanic dust from the Galactic dust though it appears that both the dust and DIBs are dominated by the LMC component. We find Å mag-1 around mag, albeit with a possible threshold in AV. This is consistent with the data in Welty et al. (2006), which suggest , 0.10 and 0.07 Å mag-1 for Galactic, LMC and SMC sightlines, respectively (assuming ); Raimond et al. (2012) and Vos et al. (2011) find somewhat lower Galactic values of and 0.15 Å mag-1, respectively. The data presented by Vos et al. (2011) also suggest Å mag-1 which is double the rate that we find. Given that the Upper Scorpius star-forming region studied by Vos et al. appears to exhibit a similar radiation environment, as traced by the EW(5797)/EW(5780) and EW(5780)/AV ratio, and assuming that the visual extinction is roughly proportional to metallicity, the simplest conclusion is that the 6614 Å DIB is disproportionally weaker in the Tarantula Nebula.
Snow et al. (2002b) observed a levelling off of the strength of the 4428 Å DIB for mag, of which there is a hint also in our data; up to that point, Å/mag both in their and our datasets. Indeed, we noted sightlines with lots of dust but weak DIBs. Looking at where these are located on the sky (Fig. 18) it appears that the smallest ratios are found towards the immediate south–west and north–east of R 136 – which incidentally is also where the far-IR dust emission is most intense (Fig. 16). As the visual extinction is not low the stellar probes are clearly not located in front of all of that dust and the weak DIBs imply their carriers are not directly associated with the large grains that dominate the far-IR emission. Snow et al. (2002a) found unusually weak DIBs (at a given ) in HD 62542, and offered the explanation that this might result from the absence of significant diffuse cloud envelopes (in which the DIBs would be presumed to reside). Possibly, the eroding effect of the O stars in R 136 has taken its toll on the presence of all DIBs, not just the 6614 Å DIB (see above) but even the resilient 4428 Å DIB. However, if the flattening with AV is related to a similar flattening with EW(5780) noted in Section 3.2, then the explanation is more likely to involve the saturation of the formation of the carrier of the 4428 Å DIB or its transformation into another DIB carrier or incorporation into dust, rather than a more destructive scenario.
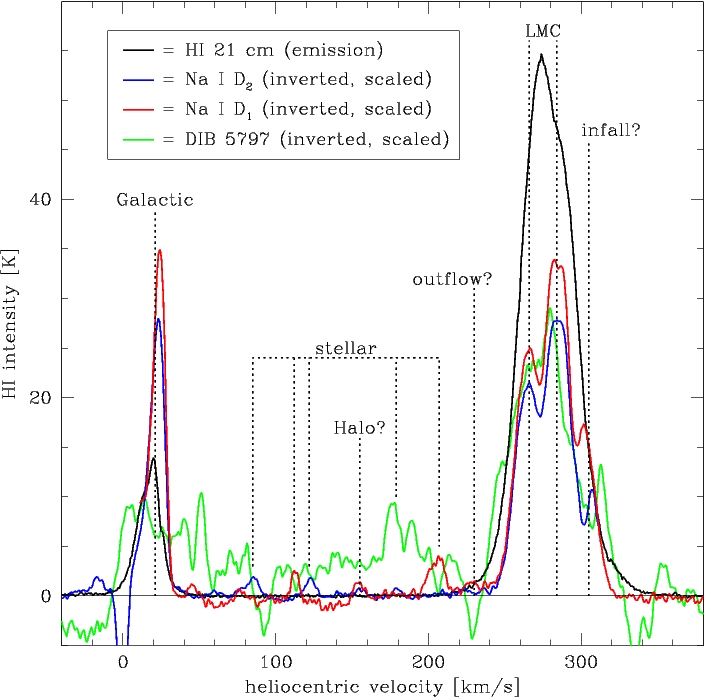
While we have noticed that the Galactic sightlines in our spectra resemble those of the LMC in terms of radiation environments – for instance in terms of EW(5797)/EW(5780) – this is not to say that the high Galactic latitude gas is similar to that in the LMC. Comparing the H i (21-cm spin-flip transition, McClure-Griffiths et al. 2009), Na i D and 5797 Å DIB (Fig. 19), we find that the H i is times more intense in 30 Dor than in the foreground gas, but the Na i D absorption is about equally strong suggesting a metal depletion of a factor four. The 5797 Å DIB is about three times stronger in 30 Dor than in the Galactic foreground, suggesting a rather high DIB abundance given the lower metallicity of the LMC. Note also in this comparison that the non-negligible intrinsic width of the 5797 Å DIB (see above) means that its profile is narrower than that of the Na i D line and so not much of it can be associated with the clouds that deviate kinematically from the bulk of the 30 Dor ISM. It thus appears that the carrier of the 5797 Å DIB is more prevalent in the generally denser and more neutral ambient ISM and less so in the more energetic components, in contrast to the carrier of the 5780 Å DIB, thus driving the variations of the EW(5797)/EW(5780) ratio.
Friedman et al. (2011) observed a generally good correlation between DIB strength and H i column density. While the H i emission would indeed serve as a useful reference against which to gauge the strength of other tracers of the ISM, the limited resolution of the available H i surveys of the LMC (, Kim et al. 1998) at present precludes such detailed correlation; we note that on these scales ( pc) the H i maps resemble the far-IR maps (Meixner et al. 2010) such as the one in Fig. 16, and that a high-resolution, sensitive H i survey of the Magellanic Clouds is going to be carried out with the Australian Square Kilometre Array Pathfinder (Dickey et al. 2012).
4.1.3 Minor DIBs
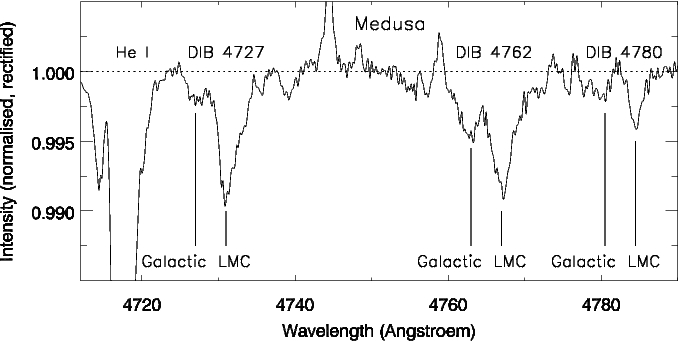
We now briefly consider additional DIBs in the spectral ranges covered by the VFTS. We recall the detection of the 4502 Å DIB in our LMC sightlines (Fig. 1), and its strong presence in the Galactic massive young star cluster, NGC 3603, and in particular in the Galactic H ii region RCW 49 where it is about half as deep as the 4428 Å DIB (Morrell, Walborn & Fitzpatrick 1991). Compared to the other DIBs we have described, the 4502 Å DIB appears stronger in the LMC than in our Galactic sightlines. These observations point at UV irradiation as a driver behind the strong presence of the carrier of the 4502 Å DIB, perhaps even more so than for that of the 4428 Å DIB. We also wish to draw the attention to a set of DIBs at 4727, 4762 and 4780 Å, covered with the LR03 setting of the Medusa mode (at a spectral resolution of 0.56 Å); while too weak to study in detail in individual spectra, they are clearly detected both in the LMC and Galactic foreground (Fig. 20). Interestingly, the Galactic-to-LMC ratio of the 4727 Å DIB seems relatively low compared to that of the 4762 and 4780 Å DIBs, indicating differences in their carriers; there is thus a clear diagnostic value to consider these DIBs jointly.
4.2 Structure and kinematics of the ISM
Apart from mapping the locations and excitation environments of the unknown carriers of the DIBs, we have kinematic information from the Na i D lines to help make sense of the ISM structures and the relation between DIBs and atomic gas. Furthermore, we can quantify spatial variations of absorption at small scales to investigate what underlying structures are inherent in the maps and correlations that we discussed earlier.
4.2.1 An expanding bubble around R 136?
Walborn (1980), Blades (1980) and Blades & Meaburn (1980) observed R 136 in Na i D and Ca ii K absorption and found, besides one Galactic component, four LMC components in the range 242–305 km s-1 with a wing extending to about 150 km s-1. They noted large variations in equivalent width between Na i D and Ca ii K; the latter was stronger in the more extreme blue and red components, indicative of ionized gas or of the Routly–Spitzer effect (Routly & Spitzer 1952) explained by Barlow & Silk (1977) due to sputtering of calcium atoms off of dust grains. Both these mechanisms, ionization and sputtering are associated with hot gas. It is therefore not surprising that the 5797 Å DIB does not appear to trace these extreme kinematic components.
The massive cluster R 136 clearly impacts upon the surrounding ISM by its ionizing radiation and the ram pressure from its stellar winds; this is seen in the form of a cavity devoid of dust and DIBs (Fig. 16), but also through its imprint in the velocity maps of the Na i D absorption (Fig. 12). A high-velocity blob of absorbing sodium in the sightline towards VFTS 482 suggests an expansion at a rate of 40 km s-1 which, for a shell of 6 pc radius corresponds to a dynamical age of yr, i.e. much less than the age of R 136 ( yr). This could imply a delay between the formation of the cluster and the onset of a powerful cluster wind as the O-type stars evolve off of the main sequence. The spectral line associated with this fast blob has an equivalent width of Å (cf. Table 2). This can be converted to a column density in the lower level of the transition (see, e.g., van Dishoeck & Black 1989):
| (1) |
where the oscillator strength for Na i D1. We thus obtain cm-2. If we assume that this represents the majority of sodium, that the sodium abundance in the LMC is half solar (i.e. , see Baumüller, Butler & Gehren 1998), and that hydrogen constitutes 75% of the material in mass, then we obtain a surface mass density of mg m-2. For a uniform shell this would amount to as much, where pc is the radius of the shell, i.e. 2 M⊙. For typical mass-loss rates of evolved O stars of – M⊙ yr-1 (Vink, de Koter & Lamers 2001; Mokiem et al. 2007a,b) this amount could have been produced by a mere handful of O stars over the course of yr. The winds will have swept up some interstellar gas, though; if half of it was swept-up, then the average ISM density within the 6-pc-radius bubble would have been cm-3, i.e. typical of the warm, weakly-ionized ISM.
But Na i is not the dominant ionization stage except for very dense clouds, and it also is depleted within dust grains even in diffuse ISM. So the above estimate for the mass in the shell will be too low. Wakker & Mathis (2000) showed that the Na i abundance shows very little dependence on H i column density; it is lower than solar by a factor of a few hundred, with scatter over two orders of magnitude. This would bring the mass of the shell around R 136 closer to M⊙. As it would require a thousand evolved O stars to supply this amount of matter within less than yr it would be more likely that much – if not most – of the mass is swept-up ISM. This would also be consistent with the expansion speed to have dropped from over 1000 km s-1 in the winds of the O stars down to the 40 km s-1 of the shell. The revised mass would correspond to a prior average ISM density in the range of 10–100 cm-3, more typical of cool ISM perhaps related to the formation of R 136.
That said, the blue-shifted absorption component is not seen in all of the UVES spectra, and so the assumption of a uniform shell cannot be correct. This would bring down the estimate of the total mass in the shell. On balance, we conjecture that it is plausible that a number (dozens?) of evolved O stars within R 136 together have blown a bubble of 6 pc radius in less than yr, sweeping up a sizeable fraction of its mass from the local, cool but not particularly dense ( cm-3?) ISM.
The picture may not be that simple, though. Firstly, gas may actually also be falling towards 30 Dor at km s-1 as well, as loosely remarked by Blades (1980) and also visible in our velocity maps (Figs. 12, 19 & 21). This must be interpreted in light of the paradoxial scenarios of gas outflow (Nidever, Majewski & Burton 2008) and infall (Olsen et al. 2011) as deduced from H i emission and possibly associated stellar kinematics, respectively. The 30 Dor region at large may well be accreting cool gas whilst ejecting hot gas, much akin the “fountains” of the Milky Way Disc (see, e.g., Marasco, Fraternali & Binney 2012, and references therein).
Secondly, while expulsion by stellar winds is a possibility the blue-shifted (w.r.t. the systemic velocity of km s-1) gas may reside instead in the Milky Way Halo (Blades 1980; Blades & Meaburn 1980). De Boer, Koornneef & Savage (1980) found UV absorption at 20 km s-1 (Galactic) and at 220, 250 and 290 km s-1 towards the LMC and proposed that the 220 km s-1 component might originate in coronal gas associated with the LMC. Intermediate- and high-velocity clouds floating in the Galactic Halo have also been seen in front of the LMC at 60 and 120 km s-1, interestingly also in H2 absorption (Richter et al. 1999; Richter, Sembach & Howk 2003; Lehner, Staveley-Smith & Howk 2009). We only, tentatively, identify one kinematic component between 30 and 230 km s-1, viz. at km s-1 (Fig. 19); other absorption components are not consistently present in both Na i D1 and D2 components and must thus be stellar (i.e. not sodium) in origin. The 155 km s-1 component might be associated with a Halo cloud, perhaps originating in the LMC (Lehner et al. 2009) and also seen in more sensitive H i observations (cf. McGee, Newton & Morton 1983). However, there is no sign of H i emission at 155 km s-1 in the direction of R 136 (Fig. 19).
4.2.2 Small scale structure of the ISM
On the scale of the Medusa maps (Figs. 4 & 6) – viz. or 300 pc at the distance of the LMC and pc for gas within 100 pc distance – the DIB absorption varies considerably; variations are still seen at even smaller scales (Figs. 5, 7 & 8) also in Na i (Figs. 12 & 13). We quantify these variations by the standard deviation and also express these in terms of the median value (Table 4). The latter are typically between 0.1 and 1, which is expected for a medium with structure across a range of scales – the rather high values of are most readily explained by fairly short gas columns, closer to kpc than kpc lengths (van Loon et al. 2009). One should bear in mind, of course, that if stars and gas are mixed then part of the variance in absorption is due to the fact that some stars will be situated toward the back of the entire gas column and others toward the front; this cannot be quantified without adopting a model for the distribution of stars and gas. If gas and stars share an identical, uniform distribution in space, then it is trivial to derive that the standard deviation will be % of the median. More trivial still, if the stars are all behind all of the gas then the standard deviation due to the mixing will be zero. The values in Table 4 below 57% could therefore be taken to indicate that most of the gas probed by the maps is in front of the stars; one could imagine a sheet lying in front of the clustered massive stars, for instance, consistent with the idea of an expanding shell surrounding R 136.
| component | Galactic | LMC | ||||||||||
|---|---|---|---|---|---|---|---|---|---|---|---|---|
| 0.6 pc | 0.04 pc | 0.015 pc | 300 pc | 20 pc | 8 pc | |||||||
| Å | % | Å | % | Å | % | Å | % | Å | % | Å | % | |
| 4428 Å DIB | 0.12 | 0.19 | 0.20 | 389 | 0.49 | 54 | 0.32 | 31 | 0.36 | 33 | ||
| 5780 Å DIB | 0.015 | 34 | 0.070 | 56 | ||||||||
| 5797 Å DIB | 0.006 | 71 | 0.014 | 77 | ||||||||
| 6614 Å DIB | 0.008 | 86 | 0.026 | 79 | ||||||||
| Na i D | 0.013 | 7 | 0.11 | 25 | ||||||||
Considering the angular scale of the UVES spectra, we see consistently larger variations in the LMC than in the Galactic component, both in absolute terms and relative to the median level. On scales from 0.04 pc to 20 pc, the structures probed by DIBs and Na i may be losing some of their coherency. This idea is corroborated by the larger variation in the Galactic 6614 Å DIB on scales of 0.6 pc as compared to the variations on a scale of 0.04 pc; likewise, the LMC 6614 Å DIB and 4428 Å DIB vary more on even larger scales, of pc. (Note that the measurements of the Galactic 4428 Å DIB component are very dubious.) This all suggests that the ISM probed by DIBs and Na i, i.e. neutral and weakly-ionized gas, has structure on scales ranging from as small as pc to as large as pc – spanning three orders of magnitude. The variations are larger for the 5797 Å DIB than for the 5780 Å DIB, which are larger than for the Na i (both in the Galactic and LMC components). This suggests that there is more, smaller structure in the colder ISM phase (e.g., probed by the 5797 Å DIB) than in the warmer ISM phase (e.g., probed by the 5780 Å DIB and especially the Na i line). Such explanation may also apply to the larger variations in the LMC 6614 Å DIB as compared to the LMC 4428 Å DIB as the latter is thought to exist (also) in warmer gas. This picture is also consistent with that proposed by Pan et al. (2005), in which tracers of warmer ISM are distributed more widely in space as well as kinematically whilst tracers of colder ISM are confined to dense regions and generally show narrow line profiles. These differences give rise to scatter in – and deviations from – correlations that in essence trace the overall gas column density. A dependence of structure formation on gas temperature such as outlined here is expected as structure develops when cooling gas condenses and/or fragments due to thermal instabilities. The 100-pc scales may be related to molecular cloud complexes and inter-cloud regions, whilst pc and sub-pc scales may be related to cloud cores, stellar wind bubbles and structure in cool–warm ISM interfaces.
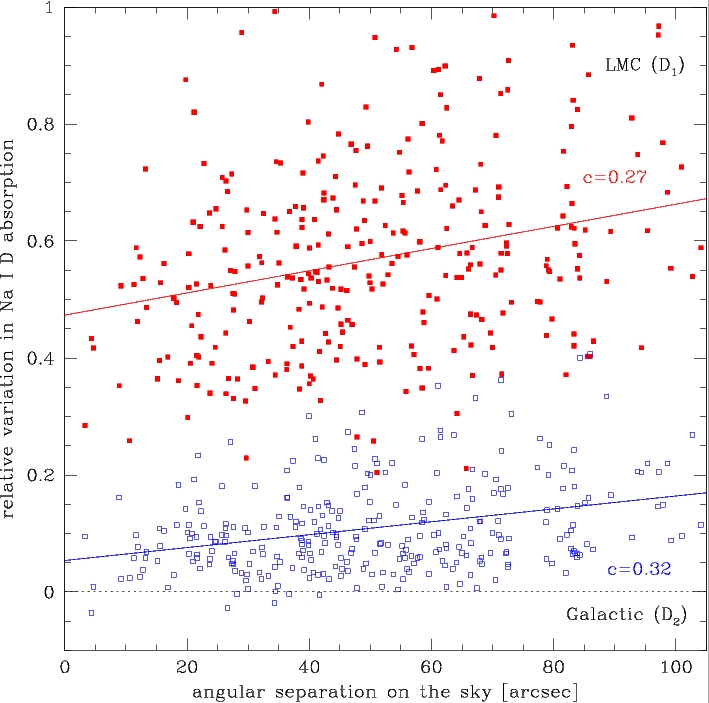
The Na i line profiles (Fig. 21) show very significant variation in several discrete absorption components (clouds) on scales as little as (1 pc) in the LMC. When cross-correlating these spectra (Fig. 22) we see a gradual increase in their differences as their angular separation increases. This is true both for the Galactic and LMC component, implying structure (in the Galactic gas, assuming a distance of 100 pc) on scales as small as pc (just 2000 AU). The latter could correspond to the interstellar cirrus filaments that are sometimes visible in optical or far-IR images of extra-planar gas. Tiny- and small-scale structure appears to be commonplace in a wide variety of environments within our Galaxy – see Smoker et al. (2011) and references therein. Pan et al. (2005) combine spectroscopic observations with a chemical model to relate spectral variations seen towards Oph to column density variations up to a factor ten on scales of AU, in addition to the typical pc-scale variations seen for instance across the Cepheus bubble in CO. They suggest the high contrast implies sheet-like structures as proposed by Heiles (1997), with aspect ratios of 5–10. While we clearly notice tiny-scale structure in our data the amplitude is below unity and therefore does not require sheet-like or filamentary cloud geometry; the drastic variations in individual kinematic components that we see in our LMC sightlines are related to the wider distribution of individual clouds, on scales exceeding a parcec. Complex, sub-pc structure has also been seen towards the hyper-massive eruptive star Carinae and stars in the adjacent Trumpler 16 cluster in the Milky Way, which have been linked to possible outflows from a supernova remnant or protostellar outflows in front of the stars (Walborn et al. 2007).
Small-scale structure on sub-pc scales in the local (cold) ISM towards the Magellanic Clouds has been found recently also in UV data. Nasoudi-Shoar et al. (2010) analyzed molecular hydrogen (H2) absorption in the local foreground gas along several closely spaced sightlines towards early-type stars in the N 51 D superbubble in the LMC. Based on the analysis of the spatially varying H2 absorption pattern and the physical conditions in the gas, these authors conclude that the local cold neutral medium towards the LMC consists of small-scale structure on linear scales pc. These results are in good agreement what is seen in our Na i D data towards 30 Dor, which is not surprising as Na i and H2 are expected to trace a similar gas phase in the Milky Way Disc.
5 Conclusions
We have used over 800 sightlines probed by spectra from the VFTS covering the Tarantula Nebula, to measure the absorption by the DIBs at 4428 and 6614 Å, and 25 sightlines in a more restricted region centered on the central cluster R 136, to measure the absorption by the DIBs at 5780 and 5797 Å and by the Na i D doublet. We have used these measurements to create maps of the 4428 and 6614 Å DIBs and maps of the Na i D absorption in different velocity slices. We have compared the absorption probed by these spectral features, and with interstellar reddening. Our main conclusions can be summarised as follows:
-
The maps of the 4428 Å and 6614 Å DIBs bear little resemblance to images of the far-IR emission from cool dust, indicating that the carriers of DIBs are not directly related to relatively large grains (in keeping with an observed break-down of the correlation between DIB strength and visual extinction for large values of the latter); the features in the DIB maps more closely correspond to nebulosity traced by hydrogen recombination (H) and tend to avoid superbubbles traced by [O iii] emission and the immediate vicinity of OB associations.
-
The molecular cloud complex to the south of 30 Doradus is traced – at least in a general sense – by the carriers of the 4428 and 6614 Å DIBs, but the carrier of the 4428 Å DIB is also present in warmer diffuse gas found throughout the Tarantula Nebula.
-
Differences exist in the relationships between the different DIBs and Na, with the 4428 Å DIB present already at low Na column density but the 6614, 5780 and 5797 Å DIBs only starting to appear through subsequently denser Na columns; a similar trend is observed for the relation between the DIBs and visual extinction in common sightlines close to R 136. In agreement with the previous conclusions, we suggest that the carrier of the 4428 Å DIB may be a relatively large yet compact, and electrically neutral molecule that is relatively resilient to impacting energetic photons or particles, as opposed to a relatively small, fragile molecular carrier of the 5797 Å DIB; the carriers of the 6614 and 5780 Å DIBs may have intermediate sizes and they may be mildly electrically charged, making them vulnerable to destruction in exposed environments and to recombination within dense clouds – cf. Sandstrom et al. (2012) for similar considerations with regard to the carriers of unidentified IR bands in the Magellanic Clouds.
-
The 6614, 5780, 5797 and especially 4428 Å DIBs correlate with the extinction of the (same) star by interstellar grains. In light of the poor correlation of DIBs with dust emission this suggests that moderate visual extinction may be dominated by relatively small grains that are mixed with warm neutral or weakly-ionized gas, rather than the large grains that dominate far-IR emission.
-
Both the Tarantula Nebula and Galactic high-latitude gas are characterised by strong radiation fields, as evinced by the weak 5797 Å DIB compared to the 5780 Å DIB. Differences are found between the Galactic and LMC sightlines in the ratios of the 4727 Å DIB and 4762 and 4780 Å DIBs, however, which could make these DIBs valuable additional diagnostics – perhaps of metallicity.
-
Compared to Galactic samples, at a given visual extinction the 5780 Å DIB is weaker while the 4428 Å DIB is of similar strength. Assuming the extinction scales in proportion to metallicity this would suggest that the abundance of the carrier of the 4428 Å DIB is proportional to metallicity and less dependent on radiation field while the other DIBs are diminished by metallicity as well as irradiation. The same conclusion is reached when Na i is used as reference instead of extinction.
-
Stellar winds from the central cluster R 136 appear to have created a shell of M⊙ which is expanding at a speed of km s-1. Some evidence for infall is also present, suggesting the operation of a galactic “fountain”.
-
Structure is detected in the distribution of cool–warm gas down to scales of a few pc in the LMC and as little as pc in the Sun’s vicinity, more strongly so in the DIBs than in Na i. This corroborates the notion that the carriers of the DIBs reside in neutral or weakly-ionized gas but not in hotter gas which is also traced by Na i.
Acknowledgements.
We would like to thank the anonymous referee and Keith Smith for their useful suggestions. AEB and BLT acknowledge STFC studentships awarded to Keele University. JMA acknowledges support from the Spanish Government Ministerio de Educación y Ciencia through grants AYA2010-15081 and AYA2010-17631, and from the Consejería de Educación of the Junta de Andalucía through grant P08-TIC-4075. STScI is operated by AURA, Inc. under NASA contract NAS 5-26555. This paper makes use of spectra obtained as part of the VLT–FLAMES Tarantula Survey (ESO programme 182.D-0222). Based on observations made with ESO Telescopes at the La Silla Observatory under programme ID 076.C-0888, processed and released by the ESO VOS/ADP group.References
- (1) Barlow M.J., Silk J., 1977, ApJ, 211, L83
- (2) Baumüller D., Butler K., Gehren T., 1998, A&A, 338, 637
- (3) Blades J.C., 1980, MNRAS, 190, 33
- (4) Blades J.C., Meaburn J., 1980, MNRAS, 190, P59
- (5) Cami J., Sonnentrucker P., Ehrenfreund P., Foing B.H., 1997, A&A, 326, 822
- (6) Cami J., Salama F., Jiménez-Vicente J., Galazutdinov G.A., Krełowski J., 2004, ApJ, 611, L113
- (7) Cox N.L.J., 2011, in: The Molecular Universe, eds. J. Cernicharo & R. Bachiller, IAUS 280, p.162
- (8) Cox N.L.J., Spaans M., 2006, A&A, 451, 973
- (9) Cox N.L.J., et al., 2006, A&A, 447, 991
- (10) Cox N.L.J., et al., 2007, A&A, 470, 941
- (11) Crawford M.K., Tielens A.G.G.M., Allamandola L.J., 1985, ApJ, 293, L45
- (12) de Boer K.S., Koornneef J., Savage B.D., 1980, ApJ, 236, 769
- (13) Dickey J.M., et al., 2012, PASA, in press (arXiv:1207.0891)
- (14) Ehrenfreund P., et al., 2002, ApJ, 576, L117
- (15) Evans C.J., et al., 2010, ApJ, 715, L74
- (16) Evans C.J., et al., 2011, A&A, 530, A108
- (17) Friedman S.D., et al., 2011, ApJ, 727, 33
- (18) Heger M.L., 1922, Lick Obs. Bull., 10, 146
- (19) Heiles C., 1997, ApJ, 481, 193
- (20) Herbig G.H., 1975, ApJ, 196, 129
- (21) Herbig G.H., 1993, ApJ, 407, 142
- (22) Herbig G.H., 1995, ARA&A, 33, 19
- (23) Hobbs L.M., et al., 2008, ApJ, 680, 1256
- (24) Hobbs L.M., et al., 2009, ApJ, 705, 32
- (25) Hutchings J.B., 1964, Nature, 202, 992
- (26) Kerr T.H., Hibbins R.E., Fossey S.J., Miles J.R., Sarre P.J., 1998, ApJ, 495, 941
- (27) Kim S., Staveley-Smith L., Dopita M.A., Freeman K.C., Sault R.J., Kesteven M.J., McConnell D., 1998, ApJ, 503, 674
- (28) Kim S., Dopita M.A., Staveley-Smith L., Bessell M.S., 1999, AJ, 118, 2797
- (29) Krełowski J., Westerlund B.E., 1988, A&A, 190, 339
- (30) Krełowski J., et al., 1999, A&A, 347, 235
- (31) Léger A., D’Hendecourt L., 1985, A&A, 146, 81
- (32) Lehner N., Staveley-Smith L., Howk J.C., 2009, ApJ, 702, 940
- (33) Marasco A., Fraternali F., Binney J.J., 2012, MNRAS, 419, 1107
- (34) McCall B.J., et al., 2010, ApJ, 708, 1628
- (35) McClure-Griffiths N.M., et al., 2009, ApJS, 181, 398
- (36) McGee R.X., Newton L.M., Morton D.C., 1983, MNRAS, 205, 1191
- (37) Meixner M., et al., 2006, AJ, 132, 2268
- (38) Meixner M., et al., 2010, A&A, 518, L71
- (39) Merrill P.W., 1934, PASP, 46, 206
- (40) Merrill P.W., Wilson O.C., 1938, ApJ, 87, 9
- (41) Mokiem M.R., et al., 2007a, A&A, 465, 1003
- (42) Mokiem M.R., et al., 2007b, A&A, 473, 603
- (43) Morrel N.I., Walborn N.R., Fitzpatrick E.L., 1991, PASP, 103, 341
- (44) Moutou C., Krełowski J., D’Hendecourt L., Jamroszczak J., 1999, A&A, 351, 680
- (45) Nasoudi-Shoar S., Richter P., de Boer K.S., Wakker B.P., 2012, A&A, 520, A26
- (46) Nidever D.L., Majewski S.R., Burton W.B., 2008, ApJ, 679, 432
- (47) Olsen K.A.G., Zaritsky D., Blum R.D., Boyer M.L., Gordon K.D., 2011, ApJ, 737, 29
- (48) Pan K., Federman S.R., Sheffer Y., Andersson B.-G., 2005, ApJ, 633, 986
- (49) Pasquini L., et al., 2002, Msngr, 110, 1
- (50) Raimond S., Lallement R., Vergely J.-L., Babusiaux C., Eyer L., 2012, A&A, 544, A136
- (51) Richter P., Sembach K.R., Howk J.C., 2003, A&A, 405, 1013
- (52) Richter P., de Boer K.S., Widmann H., Kappelmann N., Gringel W., Grewing M., Barnstedt J., 1999, Nature, 402, 386
- (53) Routly P.M., Spitzer L., 1952, ApJ, 115, 227
- (54) Sandstrom K.M., et al., 2012, ApJ, 744, 20
- (55) Sarre P.J., 2006, Journal of Molecular Spectroscopy, 238, 1
- (56) Sarre P.J., Miles J.R., Kerr T.H., Hibbins R.E., Fossey S.J., Somerville W.B., 1995, MNRAS, 277, L41
- (57) Smoker J.V., Bagnulo S., Cabanac R., Keenan F.P., Fossati L., Ledoux C., Jehin E., Melo C., 2011, MNRAS, 414, 59
- (58) Snow T.P., Welty D.E., Thorburn J., Hobbs L.M., McCall B.J., Sonnentrucker P., York D.G., 2002a, ApJ, 573, 630
- (59) Snow T.P., Zukowski D., Massey P., 2002b, ApJ, 578, 877
- (60) van der Zwet G.P., Allamandola L.J., 1985, A&A, 146, 76
- (61) van Dishoeck E.F., Black J.H., 1989, ApJ, 340, 272
- (62) van Loon J.Th., van Leeuwen F., Smalley B., Smith A.W., Lyons N.A., McDonald I., Boyer M.L., 2007, MNRAS, 382, 1353
- (63) van Loon J.Th., Smith K.T., McDonald I., Sarre P.J., Fossey S.J., Sharp R.G., 2009, MNRAS, 399, 195
- (64) van Loon J.Th., et al., 2010a, AJ, 139, 68
- (65) van Loon J.Th., Oliveira J.M., Gordon K.D., Sloan G.C., Engelbracht C.W., 2010b, AJ, 139, 1553
- (66) Vink J.S., de Koter A., Lamers H.J.G.L.M., 2001, A&A, 369, 574
- (67) Vladilo G., Crivellari L., Molaro P., Beckman J.E., 1987, A&A, 182, L59
- (68) Vos D.A.I., Cox N.L.J., Kaper L., Spaans M., Ehrenfreund P., 2011, A&A, 533, A129
- (69) Wakker B.P., Mathis J.S., 2000, ApJ, 544, L107
- (70) Walborn N.R., 1980, ApJ, 235, L101
- (71) Walborn N.R., Smith N., Howarth I.D., Vieira Kober G., Gull T.R., Morse J.A., 2007, PASP, 119, 156
- (72) Walker G.A.H., 1963, MNRAS, 125, 141
- (73) Welty D.E., Federman S.R., Gredel R., Thorburn J.A., Lambert D.L., 2006, ApJS, 165, 138
- (74) Whittet D.C.B., 1992, in: Dust in the Galactic Environment, IOP Publishing, p.129
- (75) Wolfire M.G., McKee C.F., Hollenbach D., Tielens A.G.G.M., 2003, ApJ, 587, 278
- (76) Wong T., et al., 2011, ApJS, 197, 16
Appendix A Line profile fitting
The constraints on the fits to the DIBs are summarised in Table A1. The 4428 Å DIB was best fit with Lorentzian profiles, to account for the broad wings, whilst the 5780 and 5797 Å DIBs and the 6614 Å DIB were better fit with Gaussian profiles, corroborating the findings by Snow et al. (2002b) for the 4428 and 6614 Å DIBs.
The 4428 Å DIB is troubled by He i lines at either side (at rest wavelengths of 4387 and 4437 Å, respectively), limiting the wavelength range within which we fit the spectrum and thereby affecting the accuracy of the continuum level determination. Also, sharp spectral lines occur in many B-type spectra close to the centroid of the 4428 Å DIB; we simultaneously fit the three strongest of these lines using Gaussians profiles (they are identified with red-shifted O ii lines at rest wavelengths of 4415 and 4417 Å, and a red-shifted He i line at a rest wavelength of 4437 Å, respectively). Other lines could potentially overlap with the DIBs – e.g., the N ii at a rest wavelength of 6610 Å could interfere with the Galactic 6614 Å DIB; note also that binary motion could cause line shifts that differ from the systematic velocity of the LMC. However, this was found by visual inspection of all the spectra not to be a major problem.
We decided to fix the position of the Galactic and LMC components of the 4428 Å DIB to Å and Å, and its FWHM to 20 Å, as this dramatically improved the reliability of the fits; this was judged from the much closer resemblance between the 4428 and 6614 Å maps of the LMC component as well as the better agreement between the three stars in common between the Medusa and ARGUS spectra (especially evident for the Galactic component). By doing this, the equivalent width of the 4428 Å DIB has become a proxy for its peak depth. The equivalent width measurements of the DIBs are listed in Tables A2–A4, which are made available electronically at the Centre de Données astronomiques de Strasbourg (CDS).
| DIB | function | (Å) | (Å) | FWHM (Å) |
|---|---|---|---|---|
| 4428 | Lorentzian | 4428.5 (fixed) | 4432.5 (fixed) | 20 (fixed) |
| 5780 | Gaussian | 5781.1–5781.9 | 5785.5–5786.3 | 1.32–2.45 |
| 5797 | Gaussian | 5797.3–5797.7 | 5802.3–5802.7 | 0.75–1.13 |
| 6614 | Gaussian | 6613.4–6614.4 | 6619.4–6620.4 | 0.59–1.77 |
What constitutes a “reasonable” fit is somewhat arbitrary. However, when selecting on the basis of the r.m.s. value in the normalisation intervals it became clear upon inspection of the spectra and the fits that spectra with r.m.s. % almost never showed convincing fits except in rare cases of very strong absorption. Vice versa, most spectra with r.m.s. % showed believable fits to absorption features at the expected places. Visual inspection of all fits was necessary to remove a small number of fits that were clearly affected by spectral artefacts or very strong emission lines (a clipping procedure limiting the fitted data to within % and +3% of the continuum level rendered the fitting already insensitive to sharp spikes). This yielded a 98% success rate for the 4428 Å DIB in the Medusa spectra, 95% in the ARGUS spectra and 96% in the UVES spectra; the Galactic and LMC components of the 6614 Å DIB in the Medusa spectra were fit at a 76% and 82% success rate, respectively. The values in Tables A2–A4 are flagged accordingly. However, an “accepted” fit (flag 1) does not imply a detection; where both value and error are zero it means the fitting routine did not return a solution for absorption that resembled the target spectral feature.
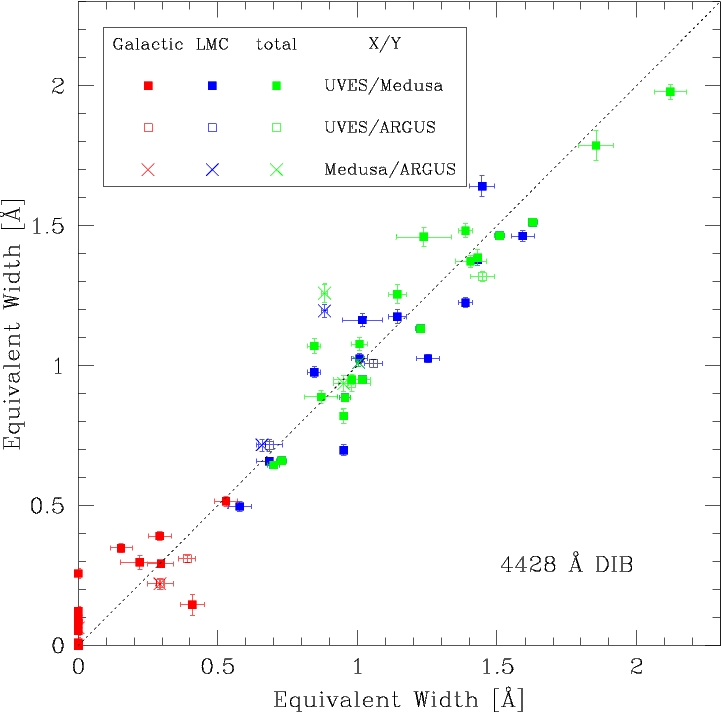
For the sightlines in common between the UVES, Medusa and ARGUS spectra, the equivalent width of the 4428 Å DIB is measured rather consistently (Fig. A1). This is true even for most of the Galactic sightlines. The scatter does reduce for the combined (LMC + Galactic) absorption, confirming the suspicion we raised above. The remaining scatter suggests that the errorbars on the individual measurements are probably a little optimistic.
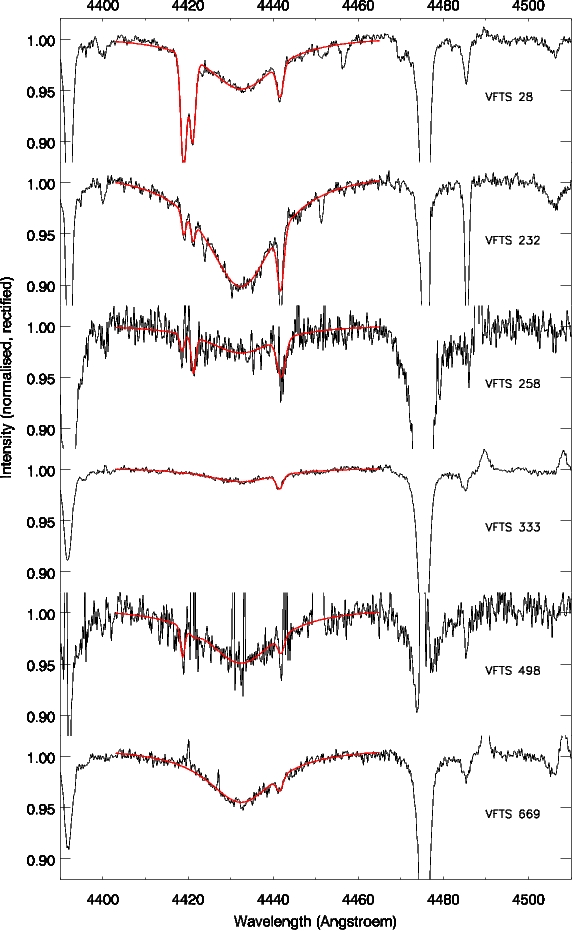
To give an impression of the quality of the data and of the fits to the DIBs, in Figure A2 we show six examples of both good and poor signal-to-noise Medusa spectra, around the 4428 and 6614 Å DIBs (for the same sightlines). To show the success with which the fitting algorithm measures the DIB in the presence of challenges we chose to show a spectrum of a B-type star with strong O ii lines (VFTS 28), a very noisy spectrum (VFTS 258) and a noisy and good signal-to-noise spectrum with spikes (VFTS 498 and 689, respectively) as well as a good signal-to-noise spectrum but with very weak DIBs (VFTS 333); we also show the spectrum of the star displaying the strongest DIBs in our sample, VFTS 232.
| VFTS | 4428 Å DIB | 6614 Å DIB | ||||||||
|---|---|---|---|---|---|---|---|---|---|---|
| EWG (Å) | fG | EWL (Å) | fL | r.m.s. | EWG (Å) | fG | EWL (Å) | fL | r.m.s. | |
| 542 | 1 | 1 | 0.0025 | 1 | 1 | 0.0032 | ||||
| VFTS | EWG (Å) | fG | EWL (Å) | fL | r.m.s. |
|---|---|---|---|---|---|
| 542 | 1 | 1 | 0.0031 |
| VFTS | 4428 Å DIB | 5780 Å DIB | 5797 Å DIB | ||||||||||||
|---|---|---|---|---|---|---|---|---|---|---|---|---|---|---|---|
| EWG (Å) | fG | EWL (Å) | fL | r.m.s. | EWG (Å) | fG | EWL (Å) | fL | r.m.s. | EWG (Å) | fG | EWL (Å) | fL | r.m.s. | |
| 542 | 7 | 1 | 7 | 1 | 0.0165 | 5 | 1 | 3 | 1 | 0.0266 | 3 | 1 | 0 | 1 | 0.0266 |