Laboratory measurement of optical constants of solid SiO and application to circumstellar dust
Abstract
Context. Silicate minerals belong to the most abundant solids that form in cosmic environments. Their formation requires that a sufficient number of oxygen atoms per silicon atom is freely available. For the standard cosmic element mixture this can usually be taken for granted, but this becomes a problem at the transition from the oxygen rich chemistry of M-stars to the carbon rich chemistry of C-stars. In the intermediate type S-stars most of the oxygen and carbon is consumed by formation of CO and SiO molecules, and left-over oxygen to build SiO4-tetrahedrons in solids becomes scarce. Under such conditions SiO molecules from the gas phase may condense into solid SiO. The infrared absorption spectrum of solid SiO differs from that of normal silicates by the absence of Si-O-Si bending modes around m while the absorption band due to Si-O bond stretching modes at about m is present. Recently it has been reported (Hony et al. 2009) that exactly this particular characteristics is observed in a number of S-star spectra.
Aims. We demonstrate that this observation may be explained by the formation of solid SiO as a major dust component at C/O abundance ratios close to unity.
Methods. The infrared absorption properties of solid SiO are determined by laboratory transmission measurements of thin films of SiO produced by vapour deposition on a Si(111) wafer. From the measured spectra the dielectric function of SiO is derived by using a Brendel-oscillator model, particularly suited for the representation of optical properties of amorphous materials. The results are used in model calculations of radiative transfer in circumstellar dust shells with solid SiO dust in order to determine the spectral features due to SiO dust.
Results. Comparison of synthetic and observed spectra shows that reasonable agreement is obtained between the main spectral characteristics of emission bands due to solid silicon monoxide and an emission band centred on 10 m, but without accompanying 18m band, observed in some S-stars. We propose that solid SiO is the carrier material of this m spectral feature.
Key Words.:
circumstellar matter – stars: mass-loss – stars: chemically peculiar – stars: AGB and post-AGB1 Introduction
Silicon monoxide, SiO, is one of the most abundant and most stable molecules encountered in space. It is found to be present in many astronomical objects by observing its infrared molecular bands. Usually (but not exclusively) it is found in objects where rather warm ( K) gaseous material exists, for instance in circumstellar dust shells. At lower temperatures the SiO molecules tend to associate with Mg, Fe, and O (available as H2O) from the gas-phase to form solid magnesium-iron-silicates – the main components of cosmic dust – and some additional minor condensed phases bearing also Al and/or Ca. Alternatively the SiO molecules may also condense to a solid material for their own, the silicon monoxide solid. Solid SiO is a well known material of significant technical importance, as it is widely used for optical purposes as anti-reflection coating. Despite of its technical use, the properties of SiO are not well known, and its lattice structure remains enigmatic.
In astrophysics, solid SiO has not yet been detected as a separate dust component. In the early discussions on the nature of ISM dust it was taken into consideration as possible ISM dust component (Duley et al. 1978; see also Millar 1982, and references therein), until amorphous silicates (olivine, pyroxene) were identified as carriers of the observed infrared features at 9.7 m and m. The formation of silicon monoxide has been thought, however, to be an important intermediate step in the formation of silicate dust for the following reasons:
-
•
The back-bone of the silicate mineral structure are SiO4-tetrahedra with four oxygen atoms attached to a silicon atom. The silicate minerals detected in space are usually identified by the stretching and bending vibrational modes of this particular structure.
-
•
On the molecular level there exists no species with comparable structure as free gas-phase species.
It is necessary, therefore, that the initial stages of the condensation of silicates involve some different kind of material. Because of the high abundance of SiO molecules in matter with standard cosmic elemental abundances it has been speculated since the early 1980s that condensation of SiO may be the very initial step of silicate formation (Nuth III & Donn 1982; Gail & Sedlmayr 1986, 1998a, 1998b; Nuth III & Ferguson 2006). It is assumed that initially silicon monoxide clusters are formed that serve as seed particles for growth of the silicates.
There exists, however, the possibility that in a number of cases the silicon monoxide seeds finally grow to a dust species of their own. The formation of silicates requires the free availability of sufficient oxygen to build the SiO4-tetrahedrons in silicates. This is usually not a problem since the oxygen abundance in the standard cosmic element mixture is about twice the carbon abundance and about the sixteen-fold of the silicon abundance (cf. Lodders et al. 2009). Even after formation of the extremely stable CO and SiO molecules sufficient oxygen remains available to form the SiO4-tetrahedra of silicate minerals from SiO. However, this does not hold during the whole lifetime of stars. During the evolution of low and intermediate mass stars on the asymptotic giant branch (AGB) the C/O abundance ratio stepwise increases once “third dredge-up” starts to operate. This drives in a number of steps the C/O abundance ratio to values exceeding unity, thereby passing through a stage where the C/O ratio is close to unity. During this stage the stars show the characteristic chemical peculiarities of the S-stars. Then almost all oxygen is used up by the formation of CO and SiO, and with increasing C/O abundance ratio only a decreasing fraction of the SiO molecules can finally be converted into silicate dust because of the decreasing fraction of oxygen left over after SiO and CO formation. Since it is possible to form a solid material with chemical composition SiO by condensation of SiO vapour, there arises the possibility to form such kind of material in stellar outflows from S-stars where due to “third dredge-up” the available oxygen becomes scarce.
Recently some observational results for infrared emission from dust in S-stars have been published which show spectral characteristics that cannot be explained by the standard amorphous silicate dust (Hony et al. 2009; Sacuto et al. 2008). For these stars the emission feature at about 10 m is as strong as usual, but the concomitant feature of silicate dust at 18 m is very weak or even seems to be missing at all. By inspection of the spectra published by Chen & Kwok (1993) one finds some additional objects sharing this special property. In our opinion this property is a clear signature of the emission from solid silicon monoxide dust. In this material one has Si-O bonds as in silicates, which give rise to the stretching vibrations that are the origin of the broad 10 m feature of amorphous silicates, but one has no Si-O-Si bending modes as in SiO4-tetrahedra which are the origin of the 18 m feature of silicates. Theoretically, this feature does not exist for solid silicon monoxide, but in practice, since solid silicon monoxide is prone to disintegrate into silicon nano-clusters and SiO2 (e.g. Hohl et al. 2003; van Hapert et al. 2004), the 18 m feature is not completely absent but weak. In S-stars with some oxygen left over after formation of CO and SiO molecules part of the SiO may form some silicate material while the bulk of the SiO molecules condense into solid silicon monoxide. This would give rise to an unusually weak 18 m feature compared to the 10 m feature.
In this paper we attempt to show that the observational finding of the existence of S-stars with strong 10 m emission feature and weak or absent 18 m feature can be explained by condensation of solid silicon monoxide in their outflows at C/O abundance ratios close to unity where chemically available oxygen to form silicates is lacking. For this purpose we calculate radiative transfer models of circumstellar dust shells with silicon monoxide dust and compare the resulting spectra with published spectra of S-stars.
For these radiative transfer calculations one needs the dielectric function of solid silicon monoxide to calculate the extinction coefficient. Because this material is used for optical purposes the complex index of refraction is known from the middle infrared to the extreme UV and data are listed, e.g., in Palik (1985). More recent determinations are given by Tazawa et al. (2006). During the course of our laboratory studies on materials of astrophysical interest (Klevenz 2009) the far infrared optical properties have been determined with high accuracy. We briefly describe in this paper the measurements and their results. In particular the dielectric function is determined by fitting a Brendel-oscillator model (Brendel & Bormann 1992) to experimental results. This model is particularly suited to describe infrared optical properties of amorphous materials in contrast to the widely used Lorentz-oscillator model that is better suited for crystalline materials. The 10 m feature of silicon monoxide is always diffuse like the corresponding feature of amorphous silicate materials. The lattice structure of solid silicon monoxide is not well known, but a crystalline phase seems not to exist.
The plan of this paper is as follows. In Sect. 2 we briefly describe our laboratory measurements on the optical properties of solid SiO and the results for the dielectric function. In Section 3 we give our arguments why solid SiO could form in outflows from S-stars. Section 4 describes the radiative transfer models and gives the results.
2 Optical properties of SiO
To study the infrared (IR) optical properties of SiO spectroscopic transmittance measurements were performed in situ on condensed SiO films produced by evaporation under UHV conditions. The dielectric function of solid SiO is derived via Brendel-oscillator fits to the experimental IR spectra.
2.1 Experimental setup
The experiments were performed under UHV conditions (base pressure mbar). IR spectra were taken in the range between 450 cm-1 and 5000 cm-1 with a Fourier-transform IR spectrometer (Bruker Tensor 27 with mercury-cadmium-telluride detector and N2 purged beam path). The IR spectral measurements were performed in transmittance geometry at normal incidence of light. A floating zone Si(111) wafer with dimensions of mm2 and a thickness of 0.525 mm and high resistivity was used as transparent substrate which was cleaned by heating up to 1000∘C in UHV to remove the natural oxide layer. Spectra were taken in situ, i.e., during the growth of the evaporated film on the substrate (spectral resolution of 4 cm-1), and normalized to the spectrum of the bare Si(111) taken directly before deposition. This method allows to monitor the whole growth process and to detect changes due to the film growth.
Commercial SiO (Noah Technologies Corporation, Silicon Monoxide, SiO, 99.99% pure, -325 mesh, CAS no. 10097-28-6) was evaporated from a tantalum Knudsen cell heated by electron bombardment. The background pressure measured during evaporation away from the SiO molecular beam did not exceed mbar. The SiO deposition rate (about 0.8 nm/min) was determined before and after the spectroscopic experiment with a quartz crystal microbalance with a relative error up to 5%. This error is caused by the uncertainty in the density of the evaporated film in the thickness calculation for which the density of bulk SiO (2.18 g/cm3) was taken (Hass & Salzberg 1954). Further experimental details can be found in Klevenz et al. (2010a).
2.2 Results
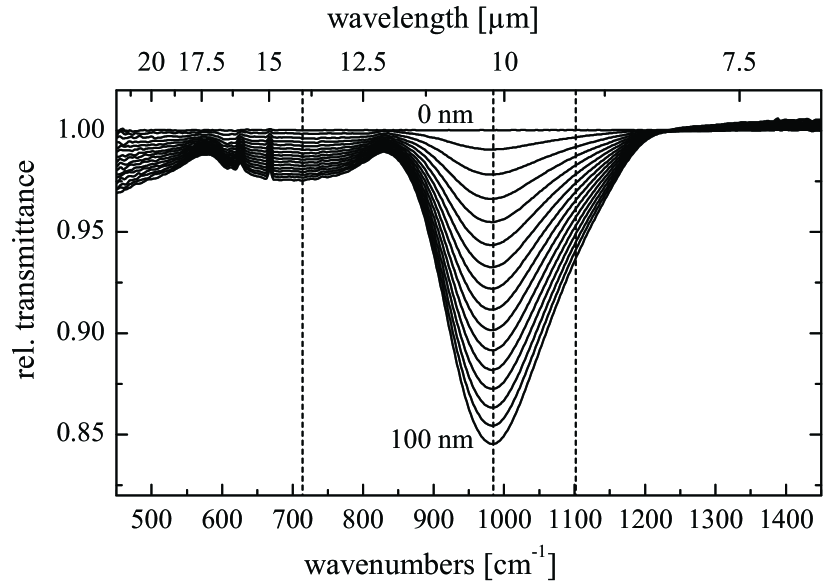
In Fig. 1 relative transmittance spectra of SiO with increasing film thicknesses are shown. The films were produced by SiO evaporation and subsequent condensation on a Si(111) substrate hold at 300 K. Two broad features develop with growing film thickness. The stronger one at 982 cm-1 is assigned to the asymmetric stretching mode of the oxygen atom in a Si-O-Si bridge against the Si-neighbor atoms (Philipp 1971; Chabal et al. 2002; Queeney et al. 2004; Cachard et al. 1971; Lehmann et al. 1983, 1984). The much weaker structure at approximately 713 cm-1 corresponds to the Si stretching mode, a mode with dominating Si displacement (Lehmann et al. 1983), sometimes called “bending” mode in the literature. The third strong peak caused by the rocking mode at about 380 cm-1 (Philipp 1971) was out of our measurement range. It is important to note that already from 1 nm the IR spectral features of the evaporated SiO films do not change anymore (Klevenz et al. 2010b). Accordingly, the IR dielectric function of the evaporated film already resembles that of bulk SiO (Hjortsberg & Granqvist 1980; Tazawa et al. 2006; Klevenz et al. 2010a).
2.3 Dielectric function
For thin dielectric films with the thickness of the film much smaller than the wavelength (), approximate formulas for the transmittance can be derived based on the Fresnel equations (Berreman 1963). For a thin layer on a thick (non-interfering) substrate the normal transmittance () is given by (Lehmann 1988; Teschner & Hübner 1990)
| (1) |
with , as the dielectric function of the substrate and as the dielectric function of the film. In transmittance measurements under normal incidence () therefore only the transverse optical (TO) modes with frequency at the maximum of the imaginary part of the dielectric function and with a dynamic dipole moment parallel to the surface can be observed.
To determine the dielectric function of SiO in the IR from such thin film measurements an appropriate model for the dielectric function has to be used. A simple Lorentz-oscillator model can not be applied in our case due to the amorphous character of the film. The model introduced by Brendel & Bormann (1992) accounts for the amorphous structure of a material by assuming that the different IR modes can be represented by Lorentz-oscillators, but with randomly shifted resonance frequencies that are distributed according to a Gaussian probability distribution. The dielectric function in the IR therefore is assumed in this model to be given by the relation
| (2) |
It consists of a dielectric background and distributions of Lorentz oscillators with resonance frequencies , damping constants , plasma frequencies , and with standard deviations of the Gaussian probability distributions.
There is a close relationship of the Brendel oscillator model to the well known Voigt function for the profiles of velocity broadened spectral lines. This is briefly discussed in Appendix B.
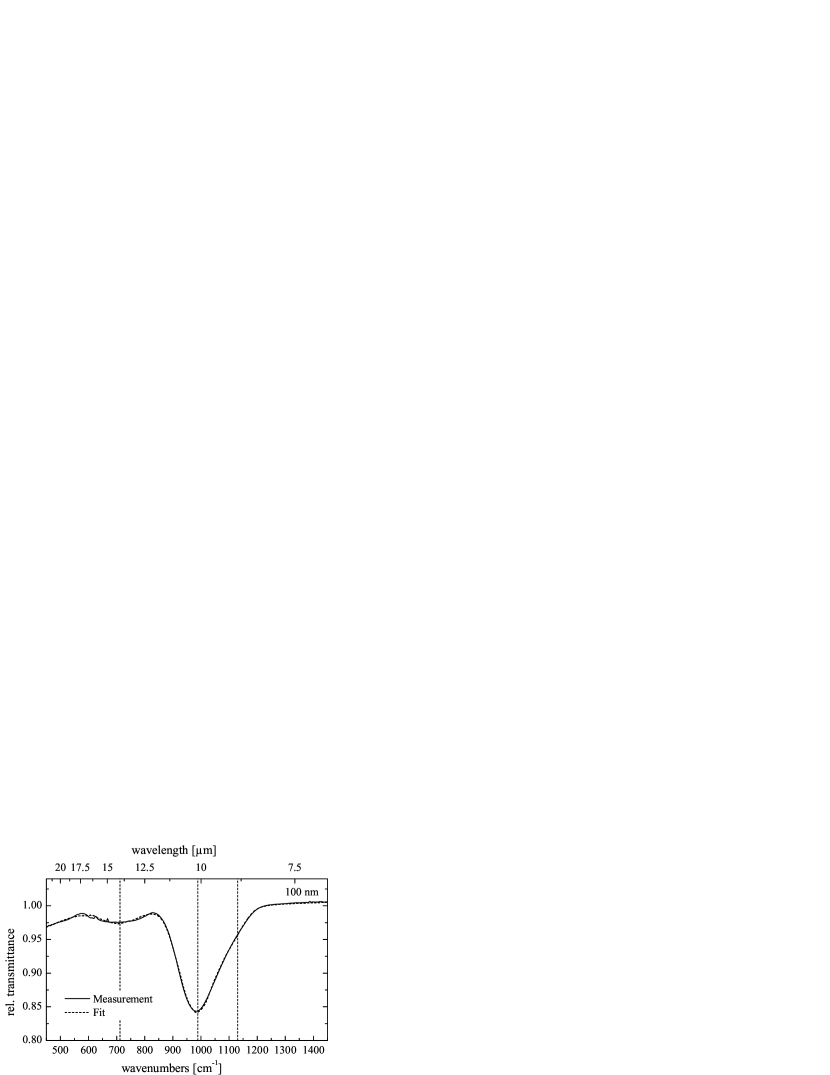
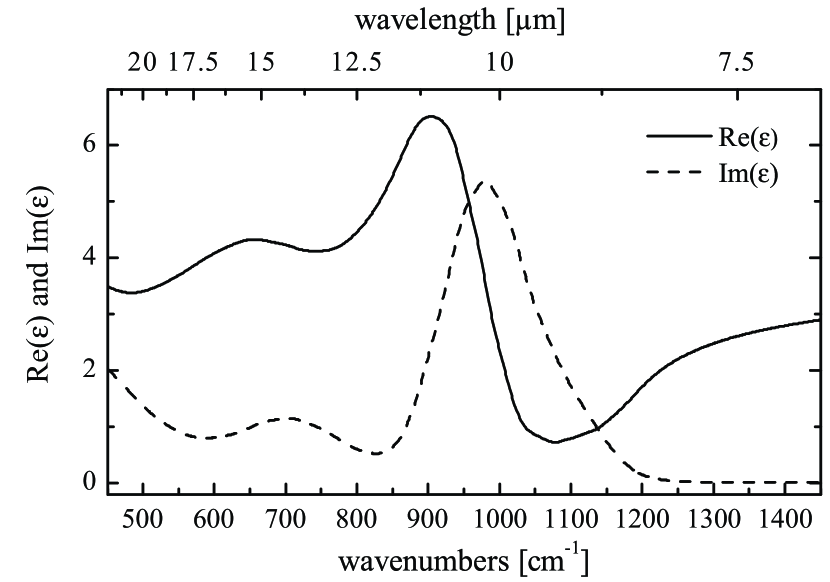
The last spectrum of Fig. 1 was fitted with such a Brendel dielectric function using four oscillators, similar to a procedure for SiO2 (Kirk 1988), which results in very good agreement (see Fig. 2). We performed the spectral fits in the range between 500 cm-1 and 1500 cm-1 using the software package SCOUT (Theiss 2009). For the high frequency limit of the dielectric function a value of 3.61 was taken from literature (Hjortsberg & Granqvist 1980). Since the oscillator damping constant cannot properly be determined from fits to vibration spectra of disordered solids (cf. Ishikawa et al. 2000) we fixed the value of to the resolution of our measurement of 4 cm-1. Nearly the same kind of procedure is already reported in the literature (Ishikawa et al. 2000; Brendel & Bormann 1992; Grosse et al. 1986; Naiman et al. 1985). The result for the dielectric function of SiO in the IR is shown in Fig. 3, and our best fit for the oscillator parameters is given in Table 1.
| Osc. | ||||||||
|---|---|---|---|---|---|---|---|---|
| 1 | 1101 | 305 | 44.9 | 4 | ||||
| 2 | 982 | 699 | 57.4 | 4 | ||||
| 3 | 713 | 298 | 73.4 | 4 | ||||
| 4 | 380 | 461 | 127.1 | 4 | ||||
| 3.61 |
These results are obtained for a substrate temperature of 300 K. Other substrate temperatures than 300 K result in slightly shifted peak positions. At a substrate temperature of 93 K the position of the asymmetric stretching mode is at 969 cm-1, while for 300 K it is at 982 cm-1. For temperatures higher than 300 K the peak shifts to higher wavenumbers (Klevenz 2009). The shift to higher wavenumbers can be explained by a decomposition into Si and SiO2 that accelerates with temperature. The effects of the substrate temperature on the condensed SiO film and the dielectric function of SiO will be discussed in detail in a forthcoming paper. In our present communication the dielectric function obtained at 300 K is used.
3 Astrophysical applications
In this section we discuss the possibility that solid silicon monoxide might be an important dust species in the dust shells of S-stars.
3.1 S-stars
Low and intermediate mass stars from the range of initial masses below evolve till the very end of their lives to the thermally pulsing Asymptotic Giant Branch (TP-AGB) where they are composed of an electron-degenerated core of carbon and some oxygen, resulting from He-burning, an overlying layer of mainly He, resulting from H-burning via the CNO-cycle, and an enormously extended hydrogen rich envelope. On the TP-AGB the stars alternatively burn either H in a shell source at the interface between the H-rich envelope and the He layer for a period of several thousand years, or He in a shell-source at the interface between the He layer and the carbon-oxygen core for a period of about 200 yr. During the short burning phase of He (the thermal pulse) the He layer is for part of the time fully convective from bottom to top and distributes freshly synthesized carbon from the He-burning shell at the bottom of the He layer over the whole layer. Somewhat later in the pulse phase, the convection zone of the fully convective hydrogen envelope briefly dips into the upper parts of the He layer and mixes some carbon-rich material into the outer envelope. As a result, after each thermal pulse the carbon abundance of the envelope increases stepwise. The oxygen abundance in the envelope remains almost unchanged by this process because only very little oxygen is synthesized by He-burning in TP-AGB stars. Thus, the carbon to oxygen abundance ratio C/O in the envelope changes from its initial value of , corresponding to the C/O ratio of the cosmic standard element mixture (see, e.g., Lodders et al. 2009), to C/O ratios far exceeding a value of unity.
For most of the stars on the TP-AGB the C/O abundance ratio falls — after mixing carbon from the core into the envelope during a thermal pulse — for one or two inter-pulse phases into the critical range between about 0.9 and 1.0 where the chemical composition of the material in the stellar photosphere dramatically changes from an oxygen-compound dominated composition for a C/O abundance ratio below 0.9 and a hydrocarbon-dominated composition for a C/O abundance ratio exceeding 1.0. This switching of the chemical composition is brought about by the extraordinary stability of the CO molecule that almost completely consumes by its formation the less abundant of the two elements C and O. Only part of the TP-AGB stars leap over the critical range of C/O abundance ratios during a single thermal pulse.
In the intermediate abundance range of C/O ratios between 0.9 and 1.0 the stellar spectrum is dominated by molecular bands of some low-abundance elements that are neither seen in M-Stars (C/O ratio ) nor in C-stars (C/O ratio ). These stars are the so called S-stars. They are much less abundant than M-stars or C-stars since stars on the TP-AGB suffer numerous thermal pulses, but only during one or two inter-pulse phases they are S-stars.
For these S-stars the material that outflows from the stellar surface neither can form the silicate dust that is seen in circumstellar dust shells around M-stars, nor the graphite and SiC dust seen in dust shells around C-stars. This is because the excess oxygen over carbon, that is not bound in CO molecules, is too rare to combine with all of the silicon to the SiO4-tetrahedrons that form the back-bone of silicate minerals. At the same time no excess carbon is available to form solid carbon.
The details of the chemistry of dust formation in outflows from S-stars is discussed in Ferrarotti & Gail (2002). Because of the very high bond energy of the SiO molecule — not as high as for CO, but also exceptionally high — the silicon is bound in this molecule and the excess of the oxygen not bound in SiO and CO forms H2O. Some quantities of silicate dust may be formed in outflows from S-stars if the C/O abundance ratio is not too close to unity, because then SiO molecules react with the left over H2O and with Mg (and/or Fe). Indeed, weak emission bands showing the characteristic two peaks around 9.7 m and 18 m are seen in the infrared spectrum of a number of S-stars (Chen & Kwok 1993; Lloyd Evans & Little-Marenin 1999). It is argued by Ferrarotti & Gail (2002) that also iron dust may be formed and may be an abundant dust species for S-stars. This dust would be hard to detect observationally for optically thin dust shells, since its smooth and featureless extinction would act as a more-or-less gray opacity source. For optically thick shells it is likely that this is mistaken to be carbon dust because of almost indistinguishable infrared extinction properties of iron and carbon dust.

3.2 Why solid silicon monoxide?
If the abundance of excess oxygen not bound in CO and SiO tends to zero for C/O abundance ratios approaching unity, there exists the possibility that SiO molecules start to condense as a solid of their own. This has not yet seriously be taken into account as a dust component in circumstellar dust shells, though it was discussed several times whether it could be the first condensate to form the necessary seed particles for silicate dust formation (Nuth III & Donn 1982; Gail & Sedlmayr 1986, 1998a, 1998b; Nuth III & Ferguson 2006). This is a crucial question for cosmic dust formation since it is not possible to form the necessary seed particles for silicate dust growth from a material with the composition and lattice structure of one of the many silicate minerals.
The main reason why solid SiO was not considered as one of the major dust materials in circumstellar shells was the seemingly high vapour pressure from which one predicts a rather low condensation temperature under the low pressure conditions of circumstellar dust shells. New determinations of the vapour pressure of solid SiO (Ferguson & Nuth III 2008; Klevenz 2009) have now shown that the older measurement were seriously in error and strongly overestimated the vapour pressure. The new results of Ferguson & Nuth III (2008) and our own results (Klevenz 2009) can be approximated by a vapour pressure formula for the equilibrium pressure of SiO molecules over solid silicon monoxide
| (3) |
where the pressure is in units of dyn cm-2 (as usual in astrophysics). Our results (Klevenz 2009) extend the range of measured vapour pressures down to the pressure range relevant for circumstellar dust shells. No extrapolation of vapour pressures measured at higher temperatures in the laboratory to significantly lower temperatures is required. The details will be discussed in a separate paper.
Figure 4 shows the resulting stability limit against evaporation in chemical equilibrium for the astrophysically important silicates, for solid iron, and for solid SiO, calculated by using the new results for the vapour pressure of solid SiO and thermochemical data from Barin (1995) for the other materials, for the case of standard cosmic element abundances (Asplund et al. 2005; Lodders et al. 2009). At C/O abundance ratios close to unity no silicates can be formed in S-stars because of a lack of freely available oxygen to convert a significant fraction of the SiO molecules from the gas phase into the SiO4-tetrahedrons in silicate minerals (e.g., for a C/O ratio of 0.95 only about 20% of the Si can condense as silicate dust). Then the SiO molecules may condense instead into solid SiO. At a typical pressure of bar in the dust condensation layer of circumstellar dust shells (see Fig. 4) the SiO would become stable against evaporation at about 800 K. This is high enough that such dust could be observed as warm dust in a circumstellar dust shell. Hence solid SiO is a candidate dust material to be observed in S-stars.111A lack of oxygen to form normal silicates may also be encountered in massive supergiants if the outer layers are peeled off by mass-loss and material that has burned H via the CNO-cycle appears at the surface. Then the O abundance may drop to values of the order of the Si abundance and solid SiO may form also in the outflows from such stars.
Whether this material really forms can be tested observationally. The absorption properties of solid SiO are sufficiently different from normal silicate materials that they can be discriminated by their spectral features. Amorphous olivine and pyroxene both have two strong absorption features centred on 9.7 m and 18 m, that are usually observed as emission features in the infrared spectra from circumstellar dust shells. For SiO the strong feature at 18 m is missing because this corresponds to rocking modes in the SiO4-tetrahedron, but a strong feature at about 10 m is present because this originates from Si-O bond stretching vibrations. Hence, the presence of a strong m feature without a strong 18 m feature is diagnostic for solid SiO.
These characteristics have, indeed, been observed for a number of S-star spectra (Hony et al. 2009) and one may speculate that they result from solid SiO as a major dust component in such dust shells. In order to test this hypothesis we have performed radiative transfer calculations using our new results for the dielectric function of SiO.
| species | El. | |||
|---|---|---|---|---|
| SiO | 44.09 | 2.13 | Si | |
| iron | 55.85 | 7.87 | Fe | |
| olivine | 172.2 | 3.81 | Si | |
| pyroxene | 116.2 | 3.61 | Si |
3.3 Growth of silicon monoxide grains
Now we turn to the question whether growth of silicon monoxide is kinetically possible. Consider the simple approximation that a spherical dust grain co-moving with the outflowing gas collects SiO molecules from the gas phase. For simplicity we neglect evaporation. The equation of growth of radius for a single grain is
| (4) |
if we introduce by dd the radial coordinate instead of time as independent variable, being the outflow velocity.
The meaning of the quantities in the growth equation is as follows: is the volume of one chemical formula unit in the condensed phase
| (5) |
Here is the atomic weight of the condensed phase and its mass-density. Numerical values are given in Table 2.
The quantity is the growth coefficient. This seems to be first measured by Gunther (1958) who found a rather small value of in the temperature range 1 200 K … 1 500 K. Rocabois et al. (1992) made a new determination of the vapour pressure and of the evaporation coefficient of SiO and found that their results for can be approximated by
| (6) |
in the temperature range 1 175 K to 1 410 K. Essentially the same results for are found by Ferguson & Nuth III (2008). Extrapolating these results down to a temperature of 800 K results in . This value will be used in the following considerations.
The quantity is the particle density of the growth species. If we concentrate on the initial growth phase where not yet much of the growth species is consumed from the gas phase, we can approximate by
| (7) |
where is the element abundance of the element (Si in our case) that determines the gas-phase abundance of the growth species. The second quantity on the r.h.s. is the density of H nuclides in a spherically symmetric, stationary outflow with velocity and mass-loss rate .
The quantity
| (8) |
is the thermal velocity of the growth species (SiO molecules in our case) and their molecular weight, while
| (9) |
is a correction factor for particle drift relative to the gas with relative velocity . If the particle drift is supersonic with respect to the thermal velocity of the growth species (not the carrier gas!); then .
Typical values of all these quantities required for calculating SiO growth are given in Table 3.
| Quantity | unit | value |
|---|---|---|
| cm3 | ||
| 44.09 | ||
| 0.025 | ||
| m | 0.0837 | |
| K | 800 | |
| cm s-1 | ||
| cm |
For the following we assume the outflow velocity in the region where dust grows to be constant. This is not completely correct since dust condensation results in an acceleration of the wind, but the velocity increase is moderate if we consider S-stars. It increases from a velocity of about the sonic velocity (2 km s-1 – 3 km s-1) at the inner edge of the dust shell to the final outflow velocity that is at most 10 km s-1 for S-stars (e.g. Ramstedt et al. 2006). Then integrating from the inner radius of the dust shell, where dust commences to grow, to infinity we obtain
| (10) |
where is the radius of the seed nuclei for dust growth and the grain radius at infinity. This equation requires that the grain radius remains smaller than the maximum radius , attained if all condensable material is condensed, because the consumption of the growth species is neglected in Eq. (4). The maximum possible radius to which a particle may grow in the outflow is given by
| (11) |
if is the number of dust grains per hydrogen nucleus. This quantity is not precisely known; we assume a value of that is a typical value found by observations (Knapp 1985).
We can now write
| (12) |
with
| (13) |
The mass-loss rate has to be smaller than in order that our assumption is valid, that there is no strong depletion of the gas phase from condensable material.
For applying this to silicon monoxide condensation we have to specify the values of , and . All other quantities are given in Table 3. For the outflow velocity we assume a value of , slightly higher than the sound velocity of the gas, since most of the grain growth proceeds before the gas is accelerated to highly supersonic outflow velocities; otherwise further growth is suppressed by rapid dilution of the gas. For we assume a value , corresponding to about 8 stellar radii, see Table 4. For the drift velocity we assume the same value as for since typical drift velocities usually are of the order of the sonic velocity of the gas, except for very high mass-loss rates where they are much less. With these estimated values we obtain
| (14) |
This shows that significant condensation of solid silicon monoxide is kinetically possible, at least for mass-loss rates exceeding about .
The result for depends on the rather uncertain value of that is determined from extrapolating laboratory measured values (which decrease with decreasing temperature) to much lower temperature. The value of 0.025 at 800 K determined this way may be too low. In this case would be overestimated and growth of solid silicon monoxide may be even more favourable as in the estimate above.
4 Radiative transfer model for dust shells
4.1 Opacity
The spectral energy distribution of the emission from circumstellar dust shells is determined by the composition of the dust mixture and the properties of the different dust species. Here we concentrate on the special question whether the unusual feature at 10 m detected in a number of S-stars could result from solid SiO. Since this feature is the most prominent dust feature in the objects where it has been detected so far (Hony et al. 2009), it appears also to be the most abundant dust species in these objects, apart from possible contributions to opacity from dust species with structure-less pure continuous extinction like, e.g., iron dust grains. Therefore we concentrate on models with solid silicon monoxide as the sole dust component.
In our model calculations we assume the opacity in the shell to be completely determined by the dust components; no contribution of the gas phase is considered. The dust particles are assumed to be small spheres of radius . The absorption and scattering coefficients of the different dust components, characterized by an index , then are given by
| (15) |
The quantity is the molecular weight corresponding to the chemical formula of the condensed phase, is the elemental abundance of a characteristic key element that is required to form the condensed phase, and is the fraction of the atoms of this element that is really condensed into the solid phase, is the mass-density of the solid. The quantities are the absorption and scattering efficiencies, divided by the particle radius . These quantities are calculated by means of Mie-theory (see Bohren & Huffman 1983) from the dielectric function of the dust material. The basic data used in the calculation of dust extinction are given in Table 2.
With respect to the particle shape we consider only spherical grains. If the grains would be non-spherical, the absorption band profiles of dust grains would be distorted and their centre would be shifted compared to the case of spherical grains. However, SiO grains formed in laboratory condensation experiments from the gas phase generally seem to be almost spherical (Kamitsuji et al. 2004, their Fig. 1a). Since there is no obvious reason why this should be different for the tiny grains condensed in a circumstellar shell and for nanometre sized laboratory condensed grains, this leaves no room for introducing a distribution of grain shapes like, e.g., the popular continuous distribution of ellipsoids (see, e.g., Bohren & Huffman 1983), in order to account for possible non-sphericity effects.

With respect to the particle size we assume the canonical value of m that seems to be typical for dust grains in circumstellar shells (e.g. Kruszewski et al. 1968; Serkowski & Shawl 2001). Without calculation of a complete model for the dust shell including hydrodynamics and dust growth the grain radius cannot be specified more precisely. Fortunately, for the far infrared spectral region the opacity does not depend on the grain size since circumstellar grains are in any case much smaller than the wavelength in the far infrared. Only for the absorption of stellar radiation there may be a slight dependency on grain size since in the optical and near UV spectral region the grains may satisfy only marginally the condition that particles can be considered as small.
For the purpose of model calculations of dust shells of cool giant stars one needs optical data for the dust species at least in the wavelength range from about 0.4 m to about 100 m in order to cover (i) the wavelength range of the stellar radiation field from the ultraviolet to the mid infrared, and (ii) to cover the wavelength range of dust emission from the shell that ranges from the near infrared to the sub-mm region. Our own measurements discussed in Sect. 2 cover only the mid to far infrared wavelength range. Therefore we have to augment our data by data from other sources to cover also the spectral region from near infrared to UV.
For the visible to far-ultraviolet spectral regions (m) we use data for solid SiO listed in Palik (1985). The real part of the complex index of refraction of our infrared extinction data and the data given in Palik nicely fit in the near infrared where they overlap. The imaginary part becomes very small in the wavelength region below m in our results and it is omitted in the range between 8 and m in the listing of Palik. In this region the absorption coefficient of solid SiO would become many orders of magnitude smaller than the scattering coefficient (or would vanish at all if data of Palik are used). In order to avoid numerical problems in solving the radiative transfer problem we arbitrarily increase the absorption in the wavelength range 0.8 to 8 m by assuming that the dust material contains tiny inclusions of pure iron particulates with a volume filling factor of and calculating the average dielectric function for this composite material from the Maxwell-Garnett mixing rule (cf., e.g., Bohren & Huffman 1983)
| (16) |
where
| (17) |
Here is the bulk dielectric function of the matrix material (solid SiO in our case) and the bulk dielectric function of the material forming the inclusions (solid iron in our case).
This kind of additional absorption by impurities has no influence on the calculated temperature of dust grains since this is determined by the strong absorption at m and also has no influence on the calculated radiation field. It is unlikely that any real dust material is pure and ideally transparent, and nano-sized iron inclusions are a fundamental constituents of, e.g., GEMS (e.g. Bradley 2003).
The resulting mass-absorption and scattering coefficients of small particles of solid SiO are shown in Fig. 5. They are calculated according to Eq. (15) using the data given in Table 2, and calculating optical constants for SiO according to the Brendel-model for the dielectric function of amorphous materials, Eq. (2), using constants from Table 1, and following the procedure described above.
Brendel & Bormann (1992) have shown that the integral in Eq. (2) can be solved in terms of the complex probability functions and Gaussians. We did not make use of this in our opacity calculations but preferred to evaluate the integrals numerically since evaluation of the analytic expressions seems not to offer any particular advantage due to their complicated nature.
For comparison also mass-absorption and scattering coefficients of amorphous olivine and pyroxene are shown,222Data for silicates with , from the Jena-St. Petersburg data basis, accessible via: http:/www.mpia-hd.mpg.de/HJPDOC/ that are the main dust species in circumstellar dust of M-Stars. It is seen that solid SiO indeed shows a prominent absorption feature centred around about 10 m and only some weak structure on the long wavelength side.
| Star | 2 700 | K | |
|---|---|---|---|
| L☉ | |||
| cm | |||
| = 534 | R☉ | ||
| Wind | 10 | km s-1 | |
| — | M☉ a-1 | ||
| Dust | amorphous SiO | ||
| 0.5 | |||
| Shell | depends on | ||
| R∗ | |||
| 750 | K |
4.2 Model calculations
Using the above opacity description we have calculated radiative transfer models of circumstellar dust shells with solid SiO as dust component for a range of mass-loss rates in order to determine the spectral features that would result from solid silicon monoxide. The essentials of the model of the dust shell and of the radiative transfer calculations are briefly described in Appendix A.
A fundamental parameter of the model is the location of the inner boundary of the dust shell, , that depends on the mechanism by which the dust forms from the gas-phase by nucleation and subsequent grain growth. About the details of these processes almost nothing is known and we take recourse to the simple assumption that the dust suddenly appears at some prescribed dust temperature and the fraction of material condensed into the solid phase is constant across the dust shell. This is the kind of approximation on which most existing models of circumstellar dust shells are based on. For the temperature we assume for silicon monoxide dust a value of 750 K because the temperature where solid SiO becomes stable against vaporisation under conditions in circumstellar dust shells is about 800 K, see Sect. 3.2, and because in dust shells this temperature probably is somewhat lower if some super-cooling of the outflowing material should be required for the onset of nucleation and condensation. The old results of Gail & Sedlmayr (1986) seem to indicate a temperature for onset of SiO condensation as low as 600 K, but this cannot be maintained since that calculation is based on older vapour pressure measurements of solid SiO for which it is now known that they have substantially to be revised downwards (Ferguson & Nuth III 2008; Klevenz 2009), which increases the condensation temperature.


For the basic parameters , L∗, we use representative average values, since we do not intend to model individual stars but to perform only some explorative calculations. For the effective temperature of the central star we chose a value of 2 700 K. This seems to be a representative value for S stars (e.g. Kerschbaum & Hron 1998; Kerschbaum 1999). The luminosity is chosen to be , which is typical for stars at the uppermost part of the TP-AGB, where one expects AGB-stars to pass through the stage of S-stars. Observed values given in the literature for stars with substantial mass-loss rate are of this order of magnitude or slightly less (e.g. Jorissen & Knapp 1998; Groenewegen & de Jong 1998; Ramstedt et al. 2006). The observed expansion velocities of S-stars vary between a few km s-1 and about 20 km s-1 and are typically between 5 km s-1 and 10 km s-1 (Groenewegen & de Jong 1998; Ramstedt et al. 2006). We use a value of 10 km s-1. The observed mass-loss rates of S-stars vary over a large range between values as low as a few times to several times (e.g. Groenewegen & de Jong 1998; Ramstedt et al. 2006). We consider as free parameter and calculate models for different values of the mass-loss rate.
The basic model parameters of the calculations are shown in Table 4.

4.3 Results for spectral energy distribution
Models are calculated for mass-loss rates ranging from to with solid silicon monoxide as the sole opacity source. Figure 6 shows the resulting spectral energy distribution of the radiation emitted by the star and its dust shell. Since we assumed for the star a black-body radiation field, the strong structure of cool stellar spectra resulting from molecular absorption bands is missing in our models. This simplifies the identification of the dust features in the spectrum. Emission from warm dust is seen only at wavelengths longer than 8 m since the absorption coefficient of solid SiO is small at shorter wavelengths, see Fig. 5. The prominent absorption band around 10 m is clearly seen as a strong emission feature in all of the spectra. Some structure is seen in the spectrum at longer wavelengths but there is no strong emission feature around 18 m.
This is similar to what is found in a number of S-star spectra. Figure 7 shows a more close-up view of our synthetic spectra in the wavelength region between 5 m and 25 m. For clarity the black body radiation field of the star is subtracted from the synthetic spectra and the resulting emission profiles are shifted relative to each other. These emission profiles reflect the peculiar characteristics of the emission coefficient of amorphous solid silicon monoxide: A strong emission band centred around 10 m and only weak to negligible structure in the 15 m to 25 m wavelength region. Figure 7 also shows one of the two different profiles of the emission bands around 10 m observed in S-stars where no or only a very weak 18 m feature is observed. The data are taken from Fig. 6 of Hony et al. (2009). The profiles in Fig. 7 corresponds to the lower one in Fig. 6 of Hony et al. (2009). This profile is scaled such that the peak value coincides with that of the synthetic emission profiles in our models.
The upper profile of Fig. 6 of Hony et al. (2009) is not considered since it peaks at a significantly higher wavelength. It may result from a different kind of material or a complex superposition of emission bands from a number of materials.
4.4 Discussion
The calculated line profiles show some similarity with the average profile derived in Hony et al. (2009) which peaks at 10 m. The peak position does not match exactly but probably within the limit of errors with which such averaged profiles can be determined. The broad extension to the long wavelength side of the observed profile, however, does not agree with the shape of our profiles. The strong asymmetry of the observed profile is conspicuous. This may have a number of reasons. Either the observed profile is the superposition of the strong 10 m emission feature of solid silicon monoxide with one or more absorption bands of additional dust materials centred around somewhat longer wavelengths, or the properties of solid silicon monoxide deposited under conditions in circumstellar shells differ from that of the material obtained in our laboratory experiments by CVD.
With respect to a contribution by some other materials the most likely candidates are hibonite (CaAl6O19) with a strong absorption band centred on m, spinel (MgAl2O4) with a strong absorption band centred on 13 m, or corundum Al2O3 with a strong and broad band peaking at 11 m. Such materials probably would start to condense at higher temperature than solid SiO because of their lower vapour pressure. They would use up only small amounts of the oxygen because of the much lower element abundances of Al and Ca compared to that of Si. This would not noticeably compete with SiO condensation under conditions where oxygen is scarce. Explorative calculations showed, however, that the hibonite (optical data from Mutschke et al. 2002) and spinel (optical data from Palik 1985) band would always be seen as a separate band, which seems not to be found in spectra of S-stars with a strong 10 m feature. The rather broad corundum feature (optical data from Koike et al. 1995) also cannot explain the strong asymmetry of the observed profile, but it would fill up the dip of the emission profile due to solid SiO at about 12.5 m.
Also forsterite may contribute somewhat to the observed profile and increase its width and asymmetry, because if the oxygen abundance is not close to the critical abundance limit where O is completely bound by CO and by that fraction of Si that is bound in SiO and not in SiS, then some oxygen is left over to form silicates. However, it seems not to be possible to reproduce the observation with a mixture of solid SiO and silicates, because if more than a few per cent of the Si forms a silicate, the 18 m feature becomes clearly visible. On the other hand, additional formation of silicates besides solid SiO could explain the sources with a marked 10 m feature but an only weak 18 m feature, which are frequently found within the population of S-stars.
Possibly one could reproduce the observed band structure of the stars under consideration by a mixture of the oxides and silicates with solid SiO, but this is beyond the scope of this paper.
Another possibility for the strong asymmetry of the observed profile may be that the material formed in stellar outflows is more strongly disordered than the material formed in our laboratory experiments. A significantly stronger damping constant would also result in an asymmetric and much broader line profile. However, test calculations with strongly increased values of showed that the observed band shape cannot be explained in this way.
Finally some remarks are in place on the structure of SiO. At low temperatures this material slowly decomposes into silicon nanoclusters embedded in a SiO2 matrix (Kamitsuji et al. 2004). The material called silicon monoxide then in truth is an intimate mixture of two different phases which is inhomogeneous on scales of a few nanometres. The absorption peak then shifts to the characteristic peak of SiO2 at 9.2 m. Clearly, such a decomposition did not occur for our silicon monoxide films and would also be of minor importance in circumstellar shells if solid SiO would be the carrier of the 10 m feature. Decomposition times have been measured for the closely related material Si2O3 in the laboratory by, e.g., Nuth III & Donn (1984). If this can be taken as representative for solid SiO the decomposition would be sufficiently slow at the temperatures of interest (¸ K) that solid SiO can survive for a sufficiently long time to be observable.
5 Conclusions
This paper reports on laboratory studies of the infrared optical properties of solid silicon monoxide. The dielectric function is derived from transmission measurements of thin films obtained by evaporation of commercially available solid SiO and depositing its vapour on a cold substrate. A Brendel oscillator model is fitted to the results of the transmission measurements to determine .
Solid silicon monoxide is a material that has been speculated at different occasions to be involved in the formation process of silicate dust in circumstellar environments like accretion disks around protostars or dust shells around AGB stars. In this paper we study the possibility that solid silicon monoxide forms in circumstellar dust shells a separate dust component if insufficient oxygen is available to build the SiO4-tetrahedrons of normal silicate dust material. This would apply for instance to S-stars with a C/O abundance ratio very close to unity.
The characteristic property of such SiO dust would be a broad and structure-less emission feature centred on about 10 m resulting from Si-O bond stretching vibrations, similar to the 9.7 m feature of amorphous silicates, but a missing 18 feature resulting from O-Si-O bending modes in a SiO4-tetrahedron. Such peculiar cases have, indeed, been detected for some S-stars (Hony et al. 2009). We propose that we see in these stars solid silicon monoxide as an abundant dust component. Radiative transfer calculations for circumstellar dust shells have been performed using our new data on the dielectric function of solid SiO to calculate the emission band structure due to SiO dust.
The resulting emission feature at 10 m is compared with one of the two average emission profiles derived in Hony et al. (2009). The profile of the emission feature obtained in the model calculation peaks at about just the same wavelength as the observed feature, which makes its identification as due to solid SiO very likely. However, the observed profile is much more extended to longer wavelengths than the synthetic profile which either may result from blending the band from solid SiO with emission bands from a number of additional minor dust species (corundum, hibonite, …) or shows that the laboratory produced amorphous SiO films have a somewhat different lattice structure than the material condensed in stellar outflows.
More work is required to explain the asymmetry of the observed peculiar 10 m feature in some S-stars before the identification of solid silicon monoxide as carrier material of this feature can be considered as safe; but in any case this explanation can presently be considered as the most likely one.
Acknowledgements.
This work was supported in part by ‘Forschergruppe 759’ and special research progamm SPP 1385 which both are supported by the ‘Deutsche Forschungsgemeinschaft (DFG)’.Appendix A Radiative transfer model
Model spectra of S-stars are calculated using a simple code for modelling radiative transfer in circumstellar dust shells. The basic assumptions on the structure of the dust shell follow the conventional assumptions: A spherically symmetric mass distribution around the central star, with inner radius and outer radius . The outflow is assumed to be stationary and the outflow velocity to be independent of distance from the centre. The radial distribution of mass density in this case is
| (18) |
Here is the mass-loss rate that is also assumed to be constant.
With given opacities (see Sect. 4.1), the radiative transfer equation in spherical symmetry
| (19) |
is solved by the so called --method (cf. Mihalas 1978). The source function and the total extinction coefficient are
| (20) | |||||
| (21) |
The sum runs over all dust species. The angular distribution of the scattering term is that for small particles. The temperatures of the dust species are determined such as to satisfy radiative equilibrium
| (22) |
for each species by applying a Unsöld-Lucy temperature correction procedure (see Lucy 1964) adapted to the spherically symmetric case. This requires an iteration procedure for the determination of all temperatures . This iteration is combined with a simple iteration scheme (successive over-relaxation) with respect to and in the scattering contribution of the source function.
The inner radius of the dust shell is fixed by the requirement, that the most stable of the dust species appears at some prescribed temperature . Since it is not known in advance at which radius this condition is satisfied, an additional iteration procedure is required to determine . The outer radius is always taken at stellar radii.
The radiation field of the central star is approximated by a black body radiation field.
Appendix B Relation to Voigt function
We show here how the Brendel oscillator model is related to the more familiar Voigt function for the profile of damped spectral lines.
A single oscillator of the Brendel model contributes to the dielectric function a term
| (23) |
or, after splitting this into its real and imaginary part, the terms
| (24) | |||||
| (25) |
If , as in our case, the Lorentz profile as function of is different from zero in an only small interval around . Letting , one obtains by retaining only terms of lowest order in
| (26) | |||||
| (27) |
If we compare the imaginary part with definition
| (28) |
of the Voigt function (see Mihalas 1978, for details) we recognize that the imaginary part of one oscillator in the Brendel model corresponds, except for a constant factor, to the Voigt function with parameters
| (29) | |||||
| (30) |
Since the Voigt function is the real part of the complex error function (e.g. Humliček 1982, who also gives a FORTRAN routine for calculating the complex probability function), the Brendel oscillators are also directly related to the complex probability function.
References
- Asplund et al. (2005) Asplund, M., Grevesse, N., & Sauval, A. J. 2005, in Cosmic Abundances as Records of Stellar Evolution and Nucleosynthesis, ed. T. G. Barnes III & F. N. Bash, ASP Conf. Ser., Vol. 336 (San Francisco: Astron. Soc. of the Pacific), 25–38
- Barin (1995) Barin, I. 1995, Thermochemical Data of Pure Substances, 3rd edn., Vol. I, II (VCH Verlagsgesellschaft Weinheim)
- Berreman (1963) Berreman, D. W. 1963, Phys. Rev., 130, 2193
- Bohren & Huffman (1983) Bohren, C. F. & Huffman, D. R. 1983, Absorption and Scattering of Light by Small Particles. (New York: John Wiley & Sons)
- Bradley (2003) Bradley, J. 2003, in Lecture Notes in Physics, Vol. 609, Astromineralogy, ed. T. K. Henning (Berlin: Springer), 217–235
- Brendel & Bormann (1992) Brendel, R. & Bormann, D. 1992, J. Appl. Phys., 71, 1
- Cachard et al. (1971) Cachard, A., Roger, J. A., Pivot, J., & Dupuy, C. H. S. 1971, phys. stat. sol. (a), 5, 637
- Chabal et al. (2002) Chabal, Y. J., Raghavachari, K., Zhang, X., & Garfunkel, E. 2002, Phys. Rev. B, 66, 161315
- Chen & Kwok (1993) Chen, P. S. & Kwok, S. 1993, ApJ, 416, 769
- Duley et al. (1978) Duley, W. W., Maclean, S., & Millar, T. J. 1978, Ap&SS, 53, 223
- Ferguson & Nuth III (2008) Ferguson, F. T. & Nuth III, J. A. 2008, J. Chemical & Engeneering Data, 53, 2824
- Ferrarotti & Gail (2002) Ferrarotti, A. S. & Gail, H.-P. 2002, A&A, 382, 256
- Gail & Sedlmayr (1986) Gail, H.-P. & Sedlmayr, E. 1986, A&A, 166, 225
- Gail & Sedlmayr (1998a) Gail, H.-P. & Sedlmayr, E. 1998a, in The Molecular Astrophysics of Stars and Galaxies, ed. T. W. Hartquist & D. A. Williams (Oxford: Oxford University Press), 285–312
- Gail & Sedlmayr (1998b) Gail, H.-P. & Sedlmayr, E. 1998b, Faraday Discussion, 109, 303
- Groenewegen & de Jong (1998) Groenewegen, M. A. T. & de Jong, T. 1998, A&A, 337, 797
- Grosse et al. (1986) Grosse, P., Harbecke, B., Heinz, B., & Meyer, R. 1986, Appl. Phys. A, 39, 257
- Gunther (1958) Gunther, K. G. 1958, Glastechn. Ber., 31, 9
- Hass & Salzberg (1954) Hass, G. & Salzberg, C. D. 1954, J. Optical Soc. of America, 44, 181
- Hjortsberg & Granqvist (1980) Hjortsberg, A. & Granqvist, C. G. 1980, Applied Optics, 19, 1694
- Hohl et al. (2003) Hohl, A., Wieder, T., van Aken, P., et al. 2003, J. Non-Crystalline Solids, 320, 255
- Hony et al. (2009) Hony, S., Heras, A. M., Molster, F. J., & Smolders, K. 2009, A&A, 501, 609
- Humliček (1982) Humliček, J. 1982, J. Quant. Spec. Radiat. Transf., 27, 437
- Ishikawa et al. (2000) Ishikawa, K., Suzuki, K., & Okamura, S. 2000, J. Appl. Phys., 88, 7150
- Jorissen & Knapp (1998) Jorissen, A. & Knapp, G. R. 1998, A&AS, 129, 363
- Kamitsuji et al. (2004) Kamitsuji, K., Ueno, S., Suzuki, H., et al. 2004, A&A, 422, 975
- Kerschbaum (1999) Kerschbaum, F. 1999, A&A, 351, 627
- Kerschbaum & Hron (1998) Kerschbaum, F. & Hron, J. 1998, A&A, 308, 489
- Kirk (1988) Kirk, C. T. 1988, Phys. Rev. B, 38, 1255
- Klevenz (2009) Klevenz, M. 2009, PhD thesis, University of Heidelberg
- Klevenz et al. (2010a) Klevenz, M., Wetzel, S., Möller, M., & Pucci. 2010a, Applied Spectroscopy, 64, 298
- Klevenz et al. (2010b) Klevenz, M., Wetzel, S., Trieloff, M., Gail, H. P., & Pucci. 2010b, phys. stat. sol. b
- Knapp (1985) Knapp, G. R. 1985, ApJ, 293, 273
- Koike et al. (1995) Koike, C., Kaito, C., Yamamoto, T., et al. 1995, Icarus, 114, 203
- Kruszewski et al. (1968) Kruszewski, A., Gehrels, T., & Serkowski, K. 1968, AJ, 73, 677
- Lehmann (1988) Lehmann, A. 1988, physica status solidi (b), 148, 401
- Lehmann et al. (1983) Lehmann, A., Schumann, L., & Hübner, K. 1983, phys. stat. sol. (b), 117, 689
- Lehmann et al. (1984) Lehmann, A., Schumann, L., & Hübner, K. 1984, phys. stat. sol. (b), 121, 505
- Lloyd Evans & Little-Marenin (1999) Lloyd Evans, T. & Little-Marenin, I. R. 1999, MNRAS, 304, 421
- Lodders et al. (2009) Lodders, K., Palme, H., & Gail, H. P. 2009, in Landolt-Börnstein, New Series, Group IV, Vol. 4, ed. J. E. Trümper (Berlin: Springer), 560–599
- Lucy (1964) Lucy, L. 1964, in Proceeding of the first Harvard-Smithonian Conference on Stellar Atmospheres, ed. E. H. Avrett, O. Gingerich, & C. A. Whitney, Smithonian Astrophysical Observatory Special Report No. 167 (Cambridge, MA: Smithonian Astrophysical Observatory), 93–98
- Mihalas (1978) Mihalas, D. 1978, Stellar Atmospheres. (San Francisco: Freeman & Co)
- Millar (1982) Millar, T. J. 1982, Ap&SS, 86, 497
- Mutschke et al. (2002) Mutschke, H., Posch, T., Fabian, D., & Dorschner, J. 2002, A&A, 392, 1047
- Naiman et al. (1985) Naiman, M. L., Kirk, C. T., Emerson, B. L., Taitel, J. B., & Senturia, S. D. 1985, J. Appl. Phys., 58, 779
- Nuth III & Donn (1982) Nuth III, J. A. & Donn, B. 1982, J. Chem. Phys., 77, 2639
- Nuth III & Donn (1984) Nuth III, J. A. & Donn, B. 1984, J. Geophys. Res., 89, 657
- Nuth III & Ferguson (2006) Nuth III, J. A. & Ferguson, F. T. 2006, ApJ, 649, 1178
- Palik (1985) Palik, E. D. 1985, Handbook of Optical Constants in Solids. (New York: Academic Press)
- Philipp (1971) Philipp, H. 1971, J. Phys. Chem. Solids, 32, 1935
- Queeney et al. (2004) Queeney, K. T., Herbots, N., Shaw, J. M., Atluri, V., & Chabal, Y. J. 2004, Appl. Phys. Lett., 84, 493
- Ramstedt et al. (2006) Ramstedt, S., Schöier, F. L., Olofson, H., & Lundgren, A. A. 2006, A&A, 454, L103
- Rocabois et al. (1992) Rocabois, P., Chatillon, C., & Bernard, C. 1992, Rev. Int. Hautes Tempér. Réfract., 28, 37
- Sacuto et al. (2008) Sacuto, S., Jorissen, A., Cruzalèbes, P., et al. 2008, A&A, 482, 561
- Serkowski & Shawl (2001) Serkowski, K. & Shawl, S. J. 2001, AJ, 122, 2017
- Tazawa et al. (2006) Tazawa, M., Kakiuchida, G., Xu, P. J., & Arwin, H. 2006, J. Electroceram., 16, 511
- Teschner & Hübner (1990) Teschner, U. & Hübner, K. 1990, phys. stat. sol. (b), 159, 917
- Theiss (2009) Theiss, M. 2009, SCOUT - software package for optical spectroscopy V3.17
- van Hapert et al. (2004) van Hapert, J. J., Vredenberg, A. M., van Faassen, E. E., et al. 2004, Phys. Rev. B, 69, 245202