The Deep Layers of Sunspot Umbrae
Abstract
Aims. We model the deepest observable layers of dark sunspot umbral atmospheres in terms of an empirical model which equally describes observed near infrared continuum intensities and line profiles.
Methods. We use the umbral continuum intensity at and the three C I lines at 16888Å, 17449Å and 17456Å to model the deep layers near the minimum of H- absorption. An extrapolation of umbra models to such deep layers must assure that (a) the calculated 1.67 continuum does not fall below the range of observations and (b) the resulting C I lines do not come out stronger than the lower observational limit.
Results. Our calculations show that a T stratification yields the best compromise between both criteria: a flatter gradient violates (a) a steeper one (b). We determine from the umbral and photospheric flux ratio down-scaling the monochromatic photospheric flux with the umbral contrast for each frequency and obtain the monocharomatic umbral flux. Integration of both over gives the ratio of total umbral and photospheric flux, which yields K. We assume for our model K and fit it to the theoretical model by Meyer et al. (1974). Comparison of the gradient with the adiabatic one shows that umbral convection, if existing at all, can only occur at considerably deeper layers than in the photosphere.
Key Words.:
Sunspot umbra - infrared contrasts - line profiles - empirical model - effective temperature1 Introduction
Recent observations of umbral continuum contrasts in the near infrared, carried out by Hall (1970) and by Ekmann and Maltby (1974), have led to a re-discussion of the temperature and pressure stratification in sunspot umbrae (Zwaan, 1974; Kjeldseth-Moe and Maltby, 1974). Their models disagree considerably with the empirical model M0 by Stellmacher and Wiehr (1970, hereafter referred to as Paper I), which was shown to optimally fit the profiles of several magnetically insensitive lines observed in umbrae and had been confirmed by Kneer (1972) and by Koppen (1974). In Stellmacher and Wiehr (1971, hereafter referred to as Paper II) this fit was extended to the center-to-limb variation of a non-split line, which represents a very strong criterion for empirical models.
M0 had been deduced from line profiles and continuum contrasts at 5000ÅÅ, and can thus not represent the deep layers , for which it gives an arbitrary extrapolation. The present study demonstrates how M0 can be extended towards deeper layers to fit observed IR data. The still existing scatter of observational data and of the photospheric models (to which any umbra model necessarily refers) allows an extention of MO to deep layers preserving the good line profile presentation in papers I and II without assumption of additional parameters. We consider our empirical model as a ’boundary condition for three dimensional sunspot models’ and for the ’quantitative interpretation of line profiles’ (Zwaan 1974).
2 Observational data
Considering the ’epochal decrease’ of observed umbra-to-photosphere intensities in the visible region from 0.24 (at 5452 Å, Michard 1953) to 0.04 (at 5790 Å, Ekmann and Maltby 1974), recently observed infrared data may hardly be considered as ’final results’. In particular, the determination of an empirical umbra model from the low data in the visible range together with recent high infrared data will be uncorrect. Besides, differences between individual umbrae require the use of data from one spot taken under identical conditions such as the simultaneous broad band measurements by Ekmann and Maltby (1974).
![[Uncaptioned image]](/html/1210.4393/assets/ScanUmbraATable1.jpg)
We correct their data for the influence of Fraunhofer lines integrating the ratio from Hall’s (1974) infrared atlas in the respective -windows. For the visible region the same is done for the data by Wöhl (1975). The correction factors, given in Table 1, might still be underestimated due to the uncertain continuum level.
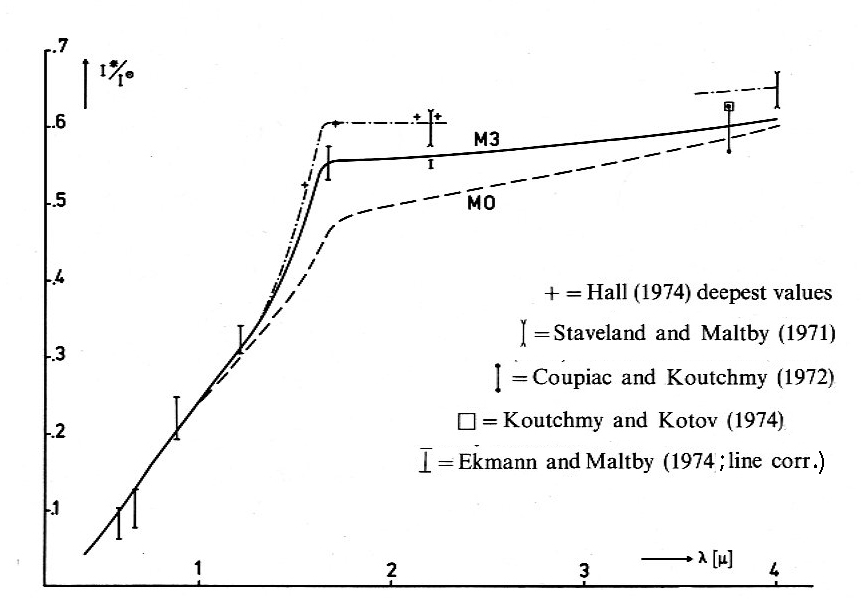
We finally applied these corrections to the data from all umbrae at given by Ekmann and Maltby (1974). The results are given in Fig. 1 together the umbral intensities by Hall (1974), which appear to be considerably higher. Hall’s data refer to continuum windows and are thus not affected by Fraunhofer lines; only parasitic light may interfere which does not exceed 2% considering the Fe II lines in that -region to be of non-umbral origin (cf., paper I). The remaining differences to the Ekmann and Maltby (1974) data cannot be analyzed, since Hall (1974) did not observe in the visible -range; light bridges in his spots may also explain his higher intensity values.
3 Extrapolation of M0 to the improved M3 model
It has been shown by Zwaan (1974) that the strong variation of relative umbra intensity between the maximum absorption at and the absorption minimum at requires the steepest possible temperature gradient, i.e. radiative equilibrium whith , where and denote the effective temperature and the Rosseland opacity, respectively and is constant for deep layers. We therefore assume a gradient for the extrapolation of our model M0 to deep layers.
To estimate the actual umbral value we multiplied the monochromatic photospheric flux (Unsöld, 1956, Fig. 20a) by the observed monochromatic intensity ratio . This yields the monochromatic umbral flux under the assumption of a vanishing center-to-limb variation of the contrast at all , which is found in observations and in all umbral models under discussion (cf., paper II). Planimetry over the frequency then yields for umbra and photosphere their total (integrated) flux and .
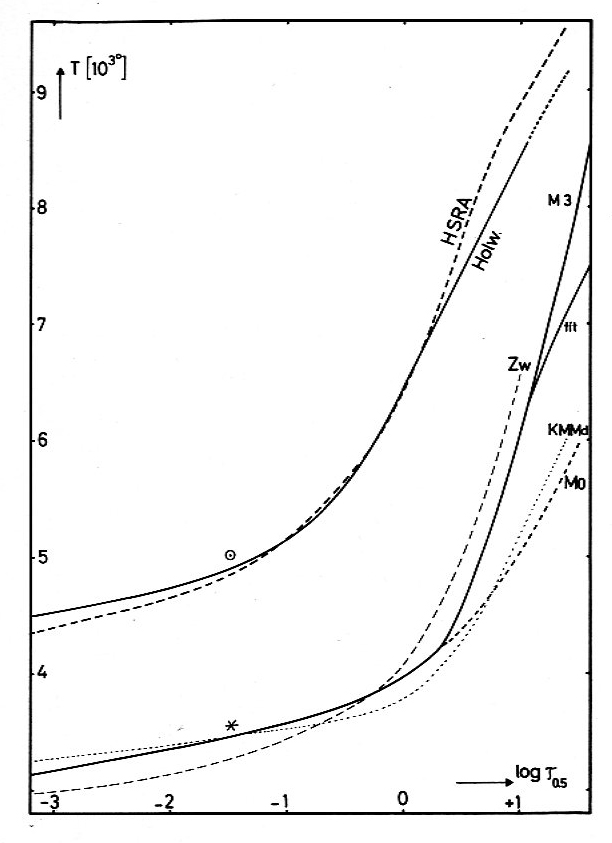
Assuming now radiative equilibrium, r.e., it is , and we obtain 3560 K K; the scatter reflects the range of observed contrasts. In order to keep the temperature gradient as high as possible we assume K; the resulting model M3 is listed in Table 3, it is shown in Fig. 2 together with M0 and some other models. The validity of this M3 has now to be checked by comparison with line profile and continuum observations.
3.1 The M3 representation of the continuum
In order to avoid uncertainties from the deep layers of photospheric models we normalize our calculated umbra intensities exclusively to observed photospheric absolute intensities: Labs and Neckel (1968) list for the relative measurements by Pierce (1954), which they calibrated using the ’model distribution between and as a linking medium’. This affects that the two intensity values given by Pierce for and for are too high. If we accordingly correct the relative intensities by Pierce (1952), we obtain a remarkable agreement with Peyturaux (1952).
A similar uncertainty concerns the photospheric absolute intensities at which, according to Koutchmy and Peyturaux (1970) show a large scatter among the various observations. In particular, Badinov et al. (1965) publish absolute intensities, which are considerably lower than those listed by Labs and Neckel (1968).
Consequently we normalize for those two wavelength regions the intensities from our umbra model alternately to both, the data listed by Labs and Neckel (1965) and the lower values given by Peyturaux (1952) and by Badinov et al. (1965), respectively. The resulting relative umbral intensities for M0 and for M3, given in Fig. 1 together with the observations discussed in Sec. 2, show that model M3 fully agrees with the range of continuum observations when considering those uncertainties in the photospheric data.
3.2 The M3 representation of line profiles
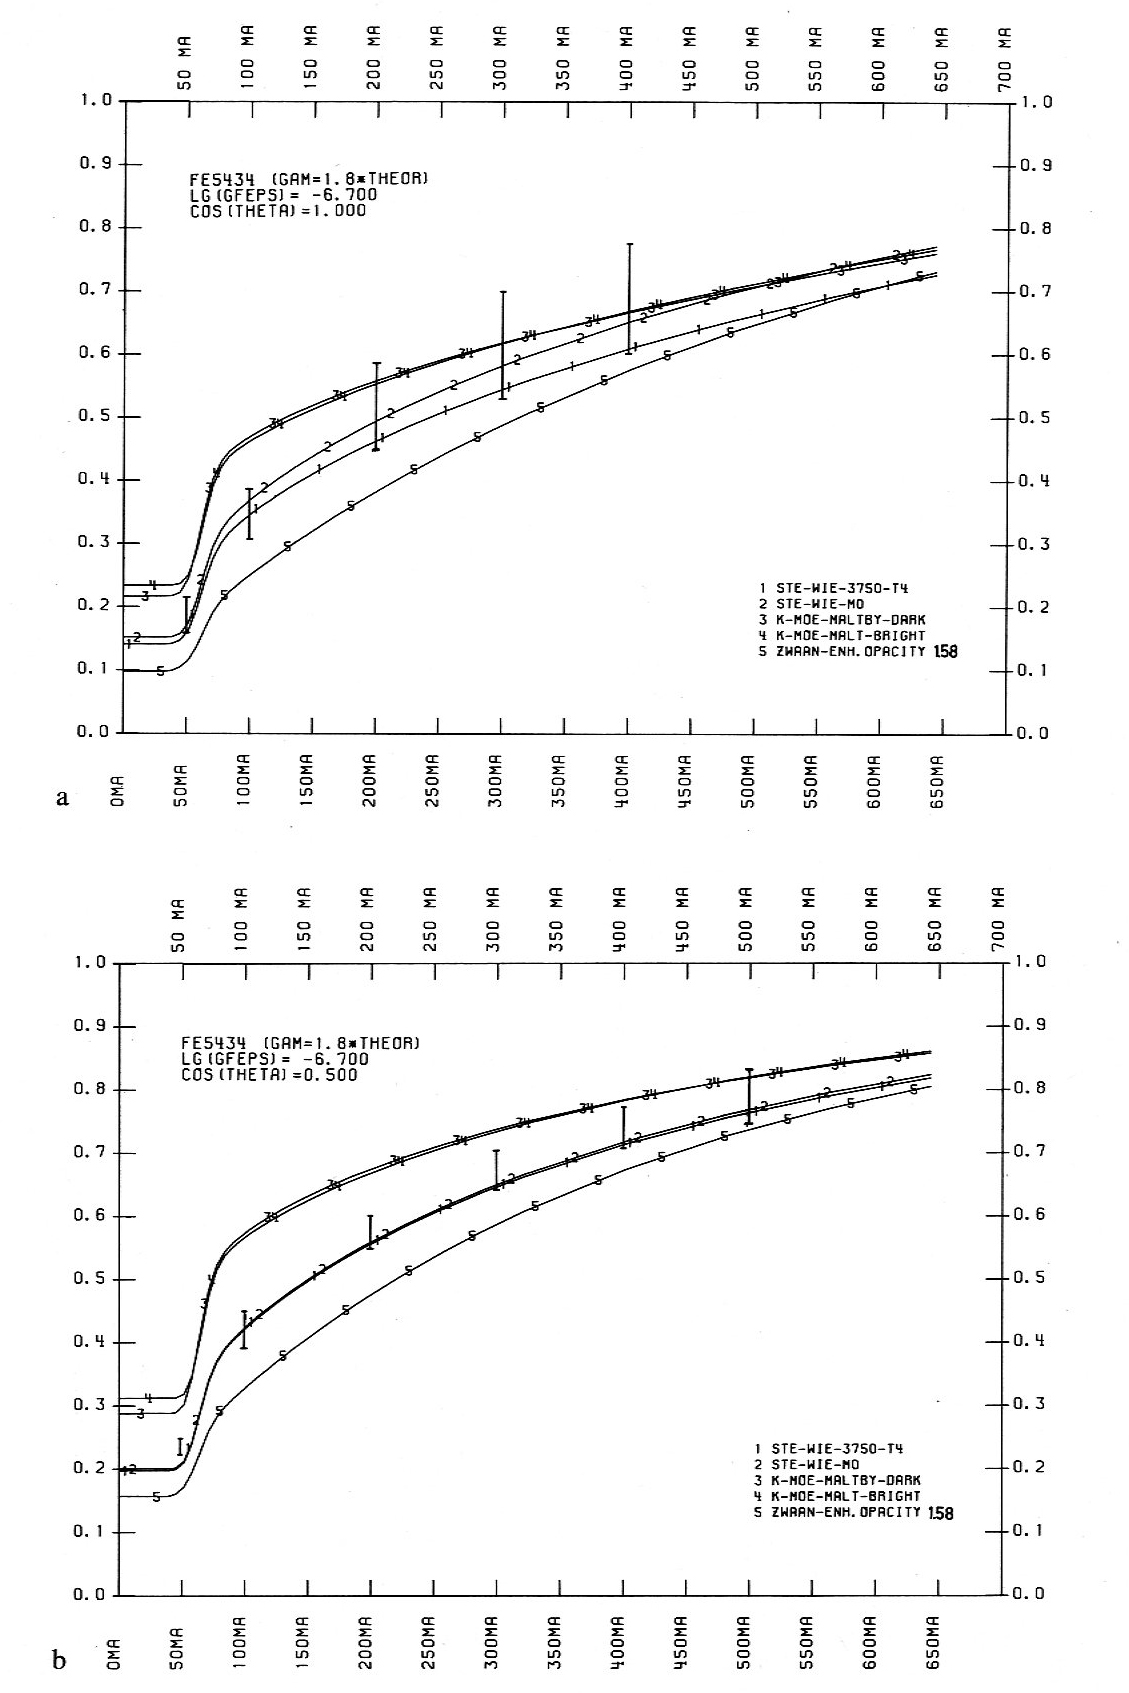
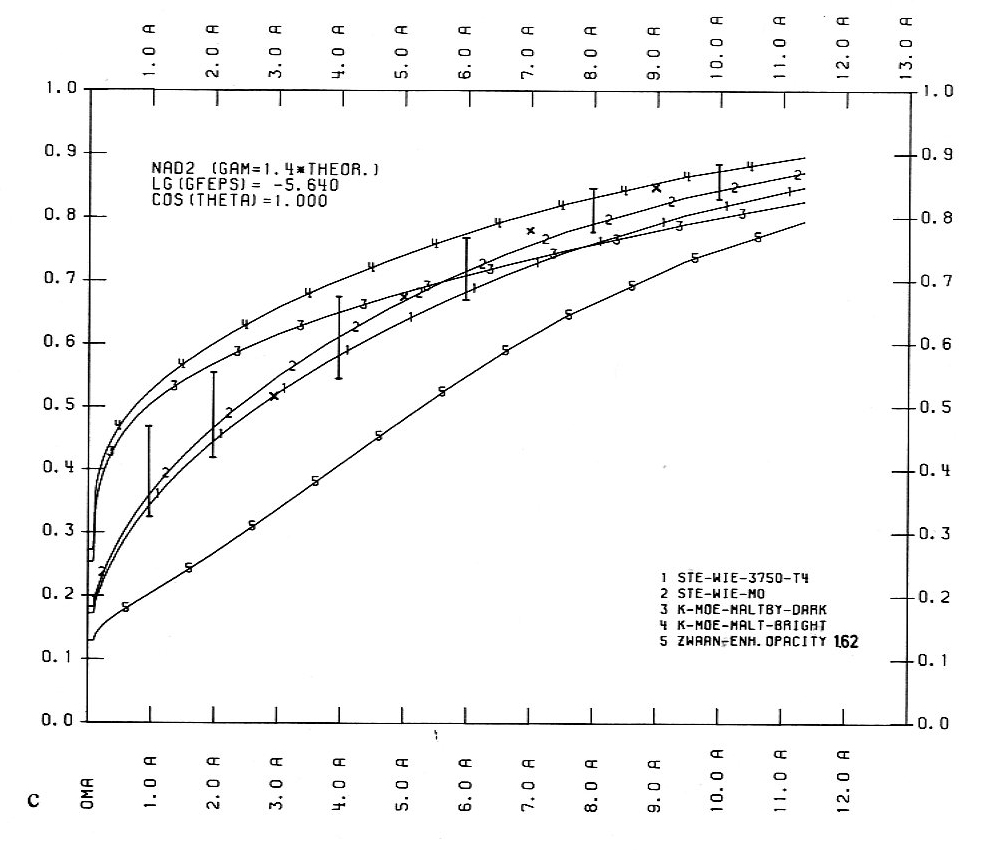
Since model M3 differs from M0 only in the deeper layers (see Fig. 2 and Table 3) one would not expect significant influence on the line profiles mentioned in Sec. 1. However, calculations show that the contribution of these deeper layers to the line wings of NaD2 and of Fe 5434 is not sufficiently small to be neglected. Moreover, the line profile calculations show that M3 represents an ’upper limit’ for an extrapolation of M0 to deep layers.
For our line profile calculations we adapted the damping constants to the observed photospheric line wings taking the known values by Lambert and Warner (1968) for NaD2 and by Wolnik et al. (1970) for Fe 5434 together with the relative abundances and , thus improving our fit of to in papers I and II. With and we achieve an agreement within with the observed photospheric line wings at Å and at Å, when using Holweger’s (1967) photospheric model and assuming LTE.
The validity of LTE is reasonably be also assumed for the umbral model. The line profiles obtained with M3 are shown in Figs. 7 and 8 together with our observations discussed in Papers I and II. The bars give the raw data as upper and the maximum uncorrected ones as lower end. The maximum correction corresponds to actually vanishing Fe II 6149 and Fe II 7224 lines in the dark umbral core. Figs. 7 and 8 show that the models by Zwaan (1974) and by Kjeldseth-Moe and Maltby (1974) yield profiles outside that range.
As a further criterion for the temperature gradient in deeper umbral layers we use the equivalent widths of C I 16888Å, C I 17456Å and C I 17449Å which we determine from Hall’s (1974) infrared atlas to 7.5, 13.0, and 20.0 mÅ. These values represent upper limits since any parasitic light would have strengthened them. The quantity () was determined for the C I lines by a fit to the photospheric equivalent widths from Hall’s atlas: mÅ, mÅ and mÅ (see Table 2).
For the calculation of the C I lines one has to consider possible influences of the formation of CO on the number density of atomic carbon. That of CO depends slightly on the formation of OH and H2; the influence of other molecules is negligible. For M3 we find at the layer, which also gives the maximum contribution to the C I lines and their adjacent continuum. The eventual influence of CO-formation on the C-lines amounts to . The resulting (Table 2) indicate that model M3 represents the ’steepest possible extrapolation’ of MO and gives the best fit to the observations.
4 Conclusion
Having shown that M3 well represents observations of line profiles and continuum, it is reasonable to discuss that model in more detail, keeping in mind that the validity of M3 is limited by the accuracy of the observations the model is based on.
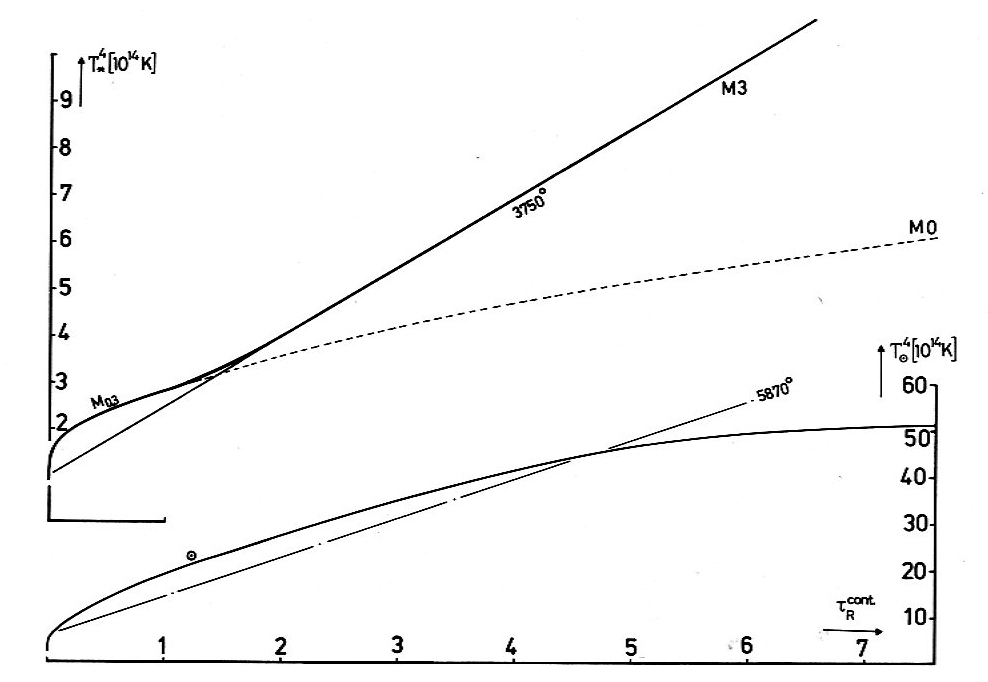
In order to obtain some idea about the umbral line blanketing we compare M3 with the corresponding unblanketed gray r.e. stratification with K (cf., end of Sec. 3). A presentation in the plane (Fig. 4) shows that M3 has a typical line blanketing with ’back-warming’ at (corresponding to and ’lowering of the boundary temperature’ at , as is predicted by the picket-fence model (Chandrasekhar, 1935).
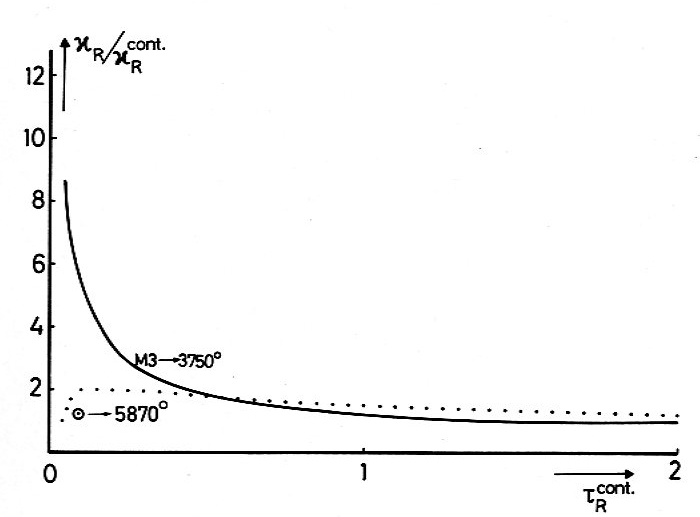
A more quantitative investigation of the line blanketing can be achieved by transforming the blanketed into the unblanketed model. The resulting quantity (Fig. 5) shows for M3 a much stronger depth dependence than for the photosphere. Such a behavior has already been discussed by Mattig and Schröter (1974).
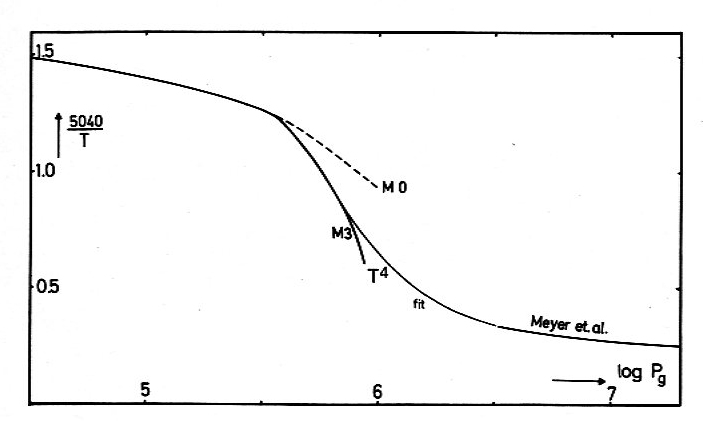
An interesting question is the limit of radiative equilibrium (r.e.) below which convection is possible. For a rough estimate we connect M3 to the theoretical model by Meyer et al. (1974) in the versus plane (Fig. 6). This is done keeping the intensities unaffected within and requires a validity of r.e. up to . The existing uncertainties in the observed photospheric absolute and umbral relative intensities do not allow us to exclude an onset of deviations from r.e. at slightly higher layers, which might then give rise to observable umbral convection near .
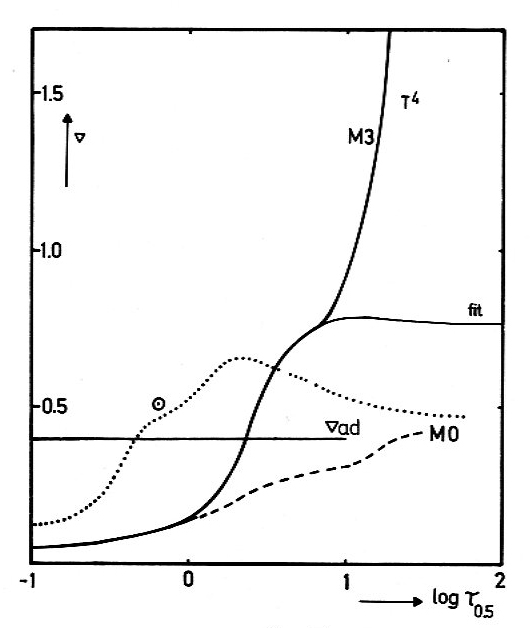
Another criterion for convection is the maximum in the depth dependence of (Fig. 7). For the umbral M3 model the -maximum occurs as deep as but for the photosphere much higher at . On the other hand, the criterion for convective instability, is satisfied for M3 at and for the photosphere at (see Fig. 6).
Both considerations indicate that convection is possible for umbrae only at considerably larger depths than for the photosphere, in full agreement with the absence of macro-turbulence in line profile representations with the new empirical working model M3 for sunspot umbrae.
Acknowledgements.
We are very grateful to E. H. Schröter and H. Schleicher for interesting discussions.References
- (1) Badinov, I. Ja., Andrejev, S. D., Pojerovskij, A. V. 1965, Prol. Fiz. Atm. 3, 189
- (2) Chandrasekhar, S. 1935, Monthly Notices Roy. Astron. Soc. 96, 21
- (3) Coupiac, P., Koutchmy, S. 1972, Astron. & Astrophys. 16, 272
- (4) Ekmann,G., Maltby,P. 1974, Solar Phys. 35, 317
- (5) Gingerich,O., Noyes,R. W., Kalkofen, W., Cuny, Y. 1971, Solar Phys. 18, 347
- (6) Hall,N.B. 1970, Kitt Peak Natl. Obs. Contrib. No. 556
- (7) Hénoux,J.C. 1968, Ann. Astrophys. 31, 511
- (8) Holweger,H. 1967, Z. Astrophys. 65, 365
- (9) Kjeldseth-Moe, K. O., Maltby, P. 1974, Solar Phys. 36, 109
- (10) Kneer,F. 1972, Astron. & Astrophys. 18, 39
- (11) Koppen, J. 1975, Solar Phys. 42, 325
- (12) Koutchmy, S., Kotov, V. 1974 (private communication)
- (13) Koutchmy, S., Peyturaux,R. 1970, Astron. & Astrophys. 5, 479
- (14) Labs,D., Neckel,H. 1968, Z. Astrophys. 69, 1
- (15) Lambert, D. L., Mallia, E. A. 1968, Monthly Notices Roy. Astron. Soc. 138,181
- (16) Maltby, P., Staveland,L. 1971, Solar Phys. 18, 443
- (17) Mattig,W., Schröter,E.H. 1964, Astrophys. J. 140, 804
- (18) Meyer,F., Schmidt,H.U., Weiss,N.O., Wilson,P.R. 1974, Monthly Notices Roy. Astron. Soc. 169, 35
- (19) Michard,R. 1953, Ann. Astrophys. 16, 217
- (20) Pierce, A. K. 1954, Astrophys. J. 119, 312
- (21) Peyturaux,R. 1952, Ann. Astron. 15, 302
- (22) Schleicher, H. 1975, Thesis Göttingen (in preparation)
- (23) Stellmacher, G., Wiehr,E. 1970, Astron. & Astrophys. 7, 432
- (24) Stellmacher, G., Wiehr,E. 1972, Astron. & Astrophys. 19, 293
- (25) Unsöld, A. 1956, Physik d. Sternatm., Springer, Berlin-Göttingen-Heidelberg
- (26) Waddell,J. 1962, Astrophys. J. 136, 223
- (27) Wöhl,H. 1975, Astron. & Astrophys. 40, 343
- (28) Wolnik,S.J., Berthel,R.O., Wares, G. W. 1970, Astrophys. J. 162, 1037
- (29) Zwaan,C. 1974, Solar Phys. 37, 99
![[Uncaptioned image]](/html/1210.4393/assets/ScanUmbraATable2.jpg)
![[Uncaptioned image]](/html/1210.4393/assets/ScanUmbraATable3.jpg)