Field-aligned beams and reconnection in the jovian magnetotail
Abstract
The release of plasma in the jovian magnetotail is observed in the form of plasmoids, travelling compression regions, field-aligned particle beams and flux-rope like events. We demonstrate that electrons propagate along the magnetic field lines in the plasma sheet boundary layer (PSBL), while close to the current sheet center the electron distribution is isotropic. The evidences of the counterstreaming electron beams in the PSBLs are also presented. Most of the field-aligned energetic ion beams are associated with the field-aligned electron beams and about half of them have the bipolar fluctuation of the meridional magnetic field component. Moreover they often show a normal velocity dispersion for the different species which fits well in the scenario of particle propagation from a single source. All features above are observed during jovian reconfiguration events which are typically bonded with plasma flow reversals. From all these characteristics, which are based on energetic particle measurements, we believe that the reconfiguration processes in the jovian magnetotail are associated with reconnection.
keywords:
Jupiter, magnetosphere; magnetic fields; magnetospheres1 Introduction
One of the dynamic reconfiguration processes of the magnetosphere is called
substorm and is a key process responsible for the energy transport and
release in the terrestrial magnetosphere. It is believed that reconnection is
responsible for the break of stability in the magnetospheric configuration
and also for the transfer from magnetic to kinetic energy, e.g.
(Angelopoulos et al., 2008). During this process the magnetic field forms a so-called
X-line surrounded by the diffusion region, where acceleration of particles
takes place. In the diffusion region the electric field accelerates
high-energy ions and electrons away from the magnetic reconnection region and
electrons at low-energy flow toward the reconnection site simultaneously
(Nagai et al., 2001; Manapat et al., 2006). The energetic particles are released as bursty
bulk flows and are widely studied by e.g. Angelopoulos et al. (1994). The bursty bulk
flows often contain structures with closed magnetic field lines – plasmoids.
Such a large tailward-moving loop-like magnetic structure is generated as the
result of X-type reconnection on the closed field lines in the near
magnetotail (Hones, 1979). In two dimensions the typical observational
signatures of a plasmoid have been defined by a bipolar magnetic deflection
in the meridional direction. The examination of the three-dimensional
topology and morphology of plasmoids in the Earth’s magnetotail showed rather
complicated configurations compared to the original 2-dimensional Hones
scenario: helical flux ropes and travelling compression regions (TCRs)
detected as moving magnetic imprints of a plasmoid in the lobes
(Zong et al., 2004; Slavin et al., 1995, 2003). A tailward moving plasmoid in the central
plasma sheet temporarily compresses the magnetic flux in the tail lobes
because the cross-sectional area of the lobe is reduced. In the area between
the central plasma sheet and lobe a layer of particles moving parallel to the
magnetic field arises from a rapid change of the flux tube volume outside the
diffusion region (Schindler, 2007). However, these field-aligned beams
could also be of a different origin than reconnection, e.g. due to Fermi
acceleration (Vogiatzis et al., 2006; Grigorenko et al., 2009). Thus in the terrestrial magnetosphere two
distinct
groups of field-aligned beams can be derived:
(1) field-aligned ion beams
accompanied with field-aligned electrons and associated with the X-line
reconnection;
(2) ion field-aligned beams accompanied by isotropic electrons
accelerated by the quasi-steady dawn-dusk electric field.
Substorm-like (or) reconfiguration processes have been observed at Jupiter by
the particle and fields instruments onboard the Galileo spacecraft
(Krupp et al., 1998; Woch et al., 1998, 1999; Kronberg et al., 2005). It is believed that the
reconfiguration processes in the jovian magnetosphere are rather internally
driven by ion mass loading from the moon Io and fast planetary rotation,
although we cannot fully exclude the influence of the solar wind
(Kronberg et al., 2009). This internal driving mechanism leads to a periodic release
of plasma in the magnetotail with a repetition period of about 3 days. The
thinning of the plasma sheet prior to the mass release reminds the growth
phase of the terrestrial substorm (Ge et al., 2007). This plasma sheet
reconfiguration due to internal energy loading leads to a formation of the
X-line in the jovian magnetotail at approximately 80 (Woch et al., 2002; Vogt et al., 2010). The scale size of downtail released plasmoids was estimated to be
about 9 (Kronberg et al., 2008b).
Reconnection processes at Jupiter seem to play an important role in the
reconfiguration process as reported by
Nishida (1983); Russell et al. (1998, 2000); Vogt et al. (2010); Ge et al. (2010). Reconnection conditions in the
jovian magnetotail are satisfied just before the energetic particle release
(Zimbardo, 1993; Kronberg et al., 2007). Statistical studies of bursty bulk flows and plasmoids
were carried out by Kronberg et al. (2008b); Vogt et al. (2010). Also data from the New Horizons
spacecraft during the Jupiter flyby showed evidence of periodic plasma
injections possibly caused by reconnection (McNutt et al., 2007; McComas et al., 2007). Some
field-aligned beams were discussed in the substorm-like context by
Woch et al. (1999).
In this paper, we show for the first time observations of a TCR and plasmoids
together with field-aligned beams and consider their features more detailed
in the context of X-line reconnection using data from the Galileo Energetic
Particle Detector (EPD) (Williams et al., 1992) and from the magnetometer (MAG)
(Kivelson et al., 1992). The paper is organized as follows: In Section 2 we
introduce shortly the instruments onboard Galileo used to identify
field-aligned beam features in the measurements. In Section 3.1 we
present a typical jovian reconfiguration event with field-aligned beams and
dynamic processes preceding and following the beam. In Sections
3.2-3.5 we show examples of four field-aligned beams and
their wide spectrum of characteristics. Section 4 discusses
results and provides a statistical analysis. Section 5 summarizes
the observations.
2 Instrumentation
The EPD was an instrument onboard the Galileo spacecraft designed to measure the characteristics of the charged particle population such as energies, intensities, ion composition and angular distribution to determine, in particular, the configuration of the jovian magnetosphere (Williams et al., 1992). The advantages of the EPD instrument compared to similar instruments on previous missions were the steradian angular coverage for jovian energetic particles and the extended coverage of particle energies. EPD consisted of two double-headed detector telescopes: the Low Energy Magnetospheric Measurement System (LEMMS) and the Composition Measurement System (CMS). CMS measured the ion fluxes with discriminating ion species using the time-of-flight technique. Its energy ranges were 80 to 1250 keV (protons), 27 keV/nuc to 1 MeV/nuc (helium ions), 12 to 562 keV/nuc (oxygen ions), and 16 to 310 keV/nuc (sulfur ions). On the other hand, LEMMS observed the electron flux in the energy range between 15 and 11000 keV and the species-integrated ion flux between 22 and 12400 keV. In this case electrons and ions were separated by a permanent magnet. Although these telescopes have narrow field-of-view (the full opening angles are 18∘ and 15∘ for CMS and LEMMS, respectively), an almost full-sphere coverage is achieved by the motion of a turntable combined with the spacecraft spin (the exception is a small solid angle ( 0.1 sr) along the spin axis which is blocked to avoid direct sun light in the detector). The unit sphere is divided into 16 (see Figure 6.2, in (Lagg, 1998)) or 6 sectors dependent on the energy channel. To study the flow direction we analyze 16-sector resolution data in this work. Data are accumulated within sampling times of 11.5 min (for this study) and allocated to the angular sectors. Each sector is 45∘ wide. In the record time mode EPD/LEMMS count rates are sampled every 1.25 seconds over up to 64 sectors. The description of LEMMS and CMS energy channels used in our analysis one can find in Table 1. The first order anisotropies were calculated using technique described by Krupp et al. (2001), and references therein. The pitch angle distributions (PAD) are presented in the detector frame – Detector Pitch Angles (DPA). The flow is parallel to the magnetic field when DPA is close to 180∘ and respectively anti-parallel when DPA is close to 0∘. Particle pitch angles are determined with the magnetic field data obtained by the Galileo magnetometer. We discuss pitch angles only when the magnetic field direction varies insignificantly during a sampling time, since otherwise the pitch angle determination is unreliable. The magnetic field observations have a time resolution of 24 s, which is much higher than that of the particle measurements. This does not affect our results, however, as we compare the observed field-aligned beams in the particle data with features in the magnetic field and not the other way around. Still, it is very likely that we miss many events with time scales less than 11 min in the EPD data set.
3 Observations
3.1 An overview event
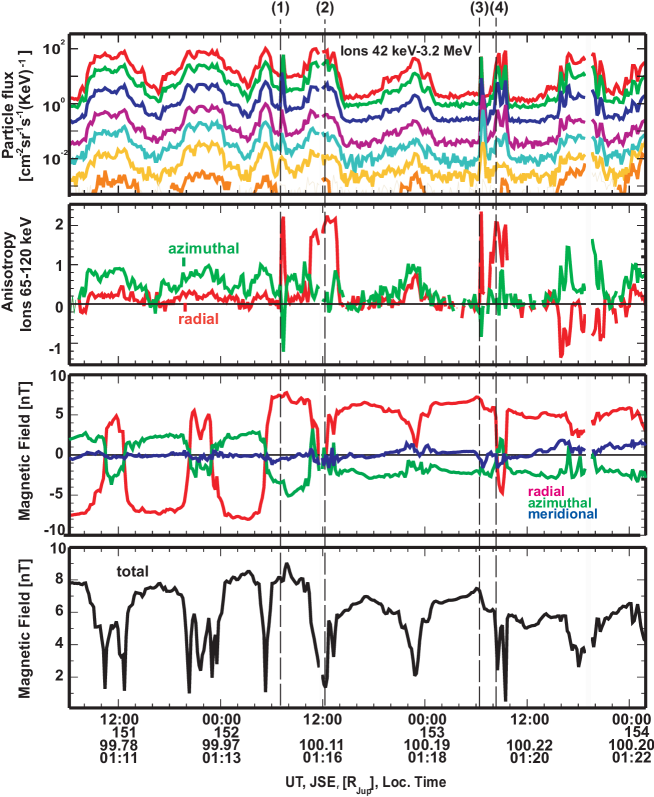
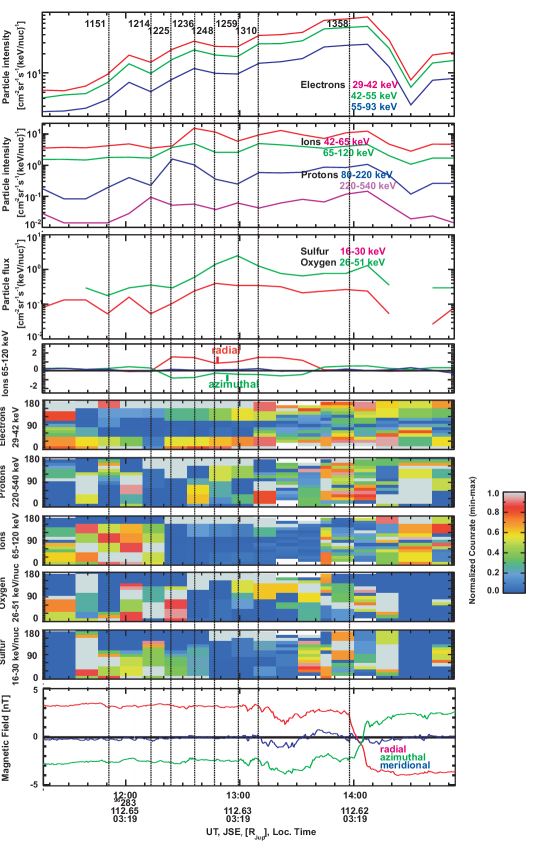
A typical substorm-like or reconfiguration event in the jovian magnetosphere is shown in Figure 1. The figure shows the time interval from day 1997 151, 06:00 to day 154, 02:00. During this time Galileo was located in the midnight sector of the jovian magnetotail (0116 Local Time (LT)) at about a radial distance R = 100 The upper panel displays omnidirectional ion intensities in seven energy channels covering the energy range between 22 keV (a1 channel) and 3.2 MeV (a7 channel). The second panel from the top shows the radial (red) and azimuthal (green) component of the ion directional flow anisotropy as derived from measurements of 65-120 keV ions. The lower two panels present the magnitude and components of the measured magnetic field in the SIII-system. In this system the radial magnetic field component is positive in the radially outward direction, the azimuthal component is positive in the direction of Jupiter’s rotation and the south-north (meridional) component is positive southward (Dessler, 1983). First signatures of a mass-release process are observed at day 152, 07:00 with an unusual (for the lobe region) increase of the ion intensities (see vertical dashed line (1) in Figure 1). The corotational flow, typical for the jovian magnetosphere (see the ion anisotropy denoted by the green line in the second panel from the top) is disrupted by a strong tailward (radially outward) directed anisotropy spike or an field-aligned ion beam (the red line) in the lobe / PSBL (that the beam is field-aligned will be proven later). This is followed by the bursty flow ion anisotropy event or bursty bulk flow (denoted by the vertical dashed line (2)) which arrives with bipolar features in the south-north magnetic field component at day 152, 10:00 when Galileo approached the vicinity of the current sheet center. About 16 hours later another group of tailward directed bursts with similar characteristics arrives (see vertical dashed lines (3) and (4) in Figure 1). Then in the subsequent plasma sheet encounter radially inward directed bursts (the negative red spikes) are observed implying that the X-line moved tailward over the spacecraft. The observations of the flow reversals are very typical for the jovian magnetotail, see e.g. Kronberg et al. (2005, 2009). It is interesting that just before the bursty flows the plasma sheet changed its displacement relative to the spacecraft from being more in the southern part of the plasma sheet to being in the northern part of the plasma sheet almost all of the presented time (according to the radial magnetic field component behavior). Such plasma sheet displacements were discussed by (Vasyliūnas et al., 1997; Waldrop et al., 2005). They suggest that these displacements could be associated to a change in the solar wind conditions. More details on the reconfiguration or substorm-like events can be found in Woch et al. (1999); Kronberg et al. (2005, 2008b). This example is shown to present the global picture of the magnetotail dynamics before going into details.
3.2 Event 1: Counterstreaming field-aligned electrons and possible interpretation
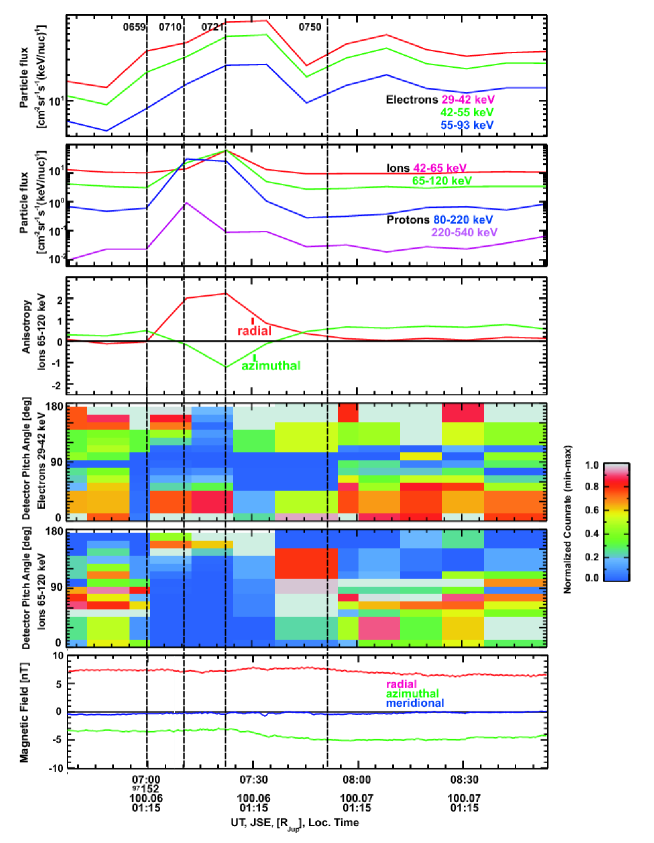
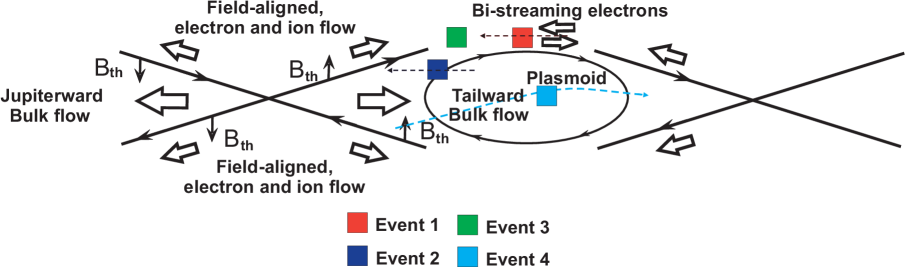
One example of a field-aligned beam during reconfiguration events is shown in Figure 1. It was recorded at 100 away from the planet in the magnetotail, on day 97 152, 06:30-09:00. The detailed particle and the magnetic field observations for this event are presented in Figure 2 and the location relative to the plasma sheet configuration is sketched in Figure 3. According to the strength and direction of the magnetic field the spacecraft was located in the north lobe/or PSBL. First the electrons arrive with energies from 15 to 304 keV (see electron intensities in Figure 2, panel 1) at 0659 UT. These electrons were flowing parallel to the magnetic field in the lobe region (see the increase in electron intensities close to 180∘ in DPA distributions, panel 4). After 0659 UT electrons moved bi-directionally parallel to the magnetic field (see the increase in intensities close to 0∘ and 180∘). Between 0710 UT and 0750 UT the observed electrons changed their direction of motion from being anti-parallel 0710-0721 UT to mainly parallel 0721-0750 UT relatively to the magnetic field. At 0750 UT the electron distribution becomes isotropic. This field-aligned electron beam is associated with the reconfiguration event from the list published by Kronberg et al. (2005). After the field-aligned beam was observed the plasma sheet center moved towards Galileo (see Section 3.1, Figure 1). As it is expected from the reconnection scenario the bulk release of particles (see vertical dashed line (2) in Figure 1) at the Alfvénic speed is observed at 1200 UT on day 152, as studied by Kronberg et al. (2008b). From the comparison of the flow speed of the bursty bulk flows was compared with the Alfvén speed. We can assume that during this time the reconnection process was ongoing and that the electron beam has possibly been mirrored at the next X-point as in a magnetic bottle bouncing between two mirror points on loop field lines (i.e. multiple X-line formation is assumed, see also Kasahara et al., submitted to JGR) or launched from another X-line. Also the bi-directional streaming electrons are commonly observed in the terrestrial plasma sheet boundary layers (Walsh et al., 2011). Ions arrived at least 11 min later at 0710 UT. The third panel of Figure 2 shows the first order directional anisotropy components of ions (65-120 keV) in radial and azimuthal directions. During this event the ions moved clearly predominantly radially outward with an anti-corotational component. Those ions moved also along the magnetic field direction as indicated in the pitch angle distributions (panel 5 of Figure 2). Ion fluxes exhibit an energy dispersion in the sense that the intensities of high energy ions increase first. Assuming that the electrons have a single source (e.g. released at the reconnection site during the onset phase), the distance from Galileo to the source (e.g. the reconnection line) can be roughly estimated from the delay time between different species. We must point out that the time resolution of the EPD data is 11 minutes and therefore the following calculations have large error bars. Ions measured in the a1 channel (42-65 keV), mainly protons, with a geometric mean energy of 52 keV (speed of 3200 km s-1) arrive 22 min later than electrons. This gives a distance of 60 30 According to these calculations the distance from the source to Galileo was between 30 and 90 . Consequently a source would be located at 40 30 from the planet. The source location is slightly closer to the planet than those derived by Woch et al. (2002) but still similar within the error bar. Even if the delay calculations are rough, this event presents an energy dispersion of different particles: electrons arrive first, and then high energy ions followed later by lower energy ions. This implies a single source of these field-aligned beams. One can claim that the observed dispersion is related to gyroradius effect or gradient effects. We estimate the gyroperiod of the proton of 9 s in this magnetic environment. We see that the accumulation time of 11 min is much longer than the proton gyroperiod. Additionally, the spacecraft passes 0.002 during one accumulation time of the EPD instrument (the Galileo speed is 3.210-6 ). This distance is the same order of magnitude as the proton gyroradius of a field-aligned beam. Therefore, the spacecraft could be considered basically stationary relative to the ion motion. The ion dispersion is also not related to drift, as they would lead to much longer time delays.
3.3 Event 2: TCR and magnetic-islands like structure
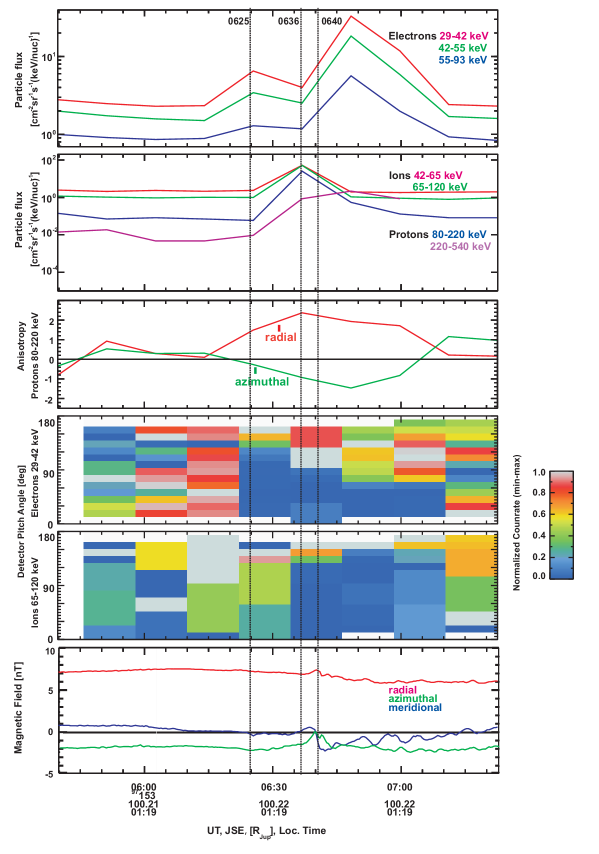
Another field-aligned beam was observed during the reconfiguration event on DOY 153 at 0620 and is shown by vertical dashed line (3) in Figure 1. Details are presented in Figure 4 in the same format as for Event 1 in Figure 2. During this beam significant increases by more than one order of magnitude of the ion intensities (42 keV to 1.7 MeV) and by one order of magnitude of the electron intensities (15 to 304 keV) are observed. Again, the first order flow anisotropy shows that the ions during this event were flowing radially outward in anti-corotational direction. Location of this event relative to the plasma sheet configuration is sketched in Figure 3. The meridional magnetic field component becomes negative at 0625 UT (northward directed) suggesting a tailward flow in the plasma sheet (Kronberg et al., 2008b) in case of a neutral line formation. At the same time the field-aligned electrons followed by the field-aligned ions (arrived later at 0636 UT) are observed. The delays between electrons and ions are the same as in the example in Section 3.2 suggesting similar nature of the field-aligned beam. At 0640 UT a signature of a flux rope or TCR is seen in the magnetic field, i.e. increase in the radial magnetic field component, bipolar signature in the meridional magnetic field component. Additionally, the disappearance of the anti-phase signature between the azimuthal and radial magnetic field components as in usual quiet configuration ( reaching zero) is observed. The flux rope-like magnetic field (increased radial magnetic field component together with the bipolar signature in the meridional magnetic field component, see e.g., Zong et al. (2004)) is associated with ion field-aligned beam parallel to the magnetic field. The proton intensity increased by almost 3 orders of magnitude. After the flux-rope structure decaying oscillations in the meridional magnetic field component are observed. These oscillations could indicate small scale magnetic islands (probably created by magnetic reconnection), or they are imprints of the post-plasmoid plasma sheet structure as shown in Mukai (2000). We conclude that these field-aligned electron and ion beams are (1) associated with TCR mentioned as a reconnection event in the study of Vogt et al. (2010), (2) followed by the bursty bulk flow reversal (see vertical line (4) in Figure 1), and (3) show the energy dispersion. All these features imply that the observed field-aligned electron and ion beams are associated with a reconnection process.
3.4 Event 3: Observations of bi-directional field-aligned electron flow – timing and reconnection scenario
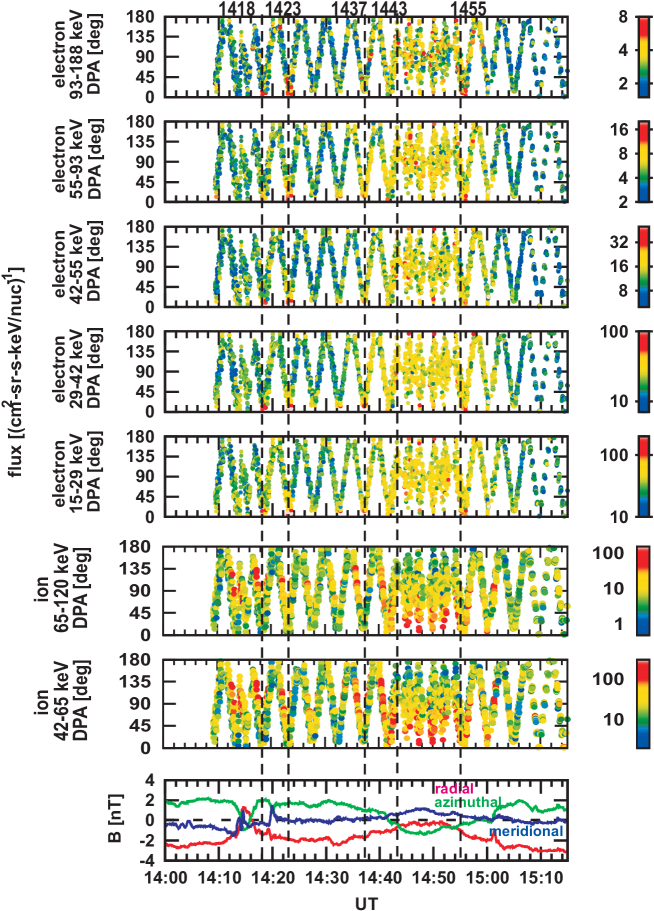
Another example of field-aligned particle beams is shown in Figure 5 observed on day 1996 283 from 1100 to 1500 UT . During this time Galileo was located in the pre-dawn sector of the magnetotail (03:19 LT) at R = 113 Location of this event relative to the plasma sheet configuration is sketched in Figure 3. These field-aligned beams preceded the bursty bulk flows in the reconfiguration event from the list by Kronberg et al. (2005). The first order flow anisotropy shows that the ions during this event flow radially outward in anti-corotational direction. Here again the dispersion is observed. At 1151 UT, a bi-directional, field-aligned electron flow (29 to 42 keV) arrival was observed (seen in the DPA distribution). Then at 1214 UT the electron flux was mono-directional field-aligned and changed to bi-directional field-aligned again between 1225 and 1259 UT. Simultaneously with this strong electron beam (in our time resolution) protons with energies from 220 to 540 keV arrived at 1214 UT. At 1225 UT the field-aligned ions with energies of 65-120 keV and protons (80 to 220 keV) followed by oxygen (26 to 51 keV/nuc) arrived at 1248 UT and eventually sulfur (16 to 30 keV/nuc) at 1236 UT. Assuming that the X-line as the source of all these flows, this scenario can be checked. As the arrival of the electrons is not clearly determined, we estimate the distance X to the X-line using the formula where is the sulfur speed and is the proton speed, is the time delay between the arrival of protons and sulfur 23 min. We obtain the distance from Galileo to the X-line equal to 52 26 . This also agrees with the statistical X-line derived by Woch et al. (2002). For the given location it is approximately at 70 . Therefore, it is likely that particles were released from a single extended source and the time-of-flight dispersion theory works and the presented example fits the X-line reconnection scenario. It is not likely that gyroradius effects and gradient effects influence the results for this event, as the magnetic field during the field-aligned beam was stable and the spacecraft was approximately at the same position in the lobe region. We also note that this event was not considered as a reconnection event by Vogt et al. (2010).
3.5 Event 4: The structure of an electron beam
Figure 6 presents an event on DOY 235 of 1997 showing the spacial structure of the electron beam. During this event Galileo was located in the pre-dawn sector of the magnetotail (00:56 LT) at R = 129.9 As the particle data were acquired with the full time resolution in this particular period, we see the covered pitch angle and the associated particle flux due to the instrument rotation. The magnetic field is plotted in SIII coordinate system. Galileo was located southward of the current sheet center during most of this period. Anti-parallel field-aligned electron beam is observed in several channels (15 to 188 keV), from to UT (see in DPA distributions as red dots close to 0∘). The beam almost disappeared during 1427-1429 UT, indicating that this is the intermittent and/or localized beam. This beam is associated with the bipolar signatures in the meridional magnetic field component at 1420 UT. This event shows a mono-directional electron beam, consistent with an X-line planetward of the Galileo spacecraft. The field-aligned ion beam is seen at energies 65-120 keV and 42-65 keV during 1443-1455 UT. During the neutral sheet approaching at around 1443-1455 UT, electron flux is enhanced by a factor of 2 compare to the period at 1420-1435 UT in the plasma sheet boundary layer, the particle distribution is isotropic. The fluxes in the plasma sheet are higher compared to those at the boundary layer. All these suggests a closed field line topology (Sarafopoulos et al., 1997). An unambiguous evidence of the beam layer structure is seen. Namely, the electron beam propagates at the outer edge of the thin current sheet and an isotropic distribution is observed around the current sheet center. This cannot be clearly evidenced by low-resolution data due to the ambiguous pitch angle determination around the magnetic field reversal. The field-aligned beam is preceded by the plasmoids and associated with the magnetic field dipolarization. The meridional magnetic field component is already negative before (unfortunately the particle data are not available in that resolution before 1408 UT). Therefore, there could be a formation of a large plasmoid or post plasmoid plasma sheet followed by smaller asymmetric plasmoid (at 1414 UT) and dipolarization (at 1420 UT) characterized by a strong and steep increase of the meridional magnetic field component, preceded by a much less negative dip, as in the terrestrial cases observed and simulated by e.g. Sitnov et al. (2009); Runov et al. (2009); Ge et al. (2011). This bipolar change of the meridian magnetic field component followed by a dipolarization front can also be explained to be caused by the tailward movement of reconnection site, followed further by dipolarization of the magnetic field at planetward side of reconnection site. During the plasmoid passage, the neutral sheet crossing took place during between 1414 and 1416 UT and no electron flux enhancement was observed. This is different from the terrestrial case where the plasmoids centers are associated with increases in the electron flux (Chen et al., 2008). An approximate location of the spacecraft trajectory relative to the plasma sheet configuration, between 14:00 and 14:18 UT, is sketched in Figure 3.
4 Discussion
In the previous section we presented examples of the field-aligned electron
and ion beams in energetic particle data measured onboard the Galileo
spacecraft in the jovian magnetotail. We investigated the Galileo orbits G2,
E6, G8, C9, C10 and E16, searched for such field-aligned beams and found 30
events. For these events we required:
(1) observation during more than one
accumulation time (that excludes spikes due to instrumental effects);
(2)
the radial flow anisotropy dominates the corotational one and
(3) the ion
pitch angle distributions show that the particle flow is predominantly
parallel/anti-parallel to the magnetic field. The distribution of these
events in the jovian magnetosphere along the Galileo orbits is shown in
Figure 7.
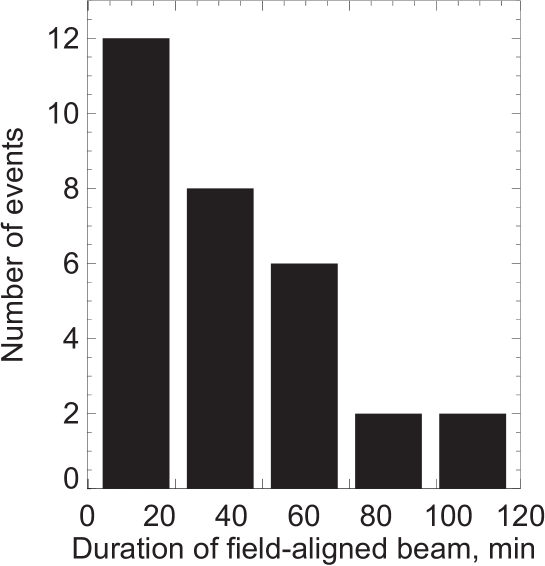
It is possible that due to the low time resolution of the EPD instrument many
field-aligned beams were not detected. We listed the duration of the
field-aligned beams in Table 3, which is on average 55.6 minutes.
Statistically most events have a duration between 20 and 40 minutes (see the
occurrence rate of field-aligned beams versus its duration in Figure
8). The distribution of events versus duration time confirms that it
is likely that many field-aligned beams have shorter duration than 20
minutes.
All 30 field-aligned beams investigated in this study are associated with
those 34 jovian reconfiguration events listed in Kronberg et al. (2005). During 15 of
them we observe the field-aligned beams. During 8 of these 15 events several
field-aligned beams are seen. These field-aligned beams seem to be a
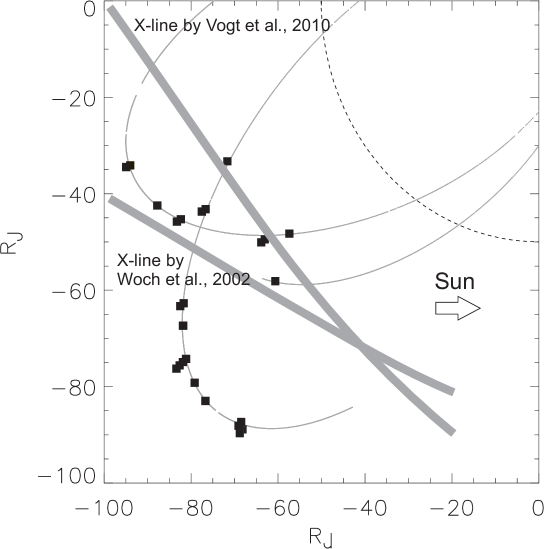
constituent part of the jovian reconfiguration process. In Figure 7
we show the location of the X-lines derived by Woch et al. (2002) and
Vogt et al. (2010). The field-aligned beams are concentrated close to these
lines. Therefore, we believe that the field-aligned beams are signatures of
reconnection, which occur during the reconfiguration in the jovian
magnetotail.
Now we would like to estimate the mass and energy input of the field-aligned
beams in the content of the jovian energy budget. The mass which carries a
field-aligned beam can be estimated as follows:
where is a typical number density in the jovian magnetotail (Frank et al., 2002). We assume that oxygen is the average ion contained in the jovian plasma sheet. The volume, of the field-aligned beam can be assessed as the length of the beam where is the field-aligned beam speed and is the duration, multiplied with the assumed vertical extent 1 and the azimuthal extent 25 . As average speed of the field-aligned beam we use the speed of the ions in the plasma sheet boundary layers, 800 km s-1 derived by Kronberg et al. (2008b) and as duration we take an average duration of the field-aligned beam derived above, 60 min. Therefore, the mass release during one field-aligned beam is in the order of 100 tons. This is lower compared to the mass of plasmoids derived by Kronberg et al. (2008a); Bagenal and Delamere (2011), 800 tons and 2500 tons, respectively. The kinetic energy of the field-aligned beam can be evaluated from the formula
This will lead to J. Therefore, the power of the field-aligned beam will be in the order of 9 TW, for an averaged duration of the beam of 60 min. This power will be enough to supply for instance jovian polar auroral emissions, see (e.g., Radioti et al., 2010). In this paper we investigated the events in the PSBL or lobe regions. According to the X-type reconnection scenario by Schindler (2007), we observe the field-aligned electron and ion beams in the PSBL. In the paper of Grigorenko et al. (2009), two types of electron distribution are reported: (1) when the electrons are isotropic and (2) when electrons flow along the magnetic field lines. The first case is associated with the non-adiabatic acceleration by the quasi-steady dawn-dusk electric field and is not necessary associated with substorm-like activity. The beams of the second type are usually generated close to the X-line. We check the distribution of the particle flux in the three directions relative to the magnetic field using the DPA: anti-parallel, DPA40 parallel, DPA140∘ and perpendicular, 70DPA110∘. We would like to note that due to the plasma corotation in the jovian plasma sheet, many of the field-aligned flows will still have quite a substantial corotational component. This is reflected in the pitch angle distributions as an increased perpendicular component. 23 events with field-aligned ion beams are associated with anisotropic electrons, i.e. which flow along the magnetic field and 13 of them are associated with reconnection events studied by Vogt et al. (2010) derived from the magnetometer data. The characteristics of the field-aligned ion beams are seen in Table 3. The propagation of the ions and electrons parallel or antiparallel to the magnetic field confirm the quadrupolar X-line configuration, see Figure 3. Slightly more than half of the field-aligned beams are associated with reconnection events observed by Vogt et al. (2010). Why not more? The reasons could be (1) different arrival times of field-aligned beams and plasmoids; (2) the field-aligned beams are mainly located in the lobe region where reconnection signatures might be smoothed. In 7 cases field-aligned ion beams are associated with the isotropic electron distribution, see Table 3. Therefore, they might be accelerated not at the X-line. Most of these events, namely 5, has no association with the reconnection events from Vogt et al. (2010). This is expected.
5 Summary
(1) We presented two examples (Event 1, Event 3) of the counterstreaming electron beams in the plasma sheet boundary layers. According to Vogiatzis et al. (2006); Åsnes et al. (2008) the counterstreaming electron beams occur due to the bouncing between two mirror points on closed field lines in the plasma sheet. They could also occur due to the travelling of electrons between multiple X-lines. (2) Most of the field-aligned ion events are associated with the field-aligned electron beams which according to Grigorenko et al. (2009) are related to electron acceleration in the X-line vicinity. (3) The timing of the arrival of the field-aligned beams for the different species in many events (e.g. Event 1, Event 2, Event 3) is in accordance to the time-dispersion when the source is at one point/line (Keiling et al., 2004). Also Hill et al. (2009) observed the time dispersion of the energetic ions of different species using data from New Horizons. (4) Observations of all types of the plasma release from plasmoid or flux rope, its imprint in the PSBL – TCR and dipolarization are in accordance to the reconnection theory and all are associated with the electron and ion field-aligned beams (Event 2, Event 3, Event 4). (5) We show evidence that the electron beam propagates in the PSBL while isotropic distribution is observed around the current sheet center (Event 4). (6) Observations of the flow reversals in 53 of the jovian reconfiguration events from Kronberg et al. (2005) imply X-line crossing, see an example in Section 3.1, Figure 1. (7) All field-aligned beams are associated with the jovian reconfiguration events. Based on all these arguments we believe that reconfiguration processes in the jovian magnetotail are associated with reconnection.
6 Acknowledgements
The authors thank A. Lagg for the provided EPD software and useful discussions.
References
- Åsnes et al. (2008) Åsnes, A., Taylor, M. G. G. T., Borg, A. L., Lavraud, B., Friedel, R. W. H., Escoubet, C. P., Laakso, H., Daly, P., Fazakerley, A. N., May 2008. Multispacecraft observation of electron beam in reconnection region. J. Geophys. Res. 113, 7.
- Angelopoulos et al. (1994) Angelopoulos, V., Kennel, C. F., Coroniti, F. V., Pellat, R., Kivelson, M. G., Walker, R. J., Russell, C. T., Baumjohann, W., Feldman, W. C., Gosling, J. T., Nov. 1994. Statistical characteristics of bursty bulk flow events. J. Geophys. Res. 99, 21257–21280.
- Angelopoulos et al. (2008) Angelopoulos, V., McFadden, J. P., Larson, D., Carlson, C. W., Mende, S. B., Frey, H., Phan, T., Sibeck, D. G., Glassmeier, K.-H., Auster, U., Donovan, E., Mann, I. R., Rae, I. J., Russell, C. T., Runov, A., Zhou, X.-Z., Kepko, L., Aug. 2008. Tail Reconnection Triggering Substorm Onset. Science 321, 931–935.
- Bagenal and Delamere (2011) Bagenal, F., Delamere, P. A., May 2011. Flow of mass and energy in the magnetospheres of Jupiter and Saturn. Journal of Geophysical Research (Space Physics) 116, A05209.
- Chen et al. (2008) Chen, L.-J., Bhattacharjee, A., Puhl-Quinn, P. A., Yang, H., Bessho, N., Imada, S., Mühlbachler, S., Daly, P. W., Lefebvre, B., Khotyaintsev, Y., Vaivads, A., Fazakerley, A., Georgescu, E., Jan. 2008. Observation of energetic electrons within magnetic islands. Nature Physics 4, 19–23.
- Dessler (1983) Dessler, A. J., 1983. Coordinate Systems. In: Dessler, A.J. (Editor), Physics of the Jovian magnetosphere, Cambridge University Press.
- Frank et al. (2002) Frank, L. A., Paterson, W. R., Khurana, K. K., Jan. 2002. Observations of thermal plasmas in Jupiter’s magnetotail. J. Geophys. Res. 107, A1, 1003.
- Ge et al. (2007) Ge, Y. S., Jian, L. K., Russell, C. T., Dec. 2007. Growth phase of Jovian substorms. Geophys. Res. Lett. 34, L23106.
- Ge et al. (2011) Ge, Y. S., Raeder, J., Angelopoulos, V., Gilson, M. L., Runov, A., Jan. 2011. Interaction of dipolarization fronts within multiple bursty bulk flows in global MHD simulations of a substorm on 27 February 2009. J. Geophys. Res. 116, A00I23.
- Ge et al. (2010) Ge, Y. S., Russell, C. T., Khurana, K. K., Sep. 2010. Reconnection sites in Jupiter’s magnetotail and relation to Jovian auroras. Planet. Space Sci. 58, 1455–1469.
- Grigorenko et al. (2009) Grigorenko, E. E., Hoshino, M., Hirai, M., Mukai, T., Zelenyi, L. M., Mar. 2009. “Geography” of ion acceleration in the magnetotail: X-line versus current sheet effects. J. Geophys. Res. 114, A03203.
- Hill et al. (2009) Hill, M. E., Haggerty, D. K., McNutt, R. L., Paranicas, C. P., Nov. 2009. Energetic particle evidence for magnetic filaments in Jupiter’s magnetotail. J. Geophys. Res. 114, 11201.
- Hones (1979) Hones, E. W., May 1979. Transient phenomena in the magnetotail and their relation to substorms. Space Science Reviews 23, 393–410.
- Keiling et al. (2004) Keiling, A., Rème, H., Dandouras, I., Bosqued, J. M., Sergeev, V., Sauvaud, J., Jacquey, C., Lavraud, B., Louarn, P., Moreau, T., Vallat, C., Escoubet, C. P., Parks, G. K., McCarthy, M., Möbius, E., Amata, E., Klecker, B., Korth, A., Lundin, R., Daly, P., Zong, Q., May 2004. New properties of energy-dispersed ions in the plasma sheet boundary layer observed by Cluster. J. Geophys. Res. 109, A05215.
- Kivelson et al. (1992) Kivelson, M. G., Khurana, K. K., Means, J. D., Russell, C. T., Snare, R. C., 1992. The Galileo magnetic field investigation. Space Science Reviews 60, 357–383.
- Kronberg et al. (2008a) Kronberg, E. A., , Woch, J., Krupp, N., Lagg, A., Daly, P. W., Korth, A., 2008a. Comparison of periodic substorms at Jupiter and Earth. J. Geophys. Res. 113, A04212.
- Kronberg et al. (2007) Kronberg, E. A., Glassmeier, K.-H., Woch, J., Krupp, N., Lagg, A., Dougherty, M. K., May 2007. A possible intrinsic mechanism for the quasi-periodic dynamics of the Jovian magnetosphere. J. Geophys. Res. 112, A05203.
- Kronberg et al. (2008b) Kronberg, E. A., Woch, J., Krupp, N., Lagg, A., Oct. 2008b. Mass release process in the Jovian magnetosphere: Statistics on particle burst parameters. J. Geophys. Res. 113, A10202.
- Kronberg et al. (2009) Kronberg, E. A., Woch, J., Krupp, N., Lagg, A., Jun. 2009. A summary of observational records on periodicities above the rotational period in the Jovian magnetosphere. Annales Geophysicae 27, 2565–2573.
- Kronberg et al. (2005) Kronberg, E. A., Woch, J., Krupp, N., Lagg, A., Khurana, K. K., Glassmeier, K.-H., Mar. 2005. Mass release at Jupiter: Substorm-like processes in the Jovian magnetotail. J. Geophys. Res. 110, A03211.
- Krupp et al. (2001) Krupp, N., Lagg, A., Livi, S., Wilken, B., Woch, J., Roelof, E. C., Williams, D. J., Nov. 2001. Global flows of energetic ions in Jupiter’s equatorial plane: First-order approximation. J. Geophys. Res. 106, 26017–26032.
- Krupp et al. (1998) Krupp, N., Woch, J., Lagg, A., Wilken, B., Livi, S., Williams, D. J., Apr. 1998. Energetic particle bursts in the predawn Jovian magnetotail. Geophys. Res. Lett. 25, 1249–1252.
- Lagg (1998) Lagg, A., 1998. Energiereiche Teilchen in der inneren Jupitermagnetosphäre: Simulation und Ergebnisse des EPD-Experimentes an Bord der Raumsonde Galileo. Ph.D. thesis, University of Innsbruck.
- Manapat et al. (2006) Manapat, M., Øieroset, M., Phan, T. D., Lin, R. P., Fujimoto, M., Mar. 2006. Field-aligned electrons at the lobe/plasma sheet boundary in the mid-to-distant magnetotail and their association with reconnection. Geophys. Res. Lett. 33, L05101.
- McComas et al. (2007) McComas, D. J., Allegrini, F., Bagenal, F., Crary, F., Ebert, R. W., Elliott, H., Stern, A., Valek, P., Oct. 2007. Diverse Plasma Populations and Structures in Jupiter’s Magnetotail. Science 318, 217–220.
- McNutt et al. (2007) McNutt, R. L., Haggerty, D. K., Hill, M. E., Krimigis, S. M., Livi, S., Ho, G. C., Gurnee, R. S., Mauk, B. H., Mitchell, D. G., Roelof, E. C., McComas, D. J., Bagenal, F., Elliott, H. A., Brown, L. E., Kusterer, M., Vandegriff, J., Stern, S. A., Weaver, H. A., Spencer, J. R., Moore, J. M., Oct. 2007. Energetic Particles in the Jovian Magnetotail. Science 318, 220–222.
- Mukai (2000) Mukai, T., 2000. Plasma Distribution Functions in Plasmoids: Geotail Observations. Advances in Space Research 26, 415–424.
- Nagai et al. (2001) Nagai, T., Shinohara, I., Fujimoto, M., Hoshino, M., Saito, Y., Machida, S., Mukai, T., Nov. 2001. Geotail observations of the Hall current system: Evidence of magnetic reconnection in the magnetotail. J. Geophys. Res. 106, 25929–25950.
- Nishida (1983) Nishida, A., Jun. 1983. Reconnection in the Jovian magnetosphere. Geophys. Res. Lett. 10, 451–454.
- Radioti et al. (2010) Radioti, A., Grodent, D., Gérard, J.-C., Bonfond, B., Jul. 2010. Auroral signatures of flow bursts released during magnetotail reconnection at Jupiter. Journal of Geophysical Research (Space Physics) 115, A07214.
- Runov et al. (2009) Runov, A., Angelopoulos, V., Sitnov, M. I., Sergeev, V. A., Bonnell, J., McFadden, J. P., Larson, D., Glassmeier, K., Auster, U., Jul. 2009. THEMIS observations of an earthward-propagating dipolarization front. Geophys. Res. Lett. 36, A014106.
- Russell et al. (1998) Russell, C. T., Khurana, K. K., Huddleston, D. E., Kivelson, M. G., May 1998. Localized Reconnection in the Near Jovian Magnetotail. Science 280, 1061–1064.
- Russell et al. (2000) Russell, C. T., Khurana, K. K., Kivelson, M. G., Huddleston, D. E., 2000. Substorms at Jupiter: Galileo Observations of Transient Reconnection in the Near Tail. Advances in Space Research 26, 1499–1504.
- Sarafopoulos et al. (1997) Sarafopoulos, D. V., Sarris, E. T., Angelopoulos, V., Yamamoto, T., Kokubun, S., Oct. 1997. Spatial structure of the plasma sheet boundary layer at distances greater than 180 R E as derived from energetic particle measurements on GEOTAIL. Annales Geophysicae 15, 1246–1256.
- Schindler (2007) Schindler, K., 2007. Physics of Space Plasma Activity . Cambridge.
- Sitnov et al. (2009) Sitnov, M. I., Swisdak, M., Divin, A. V., Apr. 2009. Dipolarization fronts as a signature of transient reconnection in the magnetotail. J. Geophys. Res. 114, A04202.
- Slavin et al. (2003) Slavin, J. A., Owen, C. J., Dunlop, M. W., Borälv, E., Moldwin, M. B., Sibeck, D. G., Tanskanen, E., Goldstein, M. L., Fazakerley, A., Balogh, A., Lucek, E., Richter, I., Reme, H., Bosqued, J. M., Dec. 2003. Cluster four spacecraft measurements of small traveling compression regions in the near-tail. Geophys. Res. Lett. 30, 7.
- Slavin et al. (1995) Slavin, J. A., Owen, C. J., Kuznetsova, M. M., Hesse, M., 1995. ISEE 3 observations of plasmoids with flux rope magnetic topologies. Geophys. Res. Lett. 22, 2061–2064.
- Vasyliūnas et al. (1997) Vasyliūnas, V. M., Frank, L. A., Ackerson, K. L., Paterson, W. R., 1997. Geometry of the plasma sheet in the midnight-to-dawn sector of the Jovian magnetosphere: Plasma observations with the Galileo spacecraft. Geophys. Res. Lett. 24, 869–872.
- Vogiatzis et al. (2006) Vogiatzis, I. I., Fritz, T. A., Zong, Q., Sarris, E. T., Aug. 2006. Two distinct energetic electron populations of different origin in the Earth’s magnetotail: a Cluster case study. Annales Geophysicae 24, 1931–1948.
- Vogt et al. (2010) Vogt, M. F., Kivelson, M. G., Khurana, K. K., Joy, S. P., Walker, R. J., Jun. 2010. Reconnection and flows in the Jovian magnetotail as inferred from magnetometer observations. J. Geophys. Res. 115, A06219.
- Waldrop et al. (2005) Waldrop, L. S., Fritz, T. A., Kivelson, M. G., Khurana, K., Krupp, N., Lagg, A., May 2005. Jovian plasma sheet morphology: particle and field observations by the Galileo spacecraft. Planet. Space Sci. 53, 681–692.
- Walsh et al. (2011) Walsh, A. P., Owen, C. J., Fazakerley, A. N., Forsyth, C., Dandouras, I., Mar. 2011. Average magnetotail electron and proton pitch angle distributions from Cluster PEACE and CIS observations. Geophys. Res. Lett. 380, L06103.
- Williams et al. (1992) Williams, D. J., McEntire, R. W., Jaskulek, S., Wilken, B., 1992. The Galileo Energetic Particles Detector. Space Science Reviews 60, 385–412.
- Woch et al. (1999) Woch, J., Krupp, N., Khurana, K. K., Kivelson, M. G., Roux, A., Perraut, S., Louarn, P., Lagg, A., Williams, D. J., Livi, S., Wilken, B., Jul. 1999. Plasma sheet dynamics in the Jovian magnetotail: Signatures for substorm-like processes? Geophys. Res. Lett. 26, 2137–2140.
- Woch et al. (2002) Woch, J., Krupp, N., Lagg, A., Apr. 2002. Particle bursts in the Jovian magnetosphere: Evidence for a near-Jupiter neutral line. Geophys. Res. Lett. 29, 42–1.
- Woch et al. (1998) Woch, J., Krupp, N., Lagg, A., Wilken, B., Livi, S., Williams, D. J., Apr. 1998. Quasi-periodic modulations of the Jovian magnetotail. Geophys. Res. Lett. 25, 1253–1256.
- Zimbardo (1993) Zimbardo, G., May 1993. Observable implications of tearing-mode instability in Jupiter’s nightside magnetosphere. Planet. Space Sci. 41, 357–361.
- Zong et al. (2004) Zong, Q.-G., Fritz, T. A., Pu, Z. Y., Fu, S. Y., Baker, D. N., Zhang, H., Lui, A. T., Vogiatzis, I., Glassmeier, K.-H., Korth, A., Daly, P. W., Balogh, A., Reme, H., Sep. 2004. Cluster observations of earthward flowing plasmoid in the tail. Geophys. Res. Lett. 31, L18803.
| Ions (LEMMS) | Electrons (LEMMS) | ||
| Channel | Energy range (keV) | Channel | Energy range (keV) |
| a0 | 22-42 | e0 | 15-29 |
| a1 | 42-65 | e1 | 29-42 |
| a2 | 65-120 | e2 | 42-55 |
| a3 | 120-280 | e3 | 55-93 |
| a4 | 280-515 | f0 | 93-188 |
| a5 | 515-825 | f1 | 174-304 |
| a6 | 825-1680 | f2 | 304-527 |
| a7 | 1680-3200 | f3 | 527-884 |
| Ions (CMS) | |||
| Species | Channel | Energy range (keV/nuc) | |
| Protons | tp1 | 0.08-0.22 | |
| tp2 | 0.22-0.54 | ||
| tp3 | 0.54-1.25 | ||
| Oxygen+Sulfur | to1 | 0.012-0.026 | |
| Oxygen | to2 | 0.026-0.051 | |
| Sulfur | ts1 | 0.016-0.030 | |
| ts2 | 0.030-0.062 |
| Time interval, Year, DOY, UT | Radial Distance, | LT | Duration, min | Association with the reconnection events from Vogt et al. (2010) | Characteristics |
|---|---|---|---|---|---|
| Ion beams associated with the anisotropic electrons as derived from tp1 channel. | |||||
| 1996 264 1915–1955 | 88 | 0158 | 40 | y | protons a, electrons assymetric |
| 1996 264 2055–2143 | 88 | 0158 | 48 | y | protons, electrons , not clear case |
| 1996 270 23218–271 0020 | 103 | 0230 | 62 | n | protons, electrons b, not clear case |
| 1996 271 0945–1022 | 0230 | 103 | 37 | n | protons , electrons bi-directional |
| 1996 272 2335–273 0011 | 106 | 0238 | 36 | y | protons, electrons |
| 1996 275 0945–1145 | 110 | 0250 | 120 | y | protons, electrons |
| 1996 275 1931–2045 | 110 | 0250 | 74 | y | protons, electrons |
| 1996 277 2318–2357 | 112 | 0300 | 39 | n | protons, electrons |
| 1996 278 0125–0220 | 112 | 0300 | 55 | n | protons, electrons |
| 1996 280 1602–1730 | 113 | 0309 | 73 | n | protons, electrons from to , current sheet crossing |
| 1996 283 1220–1315 | 112 | 0330 | 50 | n | protons , electrons bi-directional |
| 1996 283 2018–2117 | 112 | 0330 | 59 | y | protons, electrons |
| 1996 284 0029–0205 | 112 | 0330 | 91 | y | protons , electrons bi-directional |
| 1996 285 0415–0450 | 111 | 0328 | 35 | n | asymmetric protons and electrons |
| 1996 285 0525–0725 | 111 | 0328 | 120 | y | protons, electrons |
| 1996 285 1415–1510 | 111 | 0328 | 55 | y | protons, electrons |
| 1997 079 0207–0229 | 84 | 0255 | 22 | n | asymmetric protons and electrons, not clear case |
| Time interval, Year, DOY, UT | Radial Distance, | LT | Duration, min | Association with the reconnection events from Vogt et al. (2010) | Characteristics |
|---|---|---|---|---|---|
| Ion beams associated with the anisotropic electrons as derived from tp1 channel. | |||||
| 1997 152 0703–0740 | 100 | 0120 | 37 | n | protons , electrons bi-directional |
| 1997 153 0620–0700 | 100 | 0120 | 40 | y | protons, electrons |
| 1997 158 0900–0922 | 97.5 | 0143 | 22 | y | protons , electrons assymetric |
| 1997 161 1200–1300 | 94 | 0155 | 60 | y | protons , electrons assymetric |
| 1997 166 2025–2115 | 79.5 | 0230 | 50 | y | protons , electrons assymetric |
| 1997 166 2155–2227 | 79.5 | 0230 | 32 | n | asymmetric protons and electrons |
| Ion beams associated with the isotropic electrons | |||||
| 1996 262 1525–1629 | 79 | 0140 | 64 | n | protons |
| 1996 271 0233–0345 | 103 | 0230 | 72 | y | protons |
| 1996 273 0350–0430 | 106 | 0238 | 35 | n | protons |
| 1996 275 1719–1841 | 110 | 0250 | 82 | y | protons |
| 1996 275 2225–2338 | 110 | 0250 | 73 | n | protons , not clear case |
| 1997 161 1832–1920 | 94 | 0155 | 48 | n | protons |
| 1997 168 0720–0742 | 75 | 0240 | 22 | n | protons |
a denote the anti-parallel to the magnetic field flow. b denote the parallel to the magnetic field flow.