Absence of metallicity in K-doped picene: Importance of electronic correlations
Abstract
Potassium-doped picene (Kxpicene) has recently been reported to be a superconductor at with critical temperatures up to 18 K. Here we study the electronic structure of K-doped picene films by photoelectron spectroscopy and ab initio density functional theory combined with dynamical mean-field theory (DFT+DMFT). Experimentally we observe that, except for spurious spectral weight due to the lack of a homogeneous chemical potential at low K-concentrations (), the spectra always display a finite energy gap. This result is supported by our DFT+DMFT calculations which provide clear evidence that Kxpicene is a Mott insulator for integer doping concentrations , 2, and 3. We discuss various scenarios to understand the discrepancies with previous reports of superconductivity and metallic behavior.
pacs:
71.20.Tx,79.60.Fr,71.15.Mb,71.27.+aSince the discovery of superconductivity in layered organic charge transfer salts in the late 1970s Toyota et al. (2007), a large variety of organic superconductors have been reported with critical temperatures ranging from a few Kelvins to values as high as 38 K in the case of alkali metal-doped fullerenes Palstra et al. (1995). Whether superconductivity is driven by electron-phonon interactions or by electronic correlations has been a subject of intense debate in the last decade, and indeed a significant fraction of these systems are presently being discussed as correlated materials Capone et al. (2002); Powell and McKenzie (2011). Recently, a pronounced Meissner-Ochsenfeld-effect indicating a transition temperature of 18 K was observed in polycrystalline powder samples of potassium-doped picene Mitsuhashi et al. (2010). Moreover, the recent observation of zero resistivity below 7 K supports these findings Teranishi et al. (2013). The parent compound picene is a wide band-gap semiconductor (gap 3.3 eV Okamoto et al. (2008)) consisting of planar molecules with five aromatic benzene rings (see inset in Fig. 1). The observation of superconductivity upon K intercalation has also been reported in other aromatic semiconductors, viz., phenanthrene, coronene and dibenzopentacene Wang et al. (2011); Kubozono et al. (2011); Xue et al. (2012).
In a simple one-electron picture, K-intercalation is expected to induce electron transfer into the lowest unoccupied molecular orbital (LUMO) of picene, leading to a partially filled, i.e., metallic conduction band which at low temperatures would host the superconductivity, as suggested in various theoretical studies Kosugi et al. (2009); Roth et al. (2010); de Andres et al. (2011); Kosugi et al. (2011); Cudazzo et al. (2011); Kubozono et al. (2011); Subedi and Boeri (2011); Casula et al. (2011); Kato et al. (2011); Casula et al. (2012). However, such calculations include electronic correlations only at the level of the exchange-correlation functional considered within density functional theory (DFT) and neglect electron-phonon interactions. Both effects can be quite pronounced in molecular solids Claessen et al. (2002). In fact, the importance of electron-electron correlations in K3picene was pointed out by Giovannetti et al. Giovannetti and Capone (2011) and Kim et al. Kim et al. (2011) who found an insulating state with antiferromagnetic order from ab initio calculations. Experimentally, the picture of the electronic structure has remained controversial: while one photoemission study reported the appearance of metallic spectral weight at the Fermi level for Okazaki et al. (2010), other authors Mahns et al. (2012); Caputo et al. (2012) failed to observe a metallic Fermi edge for a wide concentration range from to and speculated about the possible role of correlations and polaronic effects Mahns et al. (2012).
In view of this unsettled situation we have investigated the electronic structure of Kxpicene in a joint experimental and theoretical effort. For this purpose, extensive photoemission measurements on pristine and potassium-doped picene films have been perfomed, accompanied by ab initio density functional theory (DFT) calculations in combination with dynamical mean field theory (DFT+DMFT). Contrary to the results of Ref. Okazaki et al., 2010, both experimental and theoretical results confirm the absence of metallic behavior for any composition of Kxpicene with integer . This insulating behavior is attributed to strong on-site (i.e., intramolecular) correlations as inferred from an analysis of the DFT+DMFT calculations.
Picene films have been grown in ultrahigh vacuum by thermal evaporation out of a Knudsen cell on clean natively oxidized Si substrates. Subsequent doping was achieved by evaporation of potassium from commercial SAES® dispensers onto the picene films at room temperature. In situ photoemission spectra were recorded at room-temperature with a total energy resolution of 0.1 and 0.7 eV using He I (21.2 eV) and monochromatized Al Kα (1486.6 eV) radiation for valence band and core level spectroscopy, respectively. All experiments have been performed at a base pressure of mbar, which during picene and K deposition did not rise above mbar and mbar, respectively. The relative intensity of the C and K core levels was used to determine the doping concentration (see also Supplemental Material). All valence band spectra have been corrected for He Iβ satellite emission.
Bulk picene crystallizes in a monoclinic unit cell with the molecules arranged in a herringbone structure De et al. (1985). As typical for planar molecules on inert substrates, our picene films grow in a 3D island mode (Vollmer-Weber type growth), with the long axis standing out from the surface in order to minimize film-substrate interaction. The c-axis parameter determined from x-ray diffraction is 13.51 Å, very close to its value in bulk material De et al. (1985); Mitsuhashi et al. (2010) (see Suppl. Mat. for further information). Due to strong K-oxidation under ambient atmosphere we have not been able to measure reliable structural parameters for the K-doped films.
On the theoretical side the crystal structure of Kxpicene () has been determined by structural relaxation within DFT using the generalized gradient approximation (GGA). The projector augmented wave basis was used as implemented in VASP Kresse and Hafner (1993); Kresse and Furthmüller (1996); Blöchl (1994); Kresse and Joubert (1999), with additional van der Waals corrections included in the relaxation process. The subsequent analysis of the electronic structure was performed with the full potential local orbital code FPLO Jeschke et al. .
Figure 1(a) shows the valence band spectrum of a pristine picene film. It is fully consistent with previous photoemission studies Xin et al. (2012); Okazaki et al. (2010); Roth et al. (2010), with the highest occupied molecular orbital (HOMO) and following bands clearly resolved at -2.2 (H), -2.8 (H-1) and -3.5 eV (H-2) relative to the experimental Fermi energy (, determined by the Fermi cut-off of a sputtered gold foil). Figure 1(b) displays the evolution of the spectra with K-doping from to 3 as measured. In agreement with previous work the doping results in additional features (F1, F2, F3) in the former bandgap and an apparent shift of the overall valence band to higher binding energies. This shift is also seen in the C core level spectrum (not shown here).
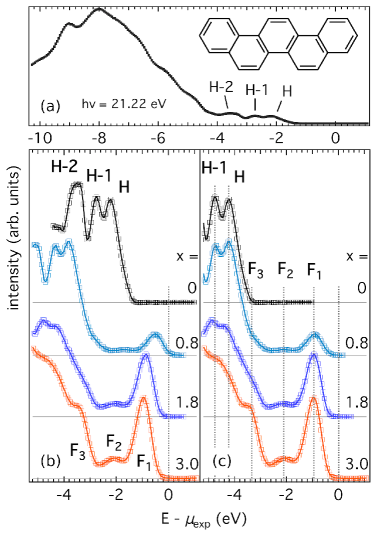
We first discuss the origin of the additional spectral features. In analogy to other alkali metal-doped organic semiconductors Ramsey et al. (1994); Koch et al. (2003) F3 is assigned to the relaxed HOMO, induced by the structural distortion experienced by the doped picene molecules. Its intensity clearly increases with doping, while the strongly decreasing (but still visible) contribution of the H and H-1 peaks in Fig. 1 reflects the diminishing fraction of uncharged molecules upon doping. The weak feature F2 can be shown to result from the oxidation of surface K atoms with oxygen present in the residual gas of the ultrahigh vacuum system Merkel et al. (1993); Ruff . Therefore, it is a purely extrinsic structure not relevant for the following discussions. Finally, the most prominent in-gap feature F1 is attributed to a (non-rigid-band-like) filling of the former lowest unoccupied molecular orbitals (LUMOs), as suggested by the theoretical calculations discussed below.
Next we turn to the evolution of the apparent binding energies in the valence band spectra. Figure 1 (b) shows that for the new peak F1 sits very close or even at the experimental Fermi level, reminiscent of the spectrum reported by Okazaki et al. Okazaki et al. (2010) for , while for larger doping concentration it clearly moves away from , leaving a (half)gap of eV. However, the near-Fermi level position of F1 around should not be mistaken for a metallic Fermi edge. First of all, its spectral onset is far too broad to account for a sharp Fermi edge, even considering thermal and instrumental broadening. Moreover, for smaller concentrations between and 1 the spectral weight of peak F1 is even observed well above the experimental Fermi energy (see Fig. S2 in the Suppl. Mat.). Such curious behavior was observed also in other alkali metal-doped organic semiconductor films and was established to result from a lack of thermodynamic equilibrium originating from the weak intermolecular van der Waals coupling Koch et al. (2003). In such a situation, charge fluctuations are strongly suppressed, thereby preventing the formation of a well-defined chemical potential. The ionic charge transfer induced by alkali metal-doping restores the equilibrium. Because in our case the doping is achieved by K-evaporation after film growth, the doping concentration will decrease from surface to substrate (note that the -values determined from core level spectroscopy are only valid for a thin surface layer given by the photoemission probing depth of a few nm). Only for sufficiently strong overall doping full equilibrium within the organic film and between film and substrate is achieved.
In our case we observe saturation of the doping-induced energy shifts at , which we identify with equilibrium, i.e., the energies of the spectrum can be safely referred to the experimental Fermi energy. Consequently, we display in Fig. 1(c) all spectra aligned at the position of the unrelaxed H and H-1 peaks of the film, which incidentally fixes also the doping-induced features at constant energies. This representation nicely shows the evolution of in-gap spectral weight upon doping, with none of the spectra displaying any metallic Fermi edge. The observation that even the phase, for which superconductivity has been claimed, remains gapped is most surprising, but in agreement with two previous reports Mahns et al. (2012); Caputo et al. (2012). As one possible explanation polaronic effects have been suggested Mahns et al. (2012), which may cause a pseudogap at the Fermi level as has been observed, e.g., in oxides Schrupp et al. (2005). However, such a pseudogap typically exhibits an exponential decay towards the Fermi energy Alexandrov and Ranninger (1992), which is not consistent with the present observation. Alternatively, the gap may originate from strong electronic correlations. In fact, in a Hubbard model-type description the intramolecular Coulomb energy in organic solids is often comparable or even larger than the bandwidth from intermolecular hopping Claessen et al. (2002); Nomura et al. (2012), which can drive partially filled bands into a Mott insulating state.
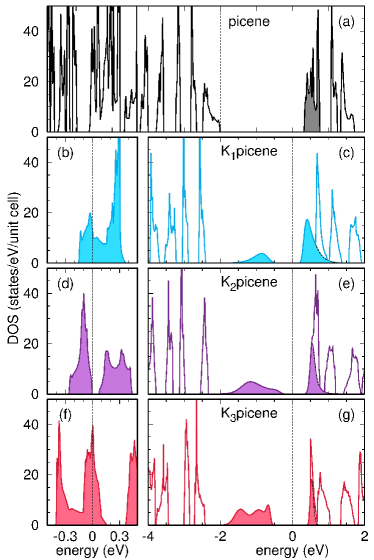
In order to further explore the latter scenario, we have studied the electronic properties of the DFT-relaxed crystal structures of Kxpicene () by a combination of DFT+DMFT calculations, which include correlation effects beyond the GGA approximation in DFT. We start first with the DOS for pristine and Kxpicene obtained within GGA (Fig. 2 (a), (b), (d) and (f)). We observe a metallic state for odd as well as a band gap for as has also been found in previous DFT calculations.
In DFT+DMFT the kinetic part of the Hamiltonian (Eq. 1) is obtained from the DFT calculations by considering the tight-binding approach. Since the DFT results indicate some hybridization between the bands derived from LUMO and LUMO+1 of the pristine picene molecules, we consider for the DMFT calculations a two-orbital Hubbard model with a Coulomb interaction and Hund’s coupling as well as on-site hopping parameters between molecular orbitals on the same site. The Hamiltonian we solve is where
| (1) |
Bands which are away from the Fermi level are not expected to be significantly renormalized by correlations, and we save on computational effort by ignoring them in the DMFT calculation. As an impurity solver for the DMFT equations we employed the weak-coupling continuous time Quantum Monte Carlo. Our results are for eV, eV and . This choice of interaction parameters was guided by recent quantum chemistry Giovannetti and Capone (2011) and constrained random phase approximation (cRPA) estimates Nomura et al. (2012). Note that for K3picene, we find the metal-insulator transition between eV (metallic) and eV (insulating). The analytic continuation of the converged impurity Green’s function to real frequencies was performed with the maximum entropy method. The resulting spectral function for these two orbitals is shown in Fig. 2, embedded into the DFT-DOS of the non-interacting bands.
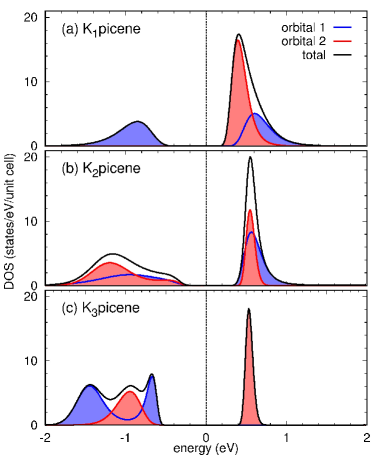
Clearly, the DMFT spectral functions show a Mott gap not only for doping levels of and , but also for which in bare DFT is a band insulator with a small gap. A closer look at the DOS (Fig. 3 (b)) of K2picene shows that – contrary to the expectation of a filled picene LUMO derived band and an empty picene LUMO+1 derived band – a Mott gap opens in both orbitals. Interestingly, energy positions and gap size do not seem to depend much on the actual doping level, except for the spectral weight transfer from upper to lower Hubbard bands, and correspond favorably with the experimental spectra, except for some fine structure at higher not resolved in photoemission. The origin of the Mott gap for Kxpicene with lies not only in the on-site Coulomb interaction and the Hund’s coupling but also in the interorbital hybridization . We would like to note that our calculations did neither include electron-phonon effects, which may reduce the Hubbard interaction, as was shown by Sangiovanni et al. Sangiovanni et al. (2005), nor magnetic ordering, where the possibility of a Mott insulator in the antiferromagnetic state could be investigated, as was found by the authors of Refs. Giovannetti and Capone, 2011; Kim et al., 2011 by performing ab initio DFT calculations. This will be a subject of future work.
Both experiment and theory thus arrive at the same conclusion that Kxpicene films are (Mott-)insulating for all compositions with integer , including the nominally superconducting phase . This leaves two open questions: (1) What is the electronic groundstate for non-integer , and (2) how can the insulating behavior of the phase be reconciled with the reports on superconductivity?
Concerning the first question we note that in a Mott-insulator deviation from integer band-filling is normally expected to lead to a metallic phase with electron- or hole-type carriers Imada et al. (1998). Note, however, that the doping concentration determined in our photoemission experiments is a macroscopic quantity, averaged over the extension of the photon spot ( mm), and may be composed of phase-separated integer-filled domains. In fact, a recent Raman study Kambe et al. (2012) has observed that Kxpicene decomposes into , 2 and 3 phases, while a defined signal could not be detected, indicating that this phase is not stable. One can thus understand the photoemission spectra as a superposition of different integer phases. Because the shape and gapped behavior of the corresponding theoretical spectra is very similar, the main doping effect will consist in the appearance and increasing spectral weight of the LUMO and LUMO+1 derived lower Hubbard band, as indeed reflected by the behavior of feature F1 in our experimental spectra.
The second question is more puzzling. Our present results are in line with the general observation that alkali metal-doped organic semiconductors are mostly insulating Koch et al. (2003); Fuentes and Knupfer (2006), with K-doped fullerene (K3C60) being one of the rare exceptions Poirier (1994). On the other hand, in the original paper by Mitsuhashi et al. it has been reported that in K2.9picene the diamagnetic (i.e., superconducting) phase is reached from a Pauli paramagnetic, hence metallic phase Mitsuhashi et al. (2010). This is also supported by the resistivity measurements by Teranishi et al. Teranishi et al. (2013). Reconciling our room-temperature results with these observations would require an insulator-to-metal transition somewhere between 300 and 25 K (the highest measured temperature in Ref. Mitsuhashi et al., 2010). The Mott-Hubbard scenario derived from our DFT+DMFT calculations does not provide any mechanism for such a transition but would rather stabilize the gap towards low temperatures.
Another important aspect is that so far all superconducting signatures have been obtained from intercalated compact picene powder Mitsuhashi et al. (2010); Kambe et al. (2012), in contrast to the in vacuo grown thin films used here. It is possible that both sets of samples differ in subtle structural details accounting for the conflicting findings. On the other hand, the DFT+DMFT calculations are based on a DFT-relaxed bulk structure which one would expect to be relevant for the polycrystalline powder, at least for the interior of the powder grains. It is thus tempting to speculate about the possibility of the superconducting phase actually being located at the grain boundaries, which may have structural and/or electronic properties different from the bulk. Certainly more clarifying work needs to be done in this direction.
In summary, our combined photoemission and DFT+DMFT study finds that Kxpicene is a correlated Mott insulator for any integer doping concentration , 2 and 3. The insulating behavior of samples with macroscopic non-integer filling observed in the experiment is attributed to microscopic phase separation in line with recent Raman results. The apparent spectral weight at or even above the Fermi level experimentally observed for low doping () is attributed to a lack of thermodynamical equilibrium, resulting from weak intermolecular van der Waals interactions. The resulting discrepancy between the Mott-insulating behavior of particularly K3picene found here and the recent reports of superconducting signatures Mitsuhashi et al. (2010); Teranishi et al. (2013) calls for further investigations.
Acknowledgements.
We wish to thank N.H. Hansen and J. Pflaum (both at University of Würzburg) for their helpful technical assistance and Kristjan Haule for very useful discussions. This work was supported by the Deutsche Forschungsgemeinschaft (FOR1346) and the Helmholtz Association (HA216/EMMI).References
- Toyota et al. (2007) N. Toyota, M. Lang, and J. Müller, Low-Dimensional Molecular Metals (Springer-Verlag Berlin Heidelberg, 2007).
- Palstra et al. (1995) T. Palstra, O. Zhou, Y. Iwasa, P. Sulewski, R. Fleming, and B. Zegarski, Solid State Commun. 93, 327 (1995).
- Capone et al. (2002) M. Capone, M. Fabrizio, C. Castellani, and E. Tosatti, Science 296, 2364 (2002).
- Powell and McKenzie (2011) B. Powell and R. McKenzie, Rep. Prog. Phys. 74, 056501 (2011).
- Mitsuhashi et al. (2010) R. Mitsuhashi, Y. Suzuki, Y. Yamanari, H. Mitamura, T. Kambe, N. Ikeda, H. Okamoto, A. Fujiwara, M. Yamaji, N. Kawasaki, et al., Nature 464, 76 (2010).
- Teranishi et al. (2013) K. Teranishi, X. He, Y. Sakai, M. Izumi, H. Goto, R. Eguchi, Y. Takabayashi, T. Kambe, and Y. Kubozono, Phys. Rev. B 87, 060505(R) (2013).
- Okamoto et al. (2008) H. Okamoto, N. Kawasaki, Y. Kaji, Y. Kubozono, A. Fujiwara, and M. Yamaji, J. Am. Chem. Soc. 130, 10470 (2008).
- Wang et al. (2011) X. Wang, R. Liu, Z. Gui, Y. Xie, Y. Yan, J. Ying, X. Luo, and X. Chen, Nat. Commun. 2, 507 (2011).
- Kubozono et al. (2011) Y. Kubozono, H. Mitamura, X. Lee, X. He, Y. Yamanari, Y. Takahashi, Y. Suzuki, Y. Kaji, R. Eguchi, K. Akaike, et al., Phys. Chem. Chem. Phys. 13, 16476 (2011).
- Xue et al. (2012) M. Xue, T. Cao, D. Wang, Y. Wu, H. Yang, X. Dong, J. He, F. Li, and G. Chen, Sci. Rep. 2, 389 (2012).
- Kosugi et al. (2009) T. Kosugi, T. Miyake, S. Ishibashi, R. Arita, and H. Aoki, J. Phys. Soc. Jpn. 78, 113704 (2009).
- Roth et al. (2010) F. Roth, M. Gatti, P. Cudazzo, M. Grobosch, B. Mahns, B. Büchner, A. Rubio, and M. Knupfer, New J. Phys. 12, 103036 (2010).
- de Andres et al. (2011) P.L. de Andres, A. Guijarro, and J.A. Vergés, Phys. Rev. B 83, 245113 (2011).
- Kosugi et al. (2011) T. Kosugi, T. Miyake, S. Ishibashi, R. Arita, and H. Aoki, Phys. Rev. B 84, 214506 (2011).
- Cudazzo et al. (2011) P. Cudazzo, M. Gatti, F. Roth, B. Mahns, M. Knupfer, and A. Rubio, Phys. Rev. B 84, 155118 (2011).
- Subedi and Boeri (2011) A. Subedi and L. Boeri, Phys. Rev. B 84, 020508(R) (2011).
- Casula et al. (2011) M. Casula, M. Calandra, G. Profeta, and F. Mauri, Phys. Rev. Lett. 107, 137006 (2011).
- Kato et al. (2011) T. Kato, T. Kambe, and Y. Kubozono, Phys. Rev. Lett. 107, 077001 (2011).
- Casula et al. (2012) M. Casula, M. Calandra, and F. Mauri, Phys. Rev. B 86, 075445 (2012).
- Claessen et al. (2002) R. Claessen, M. Sing, U. Schwingenschlögl, P. Blaha, M. Dressel, and C.S. Jacobsen, Phys. Rev. Lett. 88, 096402 (2002).
- Giovannetti and Capone (2011) G. Giovannetti and M. Capone, Phys. Rev. B 83, 134508 (2011).
- Kim et al. (2011) M. Kim, B.I. Min, G. Lee, H.J. Kwon, Y.M. Rhee, and J.H. Shim, Phys. Rev. B 83, 214510 (2011).
- Okazaki et al. (2010) H. Okazaki, T. Wakita, T. Muro, Y. Kaji, X. Lee, H. Mitamura, N. Kawasaki, Y. Kubozono, Y. Yamanari, T. Kambe, et al., Phys. Rev. B 82, 195114 (2010).
- Mahns et al. (2012) B. Mahns, F. Roth, and M. Knupfer, J. Chem. Phys. 136, 134503 (2012).
- Caputo et al. (2012) M. Caputo, G. D. Santo, P. Parisse, L. Petaccia, L. Floreano, A. Verdini, M. Panighel, C. Struzzi, B. Taleatu, C. Lal, et al., J. Phys. Chem. C 116, 19902 (2012).
- De et al. (1985) A. De, R. Gosh, S. Roychowdhury, and P. Roychowdhury, Acta Cryst. C41, 907 (1985).
- Kresse and Hafner (1993) G. Kresse and J. Hafner, Phys. Rev. B 47, 558 (1993).
- Kresse and Furthmüller (1996) G. Kresse and J. Furthmüller, Phys. Rev. B 54, 11169 (1996).
- Blöchl (1994) P. E. Blöchl, Phys. Rev. B 50, 17953 (1994).
- Kresse and Joubert (1999) G. Kresse and D. Joubert, Phys. Rev. B 59, 1758 (1999).
- (31) H. Jeschke, M. Tomić, H. Lee, and R. Valentí, in preparation.
- Xin et al. (2012) Q. Xin, S. Duhm, F. Bussolotti, K. Akaike, Y. Kubozono, H. Aoki, T. Kosugi, S. Kera, and N. Ueno, Phys. Rev. Lett. 108, 226401 (2012).
- Ramsey et al. (1994) M. Ramsey, M. Schatzmayr, S. Stafström, and F. Netzer, Europhys. Lett. 28, 85 (1994).
- Koch et al. (2003) N. Koch, C. Chan, A. Kahn, and J. Schwartz, Phys. Rev. B 67, 195330 (2003).
- Merkel et al. (1993) M. Merkel, M. Knupfer, M.S. Golden, J. Fink, R. Seemann, and R.L. Johnson, Phys. Rev. B 47, 11470 (1993).
- (36) A. Ruff, to be published.
- Schrupp et al. (2005) D. Schrupp, M. Sing, M. Tsunekawa, H. Fujiwara, S. Kasai, A. Sekiyama, S. Suga, T. Muro, V. Brabers, and R. Claessen, Europhys. Lett. 70(6), 789 (2005).
- Alexandrov and Ranninger (1992) A.S. Alexandrov and J. Ranninger, Phys. Rev. B 45, 13109 (1992).
- Nomura et al. (2012) Y. Nomura, K. Nakamura, and R. Arita, Phys. Rev. B 85, 155452 (2012).
- Sangiovanni et al. (2005) G. Sangiovanni, M. Capone, C. Castellani, and M. Grilli, Phys. Rev. Lett. 94, 026401 (2005).
- Imada et al. (1998) M. Imada, A. Fujimori, and Y. Tokura, Rev. od. Phys. 70, 1039 (1998).
- Kambe et al. (2012) T. Kambe, X. He, Y. Takahashi, Y. Yamanari, K. Teranishi, H. Mitamura, S. Shibasaki, K. Tomita, R. Eguchi, H. Goto, et al., Phys. Rev. B 86, 214507 (2012).
- Fuentes and Knupfer (2006) G. G. Fuentes and M. Knupfer, Appl. Phys. A 84, 329 (2006), and references therein.
- Poirier (1994) D. Poirier, Appl. Phys. Lett. 64, 1356 (1994).
I Supplemental Material
I.1 Structural characterization
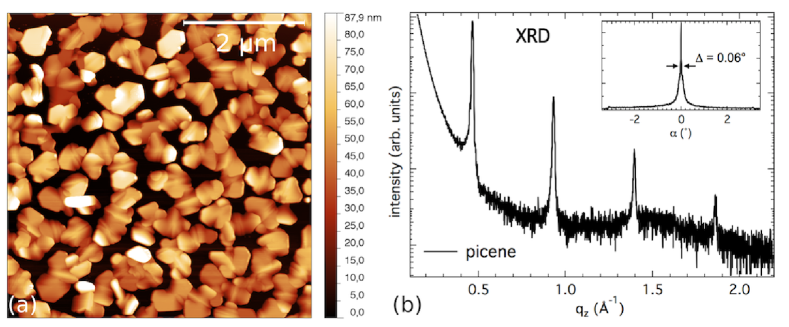
The typical average thickness of the in vacuo grown picene films as monitored by a quartz crystal microbalance (QCM) was 30 nm. The actual film topography as measured by atomic force microscopy (AFM) shows that the film consists of picene islands with typical lateral dimensions of several 100 nm and heights of up to 80 nm (Fig. S1 (a)). Such 3D island growth mode is expected on an inert substrate (here: chemically cleaned and oxidized Si(100)). While the individual islands are crystalline, the overall film appears azimuthally disordered with well-developed texture along the c-axis, i.e., perpendicular to the surface, as inferred from the sharp Bragg peaks in the x-ray diffractogram (XRD) in Fig. S1 (b). The resulting c-axis parameter of 13.51Å confirms that the molecules grow in a standing mode.
I.2 Doping concentration
The atomic K concentration of the doped picene films (Kxpicene) has been determined from the intensity ratio of the C 1s and K 2p photoemission core level spectra, taking into account the relative photoionization cross sections. The latter is essentially an atomic property and has experimentally been calibrated by independent photoemission measurements of K-intercalated fullerenes (K3C60), which is an easily reproducible compound of well-defined stoichiometry. Note that the relative cross-section ratio thus determined is about 30 % smaller than the value obtained from the theoretical cross-sections of Yeh and Lindau Yeh and Lindau (1985). This implies that previous photoemission studies which use the calculated values overestimate the K concentration by the same amount.
I.3 Non-equilibrium effects
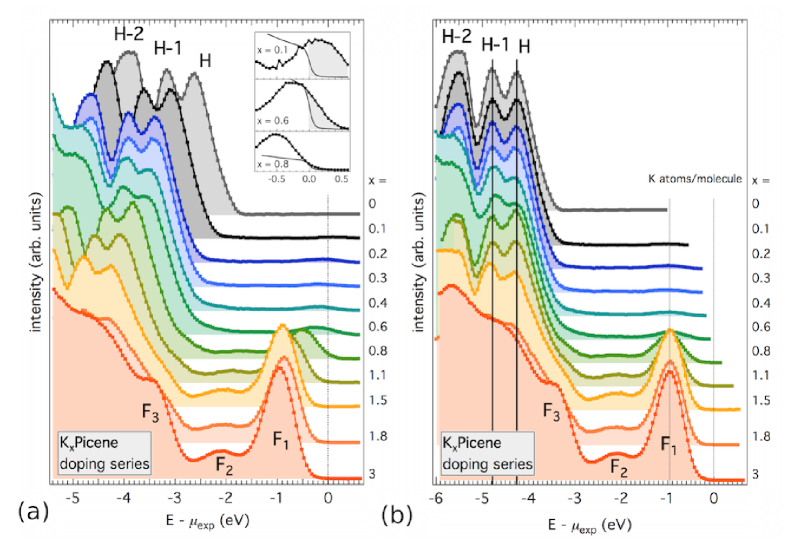
Figure S2(a) shows a series of valence band spectra as measured for a full range of K concentrations from to 3. The main effect at low doping () is a shift of the overall spectrum away from the experimental Fermi energy (which corresponds to the kinetic photoelectron energy where a metal in electrical contact with the sample would display its Fermi edge) and the appearance of a small peak (F1) in the former band gap. Closer inspection reveals that most of its spectral weight is actually located well above the Fermi energy for and only gradually moves below with larger doping, until the peak finally converges to a constant binding energy for , resulting in a gapped spectrum. This anomalous behavior clearly signals a non-equilibrium situation where a homogeneous chemical potential cannot be defined in the film-substrate system in the early doping stages. A possible explanation by a surface photovoltage (SPV), often encountered in metal-semiconductor contacts, can be ruled out, because we do not observe the characteristic temperature and intensity dependence of the SPV Alonso et al. (1990); Hecht (1990); Horn et al. (1992); Moreno et al. (2000).
A detailed analysis of identical behavior in another alkali metal-doped organic semiconductor (para-sexiphenyl) has demonstrated that it can be traced back to the inability of a purely van der Waals-coupled molecular system to establish an equilibrium chemical potential throughout the film Koch et al. (2003). In such a situation the energy alignment refers rather to the vacuum level and thus depends on work functions. Charge fluctuations induced by alkali-metal doping will restore thermodynamical equilibrium. Note however, that our potassium deposition method leads to a concentration gradient which decays from the surface into the film. Low K dosage then leads to a doped Kxpicene surface layer with little or even no K present deeper in the film, maintaining the non-equilibrium situation described above. For higher concentrations the film will become doped throughout, hence restoring a well-defined chemical potential. The observed effect should be less pronounced for thinner films, as is indeed the case for the photoemission results of Mahns et al. Mahns et al. (2012).
We thus take our data as an intrinsic equilibrium spectrum and have energetically realigned all other spectra at its spectral features in Fig. S2(b), showing gapped behavior for all concentrations.. The observation of spectral weight near the Fermi level reported by Okazaki et al. Okazaki et al. (2010) for a nominal doping of is attributed to the non-equilibrium behavior of peak F1, which also explains why a clear Fermi edge could not be identified in that study.
II Structure prediction
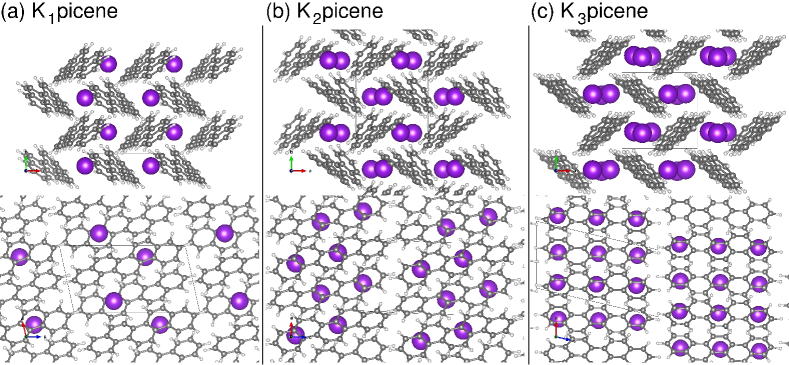
The relaxation of Kxpicene candidate structures was performed using Fast Inertial Relaxation Engine (FIRE) algorithm Bitzek et al. (2006), employing Vienna Ab-initio Simulations Package (VASP) Kresse and Hafner (1993); Kresse and Furthmüller (1996) with the Projector Augmented Wave basis (PAW) Blöchl (1994); Kresse and Joubert (1999) in the Generalized Gradient Approximation (GGA) as a force and stress tensor calculator with plane-wave cutoff of 400 eV and Brillouin zone sampled by Monkhorst-Pack -point mesh of -points. Structures were relaxed until the maximal force acting on ions and maximal stress tensor component fell bellow 0.01 eV/A and 0.01 GPa, respectively. Fig. S3 shows the structures we obtained. We have compared our structures to theoretically obtained lattice parameters published in Ref. Kosugi et al., 2011. Obtained equilibrium volumes agree with our results within 2% in all cases, but there are some discrepancies in lattice parameters and angles. Without detailed knowledge of the structures in Ref. Kosugi et al., 2011 it is not possible to say anything further on the degree of agreement.
III Details of dynamical mean field theory calculations
We align Fermi levels of DFT spectra with active bands removed and DMFT spectral functions at . While the DFT Fermi level is known for K1picene and K3picene, as they are metallic, and for K2picene with an error bar given by the tiny energy gap of 60 meV, the DMFT chemical potential follows from the demand that the filling is unchanged compared to the DFT calculation.
References
- Yeh and Lindau (1985) J. J. Yeh and I. Lindau, Atom. Data Nucl. Data 32, 1 (1985).
- Alonso et al. (1990) M. Alonso, R. Cimino, and K. Horn, Phys. Rev. Lett. 64, 1947 (1990).
- Hecht (1990) M. H. Hecht, Phys. Rev. B (R) 41, 7918 (1990).
- Horn et al. (1992) K. Horn, M. Alonso, and R. Cimino, Appl. Surf. Sci. 56-58, 271 (1992).
- Moreno et al. (2000) M. Moreno, M. Alonso, M. H. ricke, R. Hey, K. Horn, J. S. n, and K. Ploog, J. Vac. Sci. Technol. B 18(4), 2128 (2000).
- Koch et al. (2003) N. Koch, C. Chan, A. Kahn, and J. Schwartz, Phys. Rev. B 67, 195330 (2003).
- Mahns et al. (2012) B. Mahns, F. Roth, and M. Knupfer, J. Chem. Phys. 136, 134503 (2012).
- Okazaki et al. (2010) H. Okazaki, T. Wakita, T. Muro, Y. Kaji, X. Lee, H. Mitamura, N. Kawasaki, Y. Kubozono, Y. Yamanari, T. Kambe, et al., Phys. Rev. B 82, 195114 (2010).
- Bitzek et al. (2006) E. Bitzek, P. Koskinen, F. Gähler, M. Moseler, and P. Gumbsch, Phys. Rev. Lett. 97, 170201 (2006).
- Kresse and Hafner (1993) G. Kresse and J. Hafner, Phys. Rev. B 47, 558 (1993).
- Kresse and Furthmüller (1996) G. Kresse and J. Furthmüller, Phys. Rev. B 54, 11169 (1996).
- Blöchl (1994) P. E. Blöchl, Phys. Rev. B 50, 17953 (1994).
- Kresse and Joubert (1999) G. Kresse and D. Joubert, Phys. Rev. B 59, 1758 (1999).
- Kosugi et al. (2011) T. Kosugi, T. Miyake, S. Ishibashi, R. Arita, and H. Aoki, Phys. Rev. B 84, 214506 (2011).