Exciton-magnon transitions in the frustrated chromium antiferromagnets CuCrO2, -CaCr2O4, CdCr2O4, and ZnCr2O4
Abstract
We report on optical transmission spectroscopy of the Cr-based frustrated triangular antiferromagnets CuCrO2 and -CaCr2O4, and the spinels CdCr2O4 and ZnCr2O4 in the near-infrared to visible-light frequency range. We explore the possibility to search for spin correlations far above the magnetic ordering temperature and for anomalies in the magnon lifetime in the magnetically ordered state by probing exciton-magnon sidebands of the spin-forbidden crystal-field transitions of the Cr3+ ions (spin = 3/2). In CuCrO2 and -CaCr2O4 the appearance of fine structures below is assigned to magnon sidebands by comparison with neutron scattering results. The temperature dependence of the line width of the most intense sidebands in both compounds can be described by an Arrhenius law. For CuCrO2 the sideband associated with the 4A2 T2 transition can be observed even above . Its line width does not show a kink at the magnetic ordering temperature and can alternatively be described by a vortex scenario proposed previously for similar materials. The exciton-magnon features in -CaCr2O4 are more complex due to the orthorhombic distortion. While for CdCr2O4 magnon sidebands are identified below and one sideband excitation is found to persist across the magnetic ordering transition, only a weak fine structure related to magnetic ordering has been observed in ZnCr2O4 .
pacs:
75.30.Ds, 71.70.Ch, 78.30.-j, 78.40.-qI Introduction
An archetype of a geometrically frustrated spin arrangement are antiferromagnetically coupled Ising spins residing on the corners of a triangular lattice. In three dimensions the pyrochlore lattice which can be regarded as a network of corner-sharing tetrahedra is one of the most studied structures to explore the realm of frustration phenomena in magnetism.
These geometrically frustrated lattices may provide evidence for exotic ground states such as spin ice, spin liquids, or spin gels. The latter has been described as a topologically ordered state with finite but extended spin correlations and was proposed to be realized in systems with antiferromagnetically coupled Heisenberg spins on a two-dimensional (2D) triangular lattice.Kawamura et al. (2010) In this case the nearest-neighbor bilinear interaction yields a long-range ordered magnetic state at K, where neighboring spins order at an angle of 120∘ to each other.Bernu et al. (1994) Moreover, the model exhibits a topologically stable defect described in terms of a Z2 vortex Kawamura and Miyashita (1984).
A well-known class of triangular antiferromagnets is given by systems with chemical formula CrO2 with = Cu, Ag, Pd, Li, Na. Depending on the stacking sequence these compounds have either delafossite structure (e.g. Cu/PdCrO2) or an ordered rock salt type structure (e.g. Li/NaCrO2). These systems have attracted enormous interest because of a large variety of magnetic and electronic phenomena and the occurrence of multiferroicity. For example, CuCrO2 and AgCrO2 reportedly exhibit spin-driven ferroelectricity Seki et al. (2008) and the spin correlations in both rock salt- and delafossite-type CrO2 have been associated with the formation of Z2 vortices Ajiro et al. (1988); Olariu et al. (2006); Hsieh et al. (2008a, b); Hemmida et al. (2009, 2011).
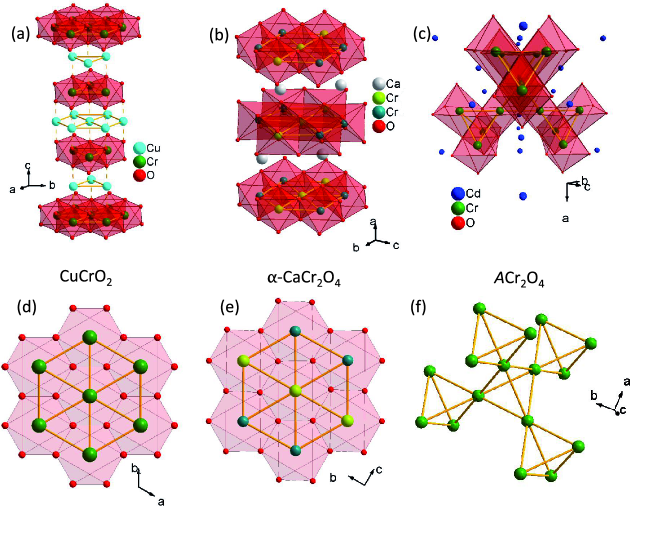
Optical studies have been reported in the rocksalt-type systems NaCrO2 and LiCrO2 Elliston et al. (1975); Kojima et al. (1993). These systems exhibit exciton-magnon transitionsTanabe et al. (1965) in the energy region of the spin-forbidden 4A2 T2 crystal-field excitation of the Cr3+ ions. Kojima et al. proposed that the lifetime of the exciton-magnon lines in triangular lattice antiferromagnets is directly related to the density of Z2 vortices in the system.Kojima et al. (1993) In this work we investigated the delafossite-type system CuCrO2 by optical spectroscopy. CuCrO2 crystallizes in space group Kadowaki et al. (1990) where layers of the magnetic chromium ions (3, ) are separated by one copper and two oxygen layers [see Fig. 1(a) and (d)]. Due to this distance the system is moderately frustrated with a Curie-Weiss-temperature of K and an antiferromagnetic ordering below = 24.2 K. The magnetic transition leads to a slight distortion of the CrO6 octahedraPoienar et al. (2009); Kimura et al. (2009) and an incommensurate proper screw magnetic structure.Soda et al. (2009) Specific heat measurements showed that there are actually two successive phase transitions at = 23.6 K and = 24.2 K.Kimura et al. (2008) At a two-dimensional antiferromagnetic ordering was proposed and only below three-dimensional magnetic ordering and the occurrence of multiferroicity sets in.Frontzek et al. (2011) In the following we will use K because our measurements do not allow to distinguish these two transitions.
Moreover, we investigated the triangular-lattice antiferromagnet -CaCr2O4, which has an orthorhombically distorted delafossite structure (space group ) Pausch and Müllerbuschbaum (1974), where the Cr3+ ions occupy two crystallographically inequivalent positions [see Fig. 1(b) and (e)]. With a Curie-Weiss temperature of K and a Néel temperature of = 42.6 K the system is clearly geometrically frustrated and exhibits a planar 120∘-spin structure in the crystallographic -plane.Chapon et al. (2011); Toth et al. (2011) Recent studies report multiferroicity (also in -Cr2O4, = Sr, Ba)Singh et al. (2011); Zhao et al. (2012) and low-lying magnetic modes with a roton-like dispersion in -CaCr2O4.Toth et al. (2012) The related compound -SrCr2O4 reportedly exhibits similar magnetic properties but is less distorted than -CaCr2O4.Dutton et al. (2011)
The spinel systems CdCr2O4 and ZnCr2O4 with a pyrochlore lattice of magnetic Cr3+ ions [see Fig. 1(c) and (f)] are considered as model systems to study the effects of geometric frustration of Heisenberg spins on the pyrochlore lattice. Further-neighbor exchange interactions Chern et al. (2008) and magneto-elastic coupling lead to magneto-structural transitions Yamashita and Ueda (2000); Tchernyshyov et al. (2002); Sushkov et al. (2005); Fennie and Rabe (2006); Aguilar et al. (2008); Rudolf et al. (2009); Kant et al. (2009, 2012)at Néel temperatures of 12.5 K and 7.8 K for ZnCr2O4 and CdCr2O4, respectively Rovers et al. (2002); Lee et al. (2000), while the respective Curie-Weiss temperatures are K and K.Rudolf et al. (2007); Sushkov et al. (2005) The observation of magnetic excitations by neutron scattering which can be modelled by structure factors corresponding to a partition of the pyrochlore lattice into hexagonal loops or even heptamersLee et al. (2002); Chung et al. (2005a); Tomiyasu et al. (2004) has contributed considerably to this paradigmatic status. A low-temperature optical absorption spectrum of ZnCr2O4 has been reported by Szymczak et alSzymczak et al. (1980)., where an exotic multiplet-sideband assigned to exciton-magnon-phonon processes has been observed. A clear suppression of this sideband has recently been reported in ultra-high magnetic fields up to 600 T.Miyata et al. (2011)
In this study we will focus on the exciton-magnon transitions related to spin-forbidden CF excitations of the Cr3+ ions with spin = 3/2, which are in an octahedral environment in all considered compounds.
II Experimental details and sample characterizations
Single crystals of CuCrO2 were prepared by a flux-decomposition method using K2Cr2O7 flux and CuO. The soaking temperature was 1150∘C, the soaking time 20 h and the cooling rate 2∘C/h. Plate-like single-crystalline samples with dimension up to mm3 were prepared. The grown single crystals were checked by x-ray diffraction and no impurity phases could be detected. The magnetic susceptibility of our samples (not shown) is in good agreement with literature Kimura et al. (2008); Okuda et al. (2005). A Curie-Weiss fit to the data between 200 and 400 K results in a Curie-Weiss temperature of 178 K, slightly lower than the values measured by Kimura et alKimura et al. (2008). (211 K out of plane, 203 K in plane) from samples grown from Bi2O3 flux. The propagation direction of the incident light was parallel to the crystallographic -axis.
Single crystals of -CaCr2O4 were grown in a high temperature floating zone furnace as described elsewhere Islam et al. . The cleaved platelet is about 100 microns thick with a diameter of 3 mm. The propagation direction of the incident light was parallel to the crystallographic -axis.
High-quality platelike single crystals of CdCr2O4 and ZnCr2O4 were prepared as described in Ref. [Kant et al., 2010a] and polished to optical quality. The propagation direction of the incident light was parallel to the [111]-direction.
The optical transmission was measured using a Bruker IFS 66v/S Fourier-transform spectrometer, which was equipped with a He-bath and a He-flow cryostat, in the frequency range 8500 - 25000 cm-1 and for temperatures from 5 - 500 K.
III Experimental Results and Discussion
III.1 Crystal-field splitting of Cr3+
| -CaCr2O4 | CuCrO2 | CdCr2O4 | ZnCr2O4 | |
|---|---|---|---|---|
| Mode 1 | 13317.7 | 14053.0 | 14096.0 | 13946.7 |
| Mode 1* | 14178.3 | |||
| Mode 2 | 13530.6 | 14286.4 | 14358.1 | 14099.5 |
| Mode 3 | 13969.0 | 14593.3 | 14559.3 | 14702.1 |
| Mode 4 | 14663.4 | 14916.5 | 14819.8 | 15126.7 |
| Mode 5 | 15179.4 | 15268.9 | 15309.7 | 15549.2 |
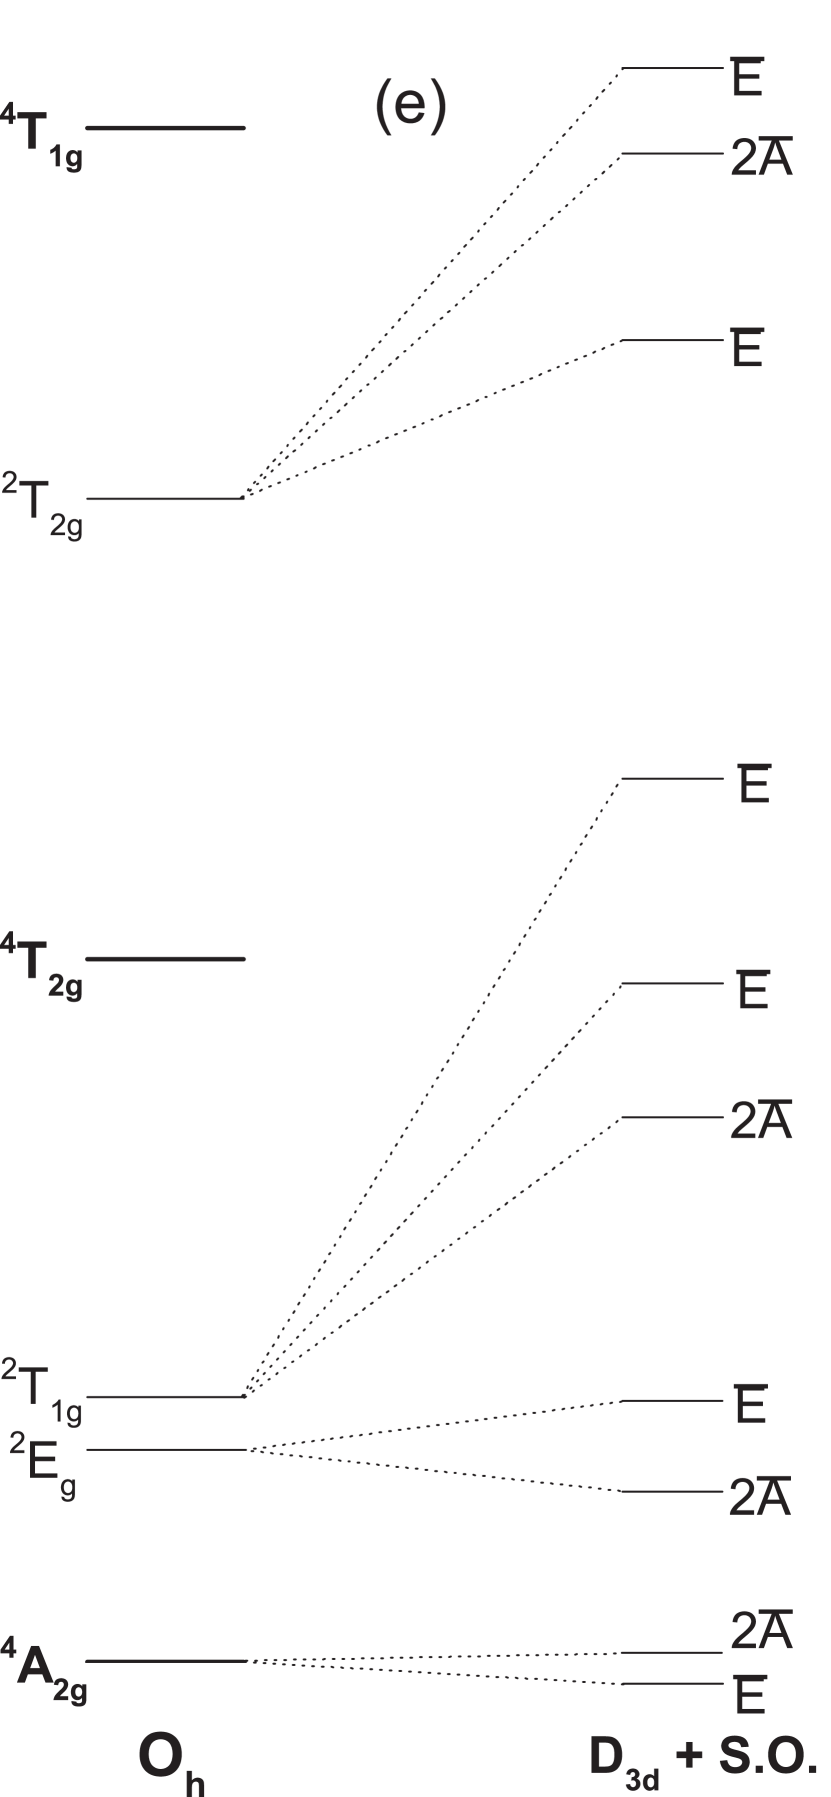
In all systems investigated here the magnetic ions are Cr3+ ions with 3 electronic configuration (spin ) surrounded by an octahedron of oxygen ions. In a perfect Oh symmetry, this would result in the usual splitting according to the Tanabe-Sugano diagram for ionsSugano et al. (1970) [see scheme in Fig. 2(e)]. However, the symmetry for our compounds is rather trigonal D3d, which leads to a splitting of the excitations. Due to spin-orbit coupling we get a further splitting. Wood et alWood et al. (1968). investigated the crystal field excitations in ZnAl2O4 and MgAl2O4 doped with Cr ions both theoretically and experimentally. The Cr ions in these spinels are in a similar environment as in our case and the mode splits by a few wave numbers while the modes are split into three levels separated by a few 100. For ZnGa2O4 doped with Cr the splitting of the multiplet increases to 40 Kahan and Macfarlane (1971), showing the sensitivity to the local symmetry. The scheme of excitations including the low symmetry and spin-orbit splitting of the spin-forbidden modes is shown in Fig. 2(e).
The parity selection rule which forbids transitions between the multiplet states in cubic symmetry can be released by a static low-symmetry crystal field with odd-parity or a corresponding odd lattice vibration inducing a low-symmetry field. As a result even-parity states will be mixed with odd-parity contributions and nonvanishing matrix elements of the electric dipole moment will occur. No such matrix elements for transitions to multiplet states with different spin multiplicities (spin-forbidden crystal field transitions) exist, but this spin-selection rule () can be released by spin-orbit coupling.Sugano et al. (1970)
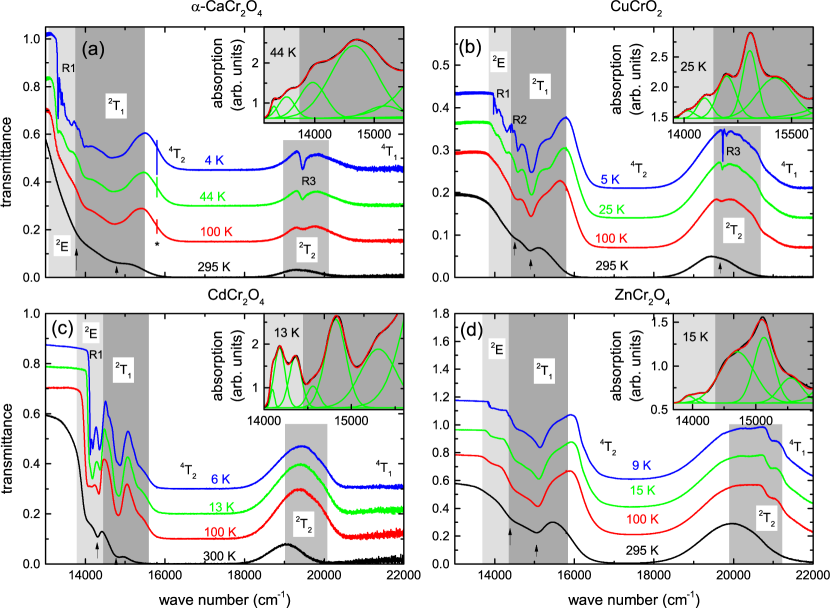
The NIR transmission spectra for all materials are shown in Fig. 2. The overall features are typical for Cr3+ ions in an octahedral crystal field like, for example, in rubyWood et al. (1963). One can see two strong spin-allowed crystal-field absorptions in all compounds at about 17000 cm-1 and about 22000 cm-1 corresponding to and transitions, respectively, where one electron is excited from the to the levels. These energies correspond to a cubic crystal field splitting 10 17000 cm-1 and a Racah parameter 465 cm-1. A splitting of the spin-allowed transitions due a crystal field lower than cubic or spin-orbit coupling can not be resolved.
The focus here is on the spin-forbidden transitions which are much weaker than the spin-allowed transitions. In cubic symmetry the spin-forbidden excitations , and are expected and already at room temperature weaker modes (indicated by arrows in Fig. 2) are visible. Towards lower temperature these absorption features become narrower and more pronounced and just above the magnetic ordering five distinct absorptions are identified in the region of the , (see insets of Fig. 2). This number is in accordance with the five modes expected in this region for D3d symmetry [Fig. 2(e)]. The energies of the excitations are obtained by a fit and can be read off in Table 1. Even for the lower symmetry of -CaCr2O4 the fit works well with 5 Gaussians in this region. In the case of CdCr2O4 an additional Gaussian was used to account for the shoulder at the low-energy flank of the absorption region resulting in modes 1 and 1∗.
III.2 Exciton-magnon transitions
Let us now take a closer look at the spin-forbidden crystal field transitions within the states, in particular the and the transitions. In the transmission spectra very sharp excitonic absorption features accompanying these transitions are already visible in Fig. 2 [e.g. the ones labelled R1, R2, and R3 in Fig. 2(b)] at lowest temperatures. As proposed by Tanabe, Moriya, and Sugano such sidebands can occur when two ions on sites and are coupled antiferromagnetically and the electric-dipole moment of the incoming light couples an excited multiplet state of the ion at site to the ground multiplet state of the ion at .Tanabe et al. (1965) In this so-called electric-dipole induced exciton-magnon process with a total spin change , the spin-forbidden multiplet transitions can exhibit cold and hot magnon sidebands on the high- and low-energy side of the so-called zero-magnon line, corresponding to the annihihilation and creation of a magnon, respectivelyGondaira and Tanabe (1966); Tanabe and Gondaira (1967); Shinagawa and Tanabe (1971); Fujiwara et al. (1972); Eremenko et al. (1986). The zero-magnon line identifies the purely excitonic crystal-field transition. Electric-dipole active magnon sidebands involving spin-forbidden crystal-field levels have been reported for several antiferromagnets such as, for example, MnF2,Greene et al. (1965); Sell et al. (1967) VBr2,Kojima et al. (1993) and LiCrO2,Kojima et al. (1993) and are usually stronger than the magnetic-dipole active zero-magnon lines.
In case of spin-allowed crystal-field transitions, magnetic-dipole active magnon sidebands have been observed (e.g. in FeF2 and KCuF3),Tylicki and Yen (1968); Deisenhofer et al. (2008) which can be of similar strength as the electric-dipole active sidebands of spin-forbidden crystal-field transition and are not restricted to antiferromagnets.Moriya and Inoue (1968); Fujiwara and Tanabe (1975) In contrast to the electric-dipole mechanism of spin-forbidden transitions, the zero-magnon line is expected to be stronger than the sidebands for the spin-allowed crystal-field transitions.Moriya and Inoue (1968)
The energy of exciton-magnon sidebands with respect to the zero-magnon line should correspond to the magnon energy in regions of the Brillouin zone, where the dispersion is flat, i.e., where the magnon density of states peaks. The effective electric-dipole moment of an exciton-magnon transition and the magnon sidebands appearing for a particular excitonic transition depends strongly on the symmetry of the excited orbital state and the dispersion of the exciton.Sell (1968); Moriya and Inoue (1968) As a result different magnons might couple to the different excited multiplet states. Thus, optical spectroscopy can provide information on the magnon energies in regions of the Brillouin zone which might be hard to access otherwise. Since short-range correlations are sufficient to make these transitions allowed, the persistence of non-trivial spin correlations in the classical spin-liquid phase of frustrated magnets may be tracked by optical spectroscopy. In the following we will discuss the observed exciton-magnon transitions separately for each of the investigated compounds.
III.2.1 CuCrO2
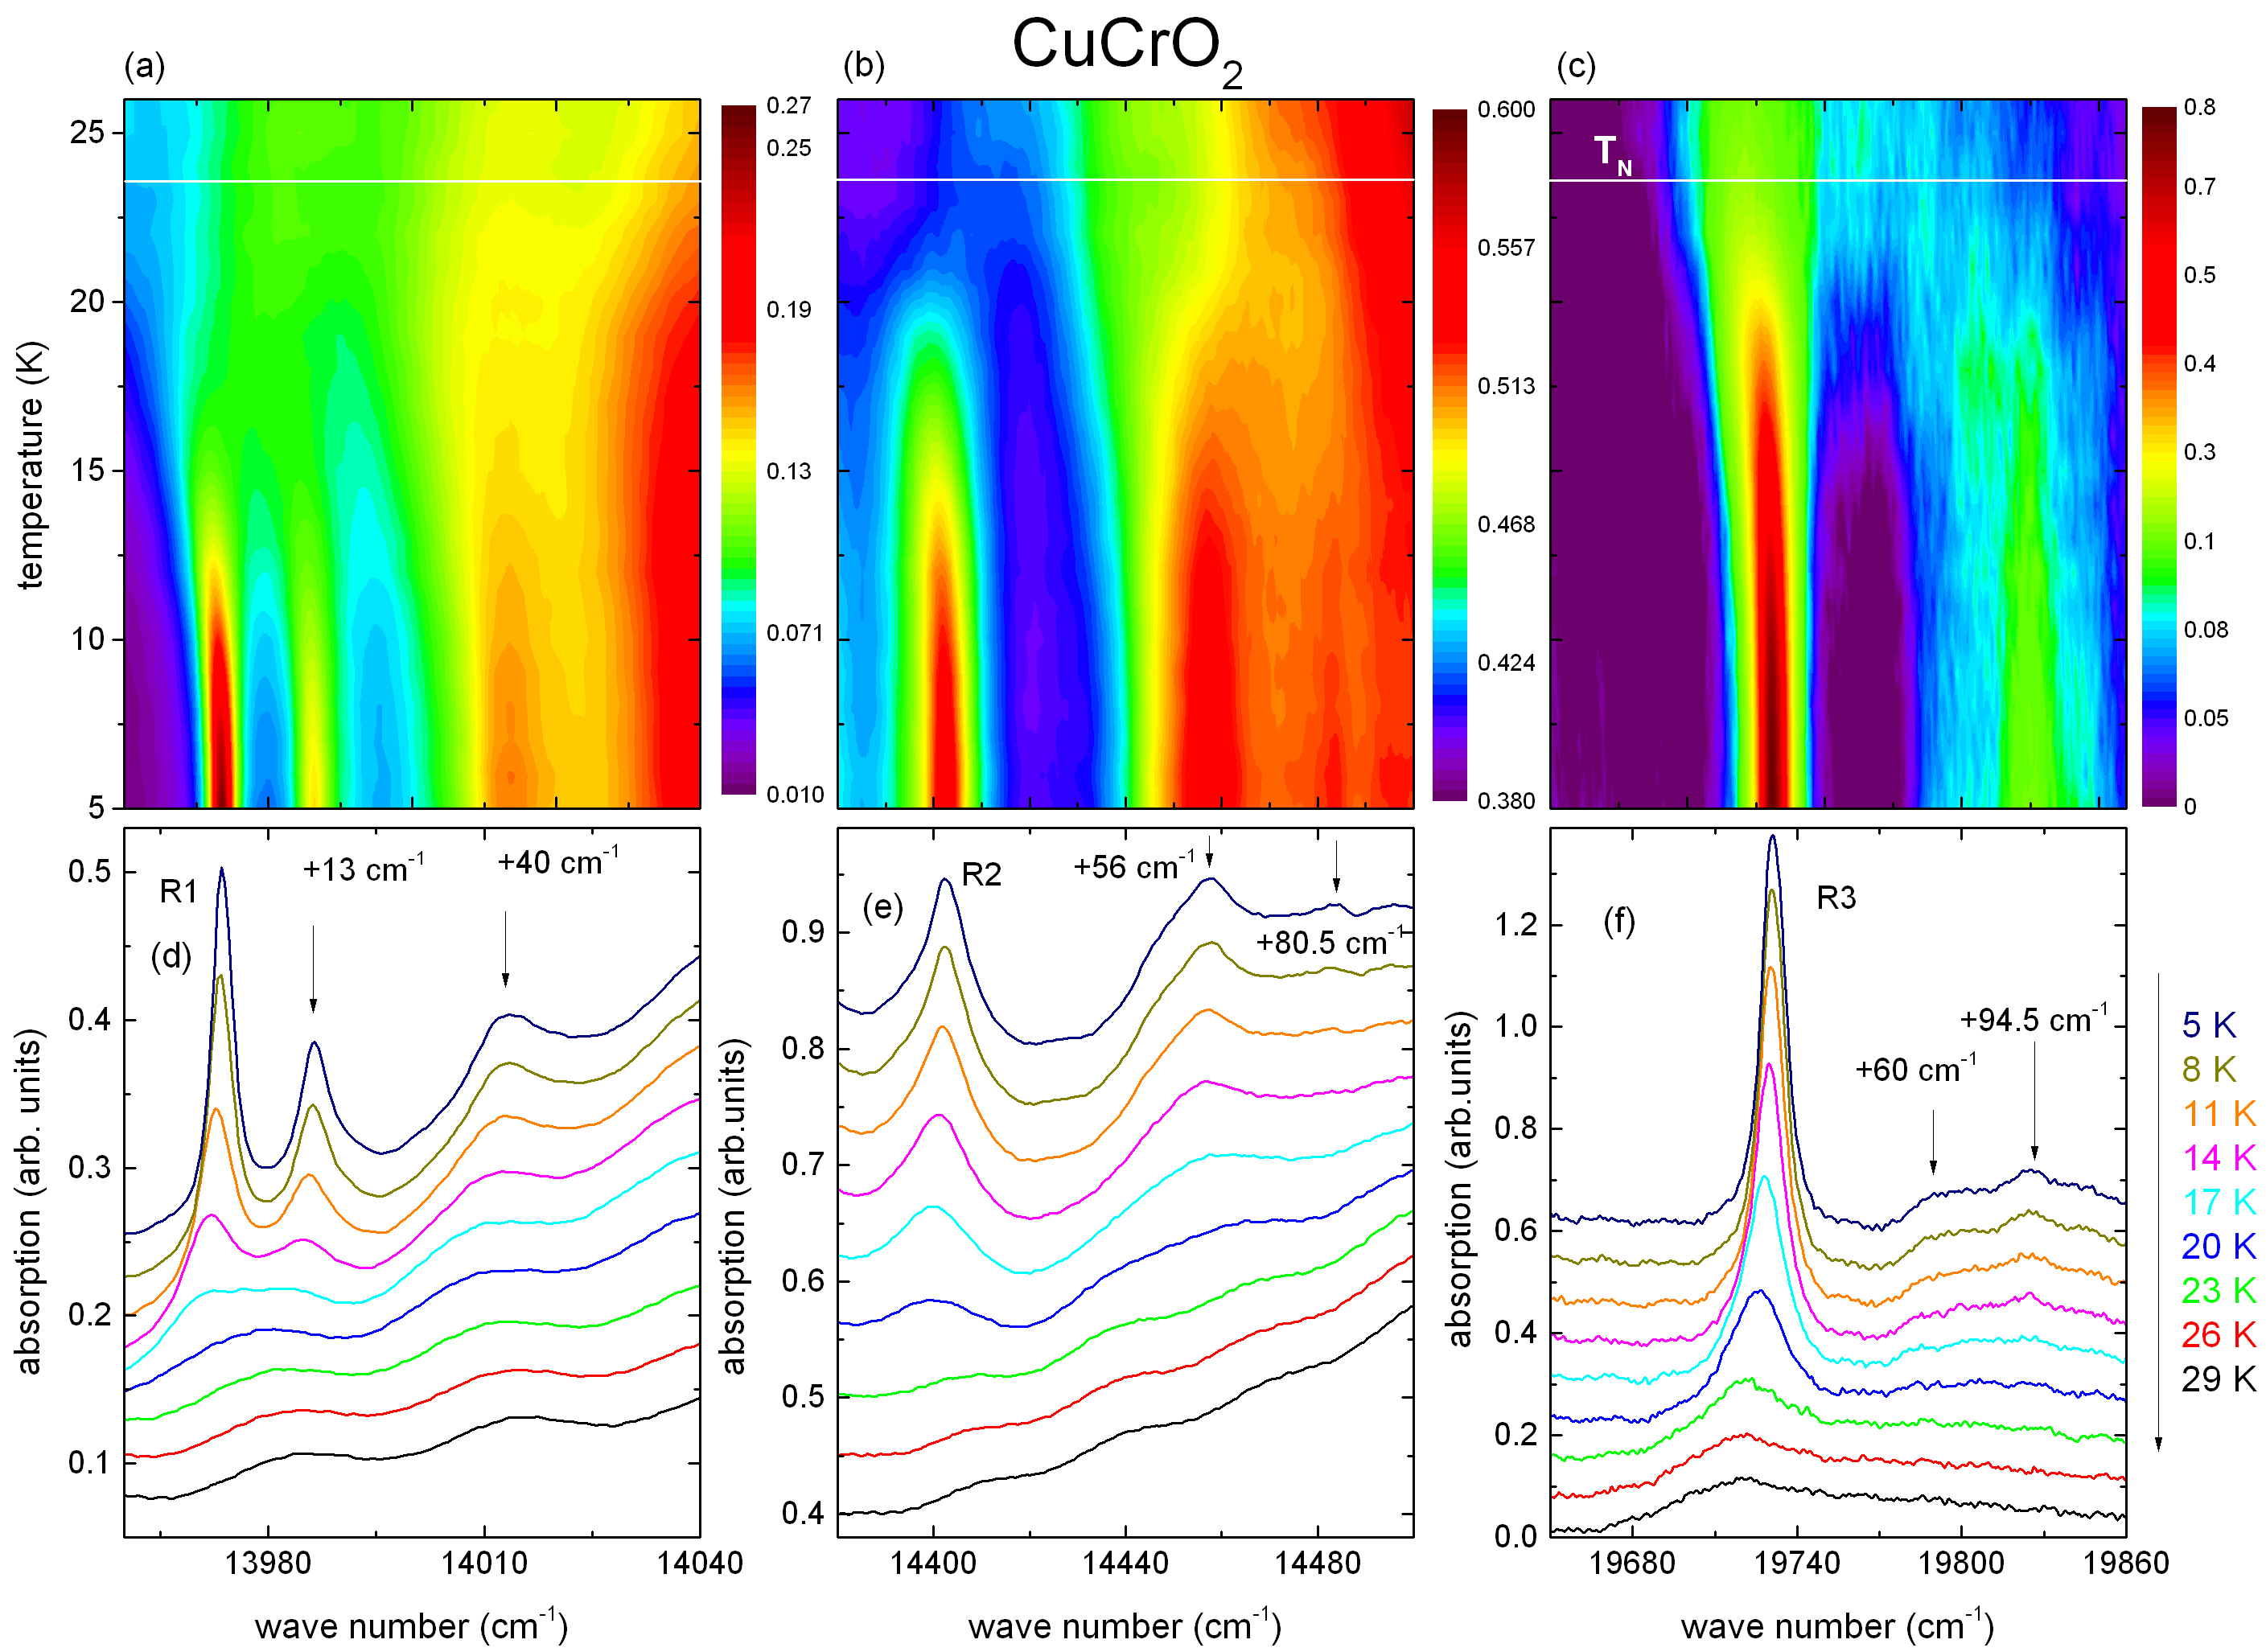
In the magnetically ordered state pronounced fine structures, named R1, R2, and R3 below, appear at the onset of the , , and excitations below the magnetic ordering temperature Kimura et al. (2008) [see Fig. 3(a)-(f)]. In the following we will restrict the discussion on these fine structures and their temperature dependence which is summarized in Fig. 3.
Zooming into the region of the fine structure close to the excitation R1 [Fig. 3(a) and (d)] three absorption features can be clearly seen at low temperatures. Given the spin-forbidden nature of the underlying crystal-field transition (see discussion above) the most intense peak R1 should correspond to an electric-dipole active one-magnon sideband, but no corresponding weak zero-magnon feature can be observed to directly read off the magnon energy. Consequently, the identification of the two further sidebands with an energy difference of +13 and +40 cm-1 with respect to R1 is similarly difficult.
Recent high-field electron-spin resonance studies reported two antiferromagnetic-resonance (AFMR) modes with gaps of = 1.0 cm-1 (0.12 meV) and = 11 cm-1 (1.4 meV)Yamaguchi et al. (2010). While the smaller gap has been observed also in neutron scattering studies Poienar et al. (2010); Kajimoto et al. (2010); Frontzek et al. (2011), the larger gap has no correspondence in the investigated range of momentum transfer and energy probed in the neutron experiments. However, the energy difference of +13 of the magnon sideband from R1 is close in energy to the reported gap and the difference of 2 could be due to the fact that ESR and exciton-magnon-transition probe spin-wave energies at different points in the Brillouin zone. The small gap of only +1 observed by the ESR experiment and inelastic neutron scattering results in an assignment of the most intense absorption R1 to an exciton-one-magnon sideband at a distance of 1 to the zero-magnon line. That means the magnetic-dipole active line is assumed to be masked by R1. Then the absorption at +13 (1.6 meV) corresponds to an exciton-one-magnon sideband involving the larger reported gap and the sideband energy at about +40 cm-1 (5 meV) is in agreement with reported magnon bands around = 5 meV with a bandwidth of about 1 meV in the vicinity of the zone boundary.Poienar et al. (2010); Frontzek et al. (2011)
Analogously, the fine structure related to R2 also exhibits two further absorptions, one peaked at a distance of +56 cm-1 from R2 with an additional shoulder at the low-energy flank and another weaker feature at a distance of +80.5 cm-1 [Fig. 3(b) and (e)]. Again, no zero-magnon feature is discernible, but a direct correspondence to further magnon bands with maxima at about 60 cm-1 (7.5 meV) and 80 cm-1 (10 meV)Frontzek et al. (2011) can be established by assigning R2 as an exciton-one-magnon sideband at +1 of the masked zero-magnon line and the other absorptions to the magnon branches reported by neutron scattering.
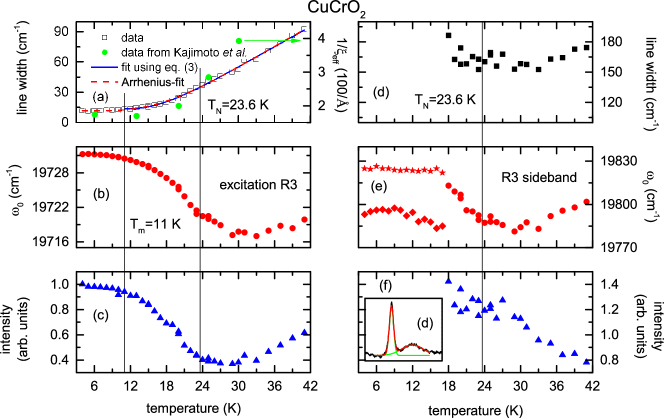
In the case of the strong excitation R3 at 19730 cm-1 shown in Fig. 3(f) the absorption spectrum exhibits a broad sideband feature at a distance of +94.5 cm-1 from R3, but again no zero-magnon line. Following the same line as above, R3 can be regarded as an exciton-one-magnon sideband corresponding to the small gap of about 1. The assignment of the broad additional sideband is not evident, but it might correspond to an exciton-three-magnon sideband at 93. Below 18 K the broad sideband becomes distorted and shows an additional shoulder at about +60 corresponding to the above mentioned magnon features observed by neutron scatteringFrontzek et al. (2011) as in the case of the sideband of R2. This suggests that the sideband is a superposition of two exciton-magnon features.
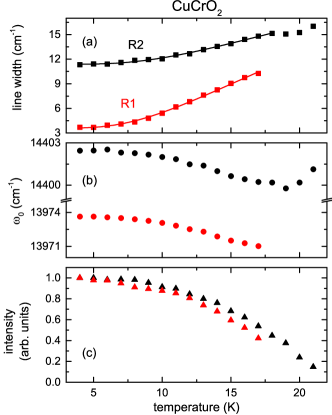
The excitation R3 exhibits a somewhat different temperature dependence than R1 and R2, because it can be observed up to 45 K (about twice ) as a strongly broadened feature in the absorption, while R1 and R2 can not be tracked above . To analyze the temperature dependence of R1 and R2 we fitted the two lines with Gaussians after subtracting the background due to the spin-forbidden excitations by a polynomial fit to the data outside of the exciton range. The temperature dependence of the fit parameters of R1 and R2 are shown in Fig. 4. Both, the position of the absorption maximum [Fig. 4(b)] and the intensity [Fig. 4(c)] of the excitations R1 and R2 increase continuously towards lower temperatures reflecting the behavior of the sublattice magnetization in the magnetically ordered state. The line width (full width half maximum) of R1 nearly triples on rising temperature just before it vanishes, while R2 shows a less pronounced broadening. Fits of the temperature dependencies of the line width of R1 and R2 by an Arrhenius law
| (1) |
yield the fit parameters = 31(1) K, = 43(3), = 3.6(1) for R1 and = 36(2) K, = 28(3), = 11.4(1) for R2.
To analyze R3 we also fitted this range with two Gaussian lines for R3 and the broad sideband feature [see Fig. 5(g)]. The temperature dependence of the fit parameters are shown in Fig. 5. Due to the distortion of the broad sideband below 18 K we only show the fitparameters for R3 in the whole temperature range, while we added the positions of the shoulder and the peak of the sideband to the eigenfrequency below 18 K. The magnetic ordering temperature shows up in the eigenfrequency of R3 [Fig. 5(b)] as a kink, below which it increases to lower temperatures, reflecting the increase of an internal magnetic field. A similar behavior is observed for the intensity [Fig. 5(c)], but its line width [Fig. 5(a)] seems not to be influenced by the magnetic ordering at . The fit parameters of the broad sideband, which probably corresponds to a superposition of two sidebands, do not exhibit distinct anomalies at .
Previous investigations of the line width of the R3 absorption band in the related triangular lattice antiferromagnets LiCrO2 and NaCrO2 Kojima et al. (1993); Elliston et al. (1975) have been interpreted in terms of the formation of vortices,Kojima et al. (1993) i.e., the relaxation time of the magnon sidebands is determined by the density of vortices for all these compounds. The observed values of the line width in CuCrO2 is comparable to the ones reported for NaCrO2Elliston et al. (1975). The density of unbound vortices should be inversely proportional to the correlation length of two vortices given byKawamura et al. (2010)
| (2) |
Here corresponds to the melting temperature of the vortices, i.e., the energy scale to overcome the bound-vortex state, and is a characteristic exponent. To check whether this proposal is consistent with our data we use the values for the effective correlation length determined in neutron scattering measurements by Kajimoto et al.Kajimoto et al. (2010) [Fig. 5(a), green circles, right scale]. We find a similar temperature dependence but a stronger increase than the line width of the excitation R3. In addition, we perform a fit of our data using
| (3) |
and fixing the values K and to the ones obtained in recent electron spin resonance (ESR) studies of CuCrO2.Hemmida et al. (2009, 2011) The resulting curve is shown as a solid blue line in Fig. 5(a) yielding cm, , and =14(3). The data is well described for and is consistent with the previous interpretation of the formation of vortices. However, an Arrhenius law yields a similarly good fit to the line width of R3 with an activation energy = 69(1) K, and (red dashed line). Note that this value is higher than the activation energies of R1 and R2 and higher than the predicted energy cost of the breaking of two vortices obtained by a Monte Carlo simulation K.Okubo and Kawamura (2010) A similar analysis of the bands R1 and R2 in terms of vortices might be possible between and , but the available temperature range is too narrow to obtain an unambiguous fit.
The putative reason why the excitation R3 has been proposed to be exceptionally susceptible to the existence of vortices is the fact that R3 and its sideband are observable above the Néel temperature and the line width does not seem to be strongly influenced by the onset of long-range magnetic order, but rather reflects the existence of short-range order and spin fluctuations below and above .
III.2.2 -CaCr2O4
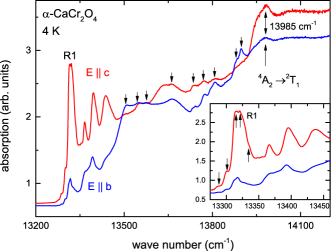
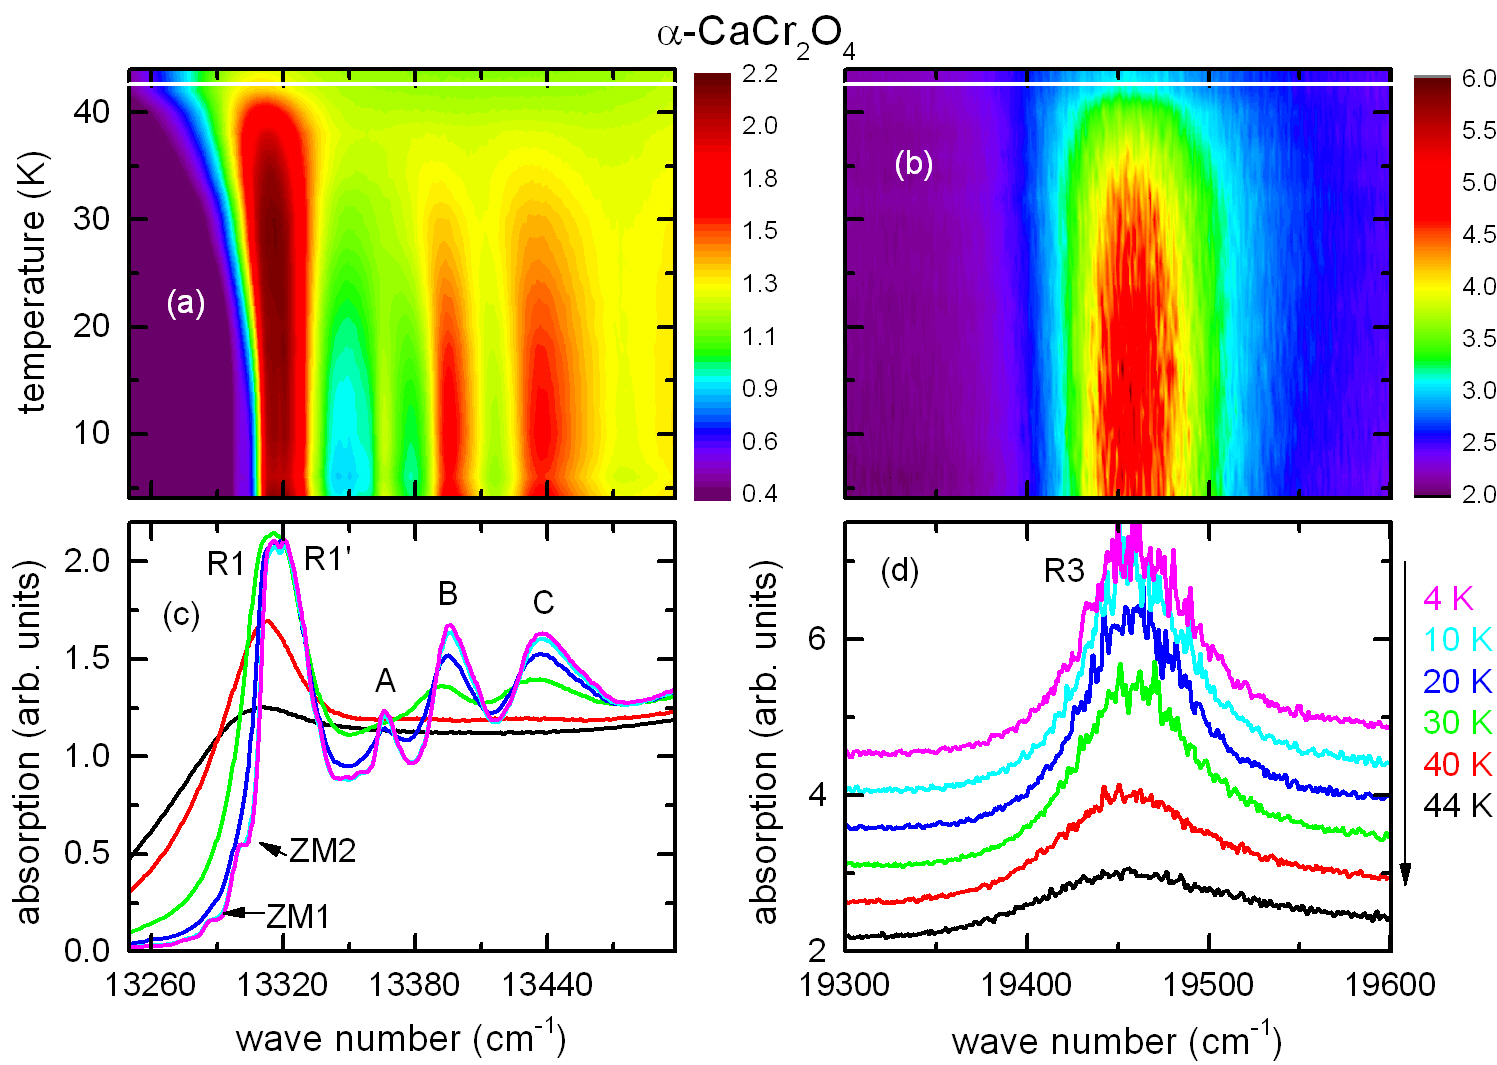
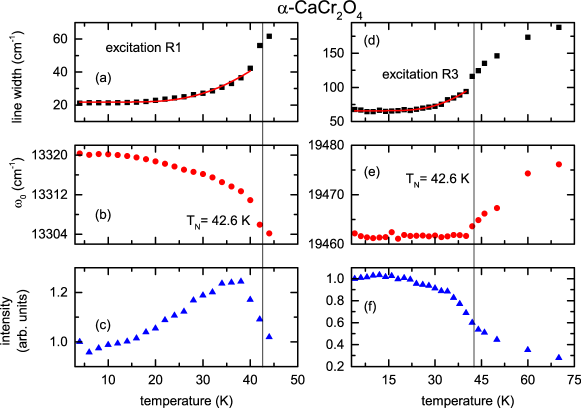
In Fig. 6 the absorption spectra of -CaCr2O4 in the magnetically ordered phase at 4 K are shown in the frequency region of the and transitions for the electric field of the incoming light polarized parallel to the crystallographic () and axes (). One can clearly observe a pronounced anisotropy, in particular with respect to the fine structure at the onset of the transition with the most intense absorption named R1 as in the case of CuCrO2. This fine structure is much more intense for , which points toward a corresponding selection rule. The reason that the fine structure is also visible for may be attributed to the fact that the samples reportedly exhibit three twins with one dominating twin (accounting for about 64% in another sampleToth et al. (2011)). In comparison to CuCrO2 the spectrum exhibits a more complex fine structure in the plotted frequency regime. In the inset of Fig. 6 arrows indicate weak features around R1 and even a small but resolvable splitting of R1 with maxima at 13316 and 13320 is visible at the lowest temperatures. In the region where we expect the onset of the transition with the corresponding absorption R2, there are several weak absorption features appearing for both polarizations (indicated by arrows in Fig. 6). The most prominent feature at 13985 for is tentatively assigned to the onset of the transition. Given the complexity of the spectra, we will restrict the discussion to the temperature dependence of the R1 fine structure (for ) and the excitation R3 at higher frequencies [see Fig. 7(d)], which does not exhibit a significant polarization dependence.
The corresponding absorption spectra are shown in Fig. 7(c) and (d) for several temperatures below and above the Néel temperature. The detailed temperature evolution is visualized in the color-coded plots in Fig. 7(a) and (b). The emergence of the fine structure in the vicinity of R1 and the appearance of R3 are clearly related to the magnetic ordering below . In contrast to the case of CuCrO2 we find weak shoulders at the low-energy flank of the most intense mode R1, which we assign to zero-magnon lines ZM1 and ZM2 at 13285 and at 13298, respectively. The observation of two zero-magnon-like features and the splitting of R1 are attributed to the fact that there are two inequivalent Cr sites in the structure (see Fig. 1).Toth et al. (2011) The difference in crystal-field strength at the two sites may account for the two different zero-magnon energies. The sideband energies with respect to ZM1 and ZM2 are listed in Table 2 to compare with the experimentally reported magnon energies.
The magnetic excitation spectra determined by neutron scatteringToth et al. (2012) revealed van-Hove singularities at 5, 11, 17, and 33 meV in powder samples corresponding to flat regions in the spin-wave dispersions. Moreover, single-crystal studies showed a gap of 3.5 meV (assigned to interplane coupling) and further flat regions at about 8 meV (81). These two energies are in agreement with the distances of the R1 feature from ZM1 and the peak at +80.1 (A) from ZM2 and justify their assignment to exciton-one-magnon sidebands. Also for the three low-energy van-Hove singularities we find corresponding sideband energies. Therefore we can assign all the strong absorptions in the vicinity of R1 to exciton-magnon excitations.
The (R3) band only reveals the absorption R3 at 19450 without any sign of a zero-magnon line and, hence, an identification as an exciton-magnon transition is not obvious. The excitation R3 broadens and seems to disappear on approaching from below, although a broad background contribution is still visible above the Néel temperature.
Following the same procedure as in the case of CuCrO2, we evaluate the main absorption peaks R1 (neglecting its small splitting at lowest temperatures) and R3 using Gaussian line shapes. The fit parameters are shown in Fig. 8. The excitation R1 can be followed up to 44 K. The eigenfrequency shows the typical increase to lower temperatures and, as expected, the line width increases strongly when approaching the magnetic ordering temperature from below. The intensity increases with temperature and exhibits a broad maximum at around 35 K before it decreases again when magnetic order gets lost. As in the case of CuCrO2 the excitation R3 can be tracked as a very broad feature up to 70 K, but the eigenfrequency is almost constant below , which is not expected for a magnon sideband, and increases for . The temperature dependence of the line width of both lines can be described by an Arrhenius law [Eq. (1)] below and yields = 152(12) K, = 846(250), = 21.8(3) for R1 and = 157(11) K, = 1455(404), = 65.8(4) for R3. The values of the activation energy of the two lines are very close, suggesting that the lifetime of both lines is governed by the same mechanism.
| ZM1 | ZM2 | Ref. [Toth et al., 2012] | |
|---|---|---|---|
| R1 | 3.7 | (1.8) | 3.5 |
| R1′ | 4.3 | (2.4) | 5 |
| A | (9.9) | 8.1 | 8 |
| B | (13.6) | 11.8 | 11 |
| C | (18.8) | 17.0 | 17 |
III.2.3 CdCr2O4 and ZnCr2O4
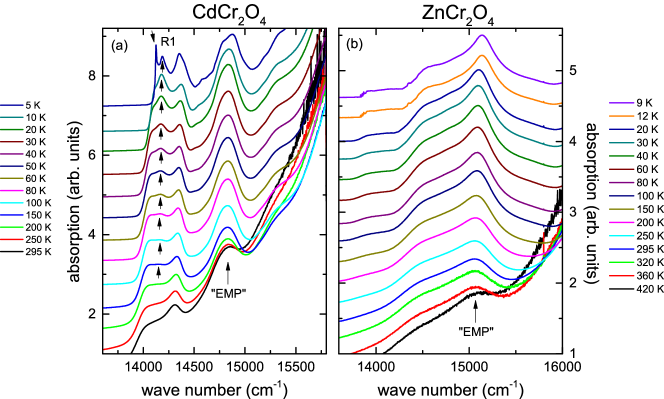
The absorption spectra in the region of the spin-forbidden and crystal-field excitations of CdCr2O4 and ZnCr2O4 are shown for several temperatures in Fig. 9(a) and (b), respectively.
The temperature evolution of the spectra in ZnCr2O4 is rather continuous and the broad absorption peaks sharpen with decreasing temperature as expected in case of phonon-assisted transitions. In addition, the smooth onsets of the transition bands sharpen up and below the magneto-structural transition the onset is edge-like and exhibits a very weak fine structure. The lowest-temperature spectrum is shown in an enlarged scale in Fig. 10(b). This group of narrow excitonic lines (further zoomed in the gray inset) has previously been observed by Szymczak et al. and attributed to the Davydov splitting of the two lowest single-ion levels of the state.Szymczak et al. (1980) Interestingly, very similar spectra have also been obtained and analyzed for exchange-coupled Cr3+ pairs doped into non-magnetic ZnGa2O4.van Gorkom et al. (1973) These authors identified the observed fine structure in terms of exciton-magnon processes and vibronic sidebands. Remarkably, the obtained values for the exchange coupling constants in dilute systems are in very good agreement with the ones obtained for ZnCr2O4 itself.Kant et al. (2009, 2010b) Above the magnetic ordering temperature this fine structure is smeared out.
The rather broad absorption band in ZnCr2O4 at 15150 cm-1 associated with has been suggested to stem from an exciton-magnon-phonon (EMP) transition,Szymczak et al. (1980) which has recently been reported to be suppressed in fields above 400 T.Miyata et al. (2011) We traced its temperature evolution to temperatures above the Curie-Weiss temperature as shown in Fig. 9(b) and still observe a broad maximum at the highest measured temperatures. This suggests that this excitation might not be governed by spin correlations, but rather corresponds to a more conventional CF excitation. Note that a very recent high-magnetic field study of this frequency region in CdCr2O4 reports the suppression of both the fine structure around R1 and the absorption assigned to an EMP transition in analogy to ZnCr2O4.Miyata et al.
Concerning the excitation R3 we did not observe any narrow absorption features for CdCr2O4 in this region and for ZnCr2O4 only a rather broad feature (not shown) has been observed, which might indicate the spin-forbidden transition.
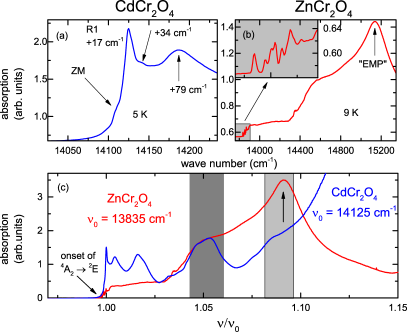
In the case of CdCr2O4 one can clearly see the emergence of the absorption peak R1 at 14125 related to the transition. In an enlarged scale [see Fig. 10(a)] shoulders are visible in the spectrum at a distance 17(2) from R1. In line with the discussion of CuCrO2 and -CaCr2O4 the shoulder at the low-energy flank is assigned to a zero-magnon line ZM and R1 to an exciton-one-magnon sideband. The magnetic excitation spectrum of CdCr2O4 has been studied by neutron scattering and spin wave excitations with energies meV (5.2), meV (19) and meV (38) were reported at the wave vector (1,0.915,0) associated with the zone center of the incommensurate spin structure.Chung et al. (2005b) In addition, in a high-field ESR study up to ten magnetic excitations have been observed and attributed to higher-harmonics of helical spin-resonance modes.Kimura et al. (2006) A recent theoretical analysis confirmed this idea and described the magnetic excitation spectrum as due to helimagnons.Choi et al. (2013a, b) We identify R1 as an exciton-one-magnon absorption involving the magnon energy , which reportedly is only slightly dispersive.Chung et al. (2005b) The weak shoulder at a distance of +34 could then correspond to an exciton-one-magnon sideband involving . Both the weak shoulders and mode R1 can not be detected anymore above the magnetic ordering temperature.
A further absorption peak is visible at a distance of +79 from ZM and remains visible above the Néel temperature and persists up to about 150 K, where the absorption spectrum seems to become plateau-like [see arrows in Fig. 9(a)]. This behavior is in contrast to the other absorption features at higher frequencies, which remain visible up to room temperature and, therefore, are likely not directly related to spin correlations. We speculate that the peak at +79 might therefore arise due to short-range spin correlations. A possible assignment of this peak could be an exciton-three-magnon peak involving .
A direct comparison of the two low-temperature absorption spectra of CdCr2O4 and ZnCr2O4 is presented in Fig. 10(c), where the spectra are plotted vs. wave number scaled to the respective onset of the exciton lines. In case of CdCr2O4 was taken as the well-defined frequency of the excitation R1 and in case of ZnCr2O4 the first peak of the fine structure at 13835 cm-1 was used. The absorption values are scaled in a way that the curves coincide at the maximum of the absorption peak visible at = 1.05 for CdCr2O4. In this scaling, even the low-energy flanks of the two curves coincide and the peak maximum in CdCr2O4 corresponds to a clear shoulder in ZnCr2O4. Moreover, the EMP feature in ZnCr2O4 seems to correspond to a shoulder in the spectrum of CdCr2O4 [see shaded areas in Fig. 10(c)]. This shoulder is directly followed by the first spin-allowed crystal-field excitation in CdCr2O4. We propose that the occurrence of similar features in both compounds and their persistence to the highest studied temperatures (exceeding the respective Curie-Weiss transitions) again favors a structural origin of these excitations. Therefore, the reported suppression of the EMP peak above 400 T in ZnCr2O4 might be interpreted as a magnetic-field induced structural change.Miyata et al. (2011) This scaling further suggests that the and regions are behaving differently in terms of relative intensities for the two compounds, i.e., the and regions appear to be of comparable intensity in CdCr2O4, while the region seems to have much higher intensity in ZnCr2O4. This might be related to the different structural distortions in the two systems in the magnetically ordered state. There is still a debate with respect to the exact symmetry of the two systems,Chern et al. (2006); Ji et al. (2009); Kant et al. (2010a) but a clear difference is that in ZnCr2O4 the lattice contracts and in CdCr2O4 it elongates along the -axis. This will certainly influence the transition probabilities and the intensities of the CF transitions. The difference in the exciton-magnon features for the two spinel systems is in our opinion due to the fact that the ground states of CdCr2O4 and ZnCr2O4 differ strongly. In CdCr2O4 a helical magnetic structure seems to be favored, while the complex magnetic structure of ZnCr2O4 has not yet been solved and might be dominated by weakly coupled molecule-like units.
IV Summary
We investigated the Cr crystal-field excitations in the triangular-lattice antiferromagnets CuCrO2 and -CaCr2O4 and in the spinels CdCr2O4 and ZnCr2O4 in order to search for exciton-magnon transitions as optical probes of the magnetic excitation spectra, the existence of short-range spin correlations, and anomalies in the lifetime of magnons due to frustration effects. In particular, optical transmission experiments can be performed on small samples and detailed temperature dependencies can be obtained. Moreover, probing exciton-magnon sidebands in pulsed high-magnetic fields can provide information on the magnetic excitation spectrum, which is inaccessible by neutron scattering (see e.g. Ref. [Miyata et al., 2011, Miyata et al., ]).
In CuCrO2 no zero-magnon lines could be observed, but three sets of fine structures have been detected to emerge with lowering temperature to the magnetically ordered state. The measured absorption peaks were assigned to exciton-magnon transitions by comparison with magnon energies found by antiferromagnetic resonance and neutron scattering experiments assuming that the zero-magnon line is almost coinciding with and therefore masked by the first intense exciton-one-magnon sideband. The temperature dependence of the line width of the most intense exciton-one-magnon sidebands R1-R3 can be described by an Arrhenius law, but yield different activation energies. The sidebands R1 and R2 related to and can only be resolved below the Néel temperature, but the sideband R3 associated with the crystal-field transition can be tracked even above and its line width does not exhibit an anomaly at the Néel temperature. This suggests that the line width of R3 can be regarded as a probe of short-range spin correlations which already exist above . Due to this fact the temperature dependence of the line width of the excitation R3 in related systems has previously been described by assuming that the exciton-magnon lifetime is determined by the existence of vortices. We find that a similar analysis holds also for CuCrO2.
In the other triangular antiferromagnet -CaCr2O4 we observed an even richer fine structure related to the and crystal-field excitations which depend on the polarization of the light with respect to the crystallographic axis in the investigated plane. Probably due to the twinning of the crystal a strict selection rule could not be observed, but the fine structure at the onset of the transition including R1 was much stronger for . In contrast to CuCrO2 weak zero-magnon lines were found below R1 and the sidebands could be directly related to spin-wave energies reported by neutron scattering. Again the magnon sidebands around R1 disappear on approaching the Néel temperature from below, but the excitation R3 remains visible also above as in the case of CuCrO2. The line widths of both lines follow an Arrhenius law with a similar activation energy, but both, intensity of R1 and eigenfrequency of R3, show an unexpected behavior and indicate that the exciton-magnon properties are more complex than in CuCrO2. Although we can not exclude the existence of vortices in this compound, a description of the line width of R3 across the Néel temperature in terms of a vortex scenario is not possible.
Even though these two triangular systems exhibit an almost ideal 120∘ helical structure the exciton-magnon features differ strongly. The reason for this difference is probably the orthorhombic distortion of -CaCr2O4 and different Cr sites. This results in a more complex spin-wave spectrum and inequivalent exchange interactions between the Cr ions driving the system further away from the isotropic nearest neighbor Heisenberg case.
In CdCr2O4 a zero-magnon line and exciton-magnon sidebands related to the transition have been observed at lowest temperatures in agreement with the reported spin-wave dispersions by neutron studies. These features disappear concomitantly with long-range magnetic order, but another sideband at +79 remains visible up to about 150 K.
In contrast, in the spinel ZnCr2O4 only a weak fine structure has been observed in agreement with a previous report. The temperature dependence of an absorption (EMP) reportedly associated with the magnetic structure and suppressed in very high-magnetic fields suggests a primarily structural origin of this excitation.
The helical magnetic structure in CdCr2O4 with its well defined magnon branches and exciton-magnon features is in contrast to the still unresolved magnetic ground state of ZnCr2O4 and the proposed existence of weakly coupled multi-spin entities. Such molecular units might produce the previously observed Davydov splittingSzymczak et al. (1980) instead of strong exciton-magnon sidebands.
Acknowledgements.
We want to thank M.V. Eremin, N. Perkins, H.-A. Krug von Nidda, M. Hemmida, and O. Tchernyshyov for fruitful discussions. We acknowledge partial support by the Deutsche Forschungsgemeinschaft via TRR 80 (Augsburg-Munich) and project DE 1762/2-1.References
- Kawamura et al. (2010) H. Kawamura, A. Yamamoto, and T. Okubo, J. Phys. Soc. Jpn. 79, 023701 (2010).
- Bernu et al. (1994) B. Bernu, P. Lecheminant, C. Lhuillier, and L. Pierre, Phys. Rev. B 50, 10048 (1994).
- Kawamura and Miyashita (1984) H. Kawamura and S. Miyashita, J. Phys. Soc. Jpn. 53, 9 (1984).
- Seki et al. (2008) S. Seki, Y. Onose, and Y. Tokura, Phys. Rev. Lett. 101, 067204 (2008).
- Ajiro et al. (1988) Y. Ajiro, H. Kikuchi, S. I. Sugiyama, T. Nakashima, S. Shamoto, N. Nakayama, M. Kiyama, N. Yamamoto, and Y. Oka, J. Phys. Soc. Jpn. 57, 2268 (1988).
- Olariu et al. (2006) A. Olariu, P. Mendels, F. Bert, B. G. Ueland, P. Schiffer, R. F. Berger, and R. J. Cava, Phys. Rev. Lett. 97, 167203 (2006).
- Hsieh et al. (2008a) D. Hsieh, D. Qian, R. F. Berger, R. J. Cava, J. W. Lynn, Q. Huang, and M. Z. Hasan, Physica B 403, 1341 (2008a).
- Hsieh et al. (2008b) D. Hsieh, D. Qian, R. F. Berger, R. J. Cava, J. W. Lynn, Q. Huang, and M. Z. Hasan, J. Phys. Chem. Solids 69, 3174 (2008b).
- Hemmida et al. (2009) M. Hemmida, H. A. K. von Nidda, N. Buttgen, A. Loidl, L. K. Alexander, R. Nath, A. V. Mahajan, R. F. Berger, R. J. Cava, Y. Singh, et al., Phys. Rev. B 80, 054406 (2009).
- Hemmida et al. (2011) M. Hemmida, H. A. K. von Nidda, and A. Loidl, J. Phys. Soc. Jpn. 80 (2011).
- Elliston et al. (1975) P. R. Elliston, F. Habbal, N. Saleh, G. E. Watson, K. W. Blazey, and H. Rohrer, J. Phys. Chem. Solids 36, 877 (1975).
- Kojima et al. (1993) N. Kojima, K. Ito, I. Mogi, M. Takeda, G. Kido, Y. Nakagawa, M. Sakai, N. Kuroda, and Y. Nishina, J. Phys. Soc. Jpn. 62, 4137 (1993).
- Tanabe et al. (1965) Y. Tanabe, T. Moriya, and S. Sugano, Phys. Rev. Lett. 15, 1023 (1965).
- Kadowaki et al. (1990) H. Kadowaki, H. Kikuchi, and Y. Ajiro, J. Phys. Condens. Matter 2, 4485 (1990).
- Poienar et al. (2009) M. Poienar, F. Damay, C. Martin, V. Hardy, A. Maignan, and G. Andre, Phys. Rev. B 79, 014412 (2009).
- Kimura et al. (2009) K. Kimura, T. Otani, H. Nakamura, Y. Wakabayashi, and T. Kimura, J. Phys. Soc. Jpn. 78, 113710 (2009).
- Soda et al. (2009) M. Soda, K. Kimura, T. Kimura, M. Matsuura, and K. Hirota, J. Phys. Soc. Jpn. 78, 124703 (2009).
- Kimura et al. (2008) K. Kimura, H. Nakamura, K. Ohgushi, and T. Kimura, Phys. Rev. B 78, 140401 (2008).
- Frontzek et al. (2011) M. Frontzek, J. T. Haraldsen, A. Podlesnyak, M. Matsuda, A. D. Christianson, R. S. Fishman, A. S. Sefat, Y. Qiu, J. R. D. Copley, S. Barilo, et al., Phys. Rev. B 84, 094448 (2011).
- Pausch and Müllerbuschbaum (1974) H. Pausch and H. K. Müllerbuschbaum, Z. Anorg. Allg. Chem. 405, 113 (1974).
- Chapon et al. (2011) L. C. Chapon, P. Manuel, F. Damay, P. Toledano, V. Hardy, and C. Martin, Phys. Rev. B 83, 024409 (2011).
- Toth et al. (2011) S. Toth, B. Lake, S. A. J. Kimber, O. Pieper, M. Reehuis, A. T. M. N. Islam, O. Zaharko, C. Ritter, A. H. Hill, H. Ryll, et al., Phys. Rev. B 84, 054452 (2011).
- Singh et al. (2011) K. Singh, C. Simon, and P. Toledano, Phys. Rev. B 84, 064129 (2011).
- Zhao et al. (2012) L. Zhao, T.-W. Lan, K.-J. Wang, C.-H. Chien, T.-L. Hung, J.-Y. Luo, W.-H. Chao, C.-C. Chang, Y.-Y. Chen, M.-K. Wu, et al., Phys. Rev. B 86, 064408 (2012).
- Toth et al. (2012) S. Toth, B. Lake, K. Hradil, T. Guidi, K. C. Rule, M. B. Stone, and A. T. M. N. Islam, Phys. Rev. Lett. 109, 127203 (2012).
- Dutton et al. (2011) S. E. Dutton, E. Climent-Pascual, P. W. Stephens, J. P. Hodges, A. Huq, C. L. Broholm, and R. J. Cava, J. Phys. Condens. Matter 23, 246005 (2011).
- Chern et al. (2008) G.-W. Chern, R. Moessner, and O. Tchernyshyov, Phys. Rev. B 78, 144418 (2008).
- Yamashita and Ueda (2000) Y. Yamashita and K. Ueda, Phys. Rev. Lett. 85, 4960 (2000).
- Tchernyshyov et al. (2002) O. Tchernyshyov, R. Moessner, and S. L. Sondhi, Phys. Rev. Lett. 88, 067203 (2002).
- Sushkov et al. (2005) A. B. Sushkov, O. Tchernyshyov, W. Ratcliff II, S. W. Cheong, and H. D. Drew, Phys. Rev. Lett. 94, 137202 (2005).
- Fennie and Rabe (2006) C. J. Fennie and K. M. Rabe, Phys. Rev. Lett. 96, 205505 (2006).
- Aguilar et al. (2008) R. ValdesAguilar, A. B. Sushkov, Y. J. Choi, S.-W. Cheong, and H. D. Drew, Phys. Rev. B 77, 092412 (2008).
- Rudolf et al. (2009) T. Rudolf, C. Kant, F. Mayr, M. Schmidt, V. Tsurkan, J. Deisenhofer, and A. Loidl, Euro. Phys. J. B 68, 153 (2009).
- Kant et al. (2009) C. Kant, J. Deisenhofer, T. Rudolf, F. Mayr, F. Schrettle, A. Loidl, V. Gnezdilov, D. Wulferding, P. Lemmens, and V. Tsurkan, Phys. Rev. B 80, 214417 (2009).
- Kant et al. (2012) C. Kant, M. Schmidt, Z. Wang, F. Mayr, V. Tsurkan, J. Deisenhofer, and A. Loidl, Phys. Rev. Lett. 108, 177203 (2012).
- Rovers et al. (2002) M. T. Rovers, P. P. Kyriakou, H. A. Dabkowska, G. M. Luke, M. I. Larkin, and A. T. Savici, Phys. Rev. B 66, 174434 (2002).
- Lee et al. (2000) S.-H. Lee, C. Broholm, T. H. Kim, W. Ratcliff II, and S.-W. Cheong, Phys. Rev. Lett. 84, 3718 (2000).
- Rudolf et al. (2007) T. Rudolf, C. Kant, F. Mayr, J. Hemberger, V. Tsurkan, and A. Loidl, Phys. Rev. B 75, 052410 (2007).
- Lee et al. (2002) S.-H. Lee, C. Broholm, W. Ratcliff, G. Gasparovic, Q. Huang, T. H. Kim, and S.-W. Cheong, Nature 418, 856 (2002).
- Chung et al. (2005a) J.-H. Chung, M. Matsuda, S.-H. Lee, K. Kakurai, H. Ueda, T. J. Sato, H. Takagi, K.-P. Hong, and S. Park, Phys. Rev. Lett. 95, 247204 (2005a).
- Tomiyasu et al. (2004) K. Tomiyasu, T. Inami, and N. Ikeda, Phys. Rev. B 70, 184411 (2004).
- Szymczak et al. (1980) H. Szymczak, W. Wardzynski, and A. Pajaczkowska, J. Magn. Magn. Matter. 15-18, 841 (1980).
- Miyata et al. (2011) A. Miyata, H. Ueda, Y. Ueda, H. Sawabe, and S. Takeyama, Phys. Rev. Lett. 107, 207203 (2011).
- Wood et al. (1968) D. L. Wood, G. F. Imbusch, R. M. Macfarlane, P. Kisliuk, and D. M. Larkin, J. Chem. Phys. 48, 5255 (1968).
- Okuda et al. (2005) T. Okuda, N. Jufuku, S. Hidaka, and N. Terada, Phys. Rev. B 72, 144403 (2005).
- (46) A. Islam, S. Toth, and B. Lake, to be published.
- Kant et al. (2010a) C. Kant, F. Mayr, T. Rudolf, M. Schmidt, F. Schrettle, J. Deisenhofer, and A. Loidl, Euro. Phys. J. Special Topics 180, 43 (2010a).
- Sugano et al. (1970) S. Sugano, Y. Tanabe, and H. Kamimura, Multiplets of Transition-Metal Ions in Crystals, Pure and applied physics (Academic Press, 1970).
- Kahan and Macfarlane (1971) H. M. Kahan and R. M. Macfarlane, J. Chem. Phys. 54, 5197 (1971).
- Wood et al. (1963) D. L. Wood, J. Ferguson, K. Knox, and J. F. Dillon, J. Chem. Phys. 39, 890 (1963).
- Gondaira and Tanabe (1966) K. I. Gondaira and Y. Tanabe, J. Phys. Soc. Jpn. 21, 1527 (1966).
- Tanabe and Gondaira (1967) Y. Tanabe and K.-I. Gondaira, J. Phys. Soc. Jpn. 22, 573 (1967).
- Shinagawa and Tanabe (1971) K. Shinagawa and Y. Tanabe, J. Phys. Soc. Jpn. 30, 1280 (1971).
- Fujiwara et al. (1972) T. Fujiwara, W. Gebhardt, Y. Tanabe, and K. Petanide, J. Phys. Soc. Jpn. 33, 39 (1972).
- Eremenko et al. (1986) V. V. Eremenko, Y. G. Litvinenko, and E. V. Matyushkin, Phys. Rep. 132, 55 (1986).
- Greene et al. (1965) R. L. Greene, D. D. Sell, W. M. Yen, A. L. Schawlow, and R. M. White, Phys. Rev. Lett. 15, 656 (1965).
- Sell et al. (1967) D. D. Sell, R. L. Greene, and R. M. White, Phys. Rev. 158, 489 (1967).
- Tylicki and Yen (1968) J. Tylicki and W. M. Yen, Physical Review 166, 488 (1968).
- Deisenhofer et al. (2008) J. Deisenhofer, I. Leonov, M. V. Eremin, C. Kant, P. Ghigna, F. Mayr, V. V. Iglamov, V. I. Anisimov, and D. van der Marel, Phys. Rev. Lett. 101, 157406 (2008).
- Moriya and Inoue (1968) T. Moriya and M. Inoue, J. Phys. Soc. Jpn. 24, 1251 (1968).
- Fujiwara and Tanabe (1975) T. Fujiwara and Y. Tanabe, J. Phys. Soc. Jpn. 39, 7 (1975).
- Sell (1968) D. D. Sell, J. Appl. Phys. 39, 1030 (1968).
- Kajimoto et al. (2010) R. Kajimoto, K. Nakajima, S. Ohira-Kawamura, Y. Inamura, K. Kakurai, M. Arai, T. Hokazono, S. Oozono, and T. Okuda, J. Phys. Soc. Jpn. 79, 123705 (2010).
- Yamaguchi et al. (2010) H. Yamaguchi, S. Ohtomo, S. Kimura, M. Hagiwara, K. Kimura, T. Kimura, T. Okuda, and K. Kindo, Phys. Rev. B 81, 033104 (2010).
- Poienar et al. (2010) M. Poienar, F. Damay, C. Martin, J. Robert, and S. Petit, Phys. Rev. B 81, 104411 (2010).
- Okubo and Kawamura (2010) T. Okubo and H. Kawamura, J. Phys. Soc. Jpn. 79, 084706 (2010).
- van Gorkom et al. (1973) G. G. P. van Gorkom, J. C. M. Henning, and R. P. van Stapele, Phys. Rev. B 8, 955 (1973).
- Kant et al. (2010b) C. Kant, J. Deisenhofer, V. Tsurkan, and A. Loidl, J. Phys.: Conf. Ser. 200, 032032 (2010b).
- (69) A. Miyata, S. Takeyama, and H. Ueda, arxiv:1302.3664v1 (unpublished).
- Chung et al. (2005b) J. H. Chung, M. Matsuda, S. H. Lee, K. Kakurai, H. Ueda, T. J. Sato, H. Takagi, K. P. Hong, and S. Park, Phys. Rev. Lett. 95, 247204 (2005b).
- Kimura et al. (2006) S. Kimura, M. Hagiwara, H. Ueda, Y. Narumi, K. Kindo, H. Yashiro, T. Kashiwagi, and H. Takagi, Phys. Rev. Lett. 97, 257202 (2006).
- Choi et al. (2013a) E. Choi, G.-W. Chern, and N. B. Perkins, Europhys. Lett. 101, 37004 (2013a).
- Choi et al. (2013b) E. Choi, G.-W. Chern, and N. B. Perkins, Phys. Rev. B 87, 054418 (2013b).
- Chern et al. (2006) G.-W. Chern, C. J. Fennie, and O. Tchernyshyov, Phys. Rev. B 74, 060405(R) (2006).
- Ji et al. (2009) S. Ji, S.-H. Lee, C. Broholm, T. Y. Koo, W. Ratcliff, S.-W. Cheong, and P. Zschack, Phys. Rev. Lett. 103, 037201 (2009).