Analysis of Blocking Probability in a Relay-based Cellular OFDMA Network
Abstract
Relay deployment in Orthogonal Frequency Division Multiple Access (OFDMA) based cellular networks helps in coverage extension and/or capacity improvement. To quantify capacity improvement, blocking probability of voice traffic is typically calculated using Erlang B formula. This calculation is based on the assumption that all users require same amount of resources to satisfy their rate requirement. However, in an OFDMA system, each user requires different number of subcarriers to meet its rate requirement. This resource requirement depends on the Signal to Interference Ratio (SIR) experienced by a user. Therefore, the Erlang B formula can not be employed to compute blocking probability in an OFDMA network. In this paper, we determine an analytical expression to compute the blocking probability of relay based cellular OFDMA network. We determine an expression of the probability distribution of the user’s resource requirement based on its experienced SIR. Then, we classify the users into various classes depending upon their subcarrier requirement. We consider the system to be a multi-dimensional system with different classes and evaluate the blocking probability of system using the multi-dimensional Erlang loss formulas. This model is useful in the performance evaluation, design, planning of resources and call admission control of relay based cellular OFDMA networks like LTE. ††footnotetext: Part of this paper (Section-III) is presented in an Int. Conf. on Information Processing (ICIP), 2011, Bangluru, India.
I Introduction
The Third Generation Partnership Project Long-Term
Evolution (3GPP-LTE) proposes different schemes for mobile broadband access in order to meet the throughput and coverage requirements of
next generation cellular networks [LTE]. Deployment of Relay Stations (RSs) to increase coverage area and/or improve capacity [Throughput] is one of the proposed techniques in LTE. In this paper, we analyze the capacity improvement due to RS deployment and analytically determine the blocking
probability to quantify this improvement. Blocking probability corresponds to the probability that a user is denied sevice due to non-availability of sufficient resources in the network.
Users who experience poor signal strength from Base Station (BS), require more resources to meet
their rate requirement and a large amount of resources are consumed in serving such
users. This leads to an increase in the blocking probability. With RS deployed in the network, the Signal to Noise Ratio (SNR) experienced
by these users may improve due to closer proximity of RS and as a result, they may meet their rate requirement with fewer
resources. This reduces the blocking probability and improves the system capacity. However, as the radio resources are shared between BS and RS, deployment of RSs introduce additional sources of interference. Therefore, it is significant to study the impact of interference on the blocking probability.
Blocking probability has been used as a performance metric in [QOS_guarantee], in which the transmission
scheme selection policy (single hop or multi-hop) has been proposed to provide guaranteed target Bit Error Rate
(BER) and data rate to a mobile user. Another metric to quantify the performance improvement in a cellular network
is Erlang capacity, which is the traffic load in Erlangs supported by the cell while ensuring that blocking
probability remains less than a certain value. There is sufficient work
on Erlang capacity and blocking probability in cellular networks [GSM_blocking], [CDMA_blocking] and some literature is available on determining the Erlang capacity of cellular Orthogonal Frequency Division Multiple Access (OFDMA) networks.
In [Reviewer_1], the performance of subcarrier allocation in OFDM system has been investigated considering multi-class users. However, in this work, the subcarriers are not released simultaneously, as would happen in practice but are released one by one. The Erlang Loss Model for blocking probability analysis has been suggested in [Reviewer_2] and is proved to be numerically efficient and insensitive to the distribution of call duration. More recently in [Reviewer_3], the OFDM system for blocking probability computation considers power and subcarrier allocation for users. Despite the availability of sufficient literature on determining the Erlang capacity and blocking probability in cellular networks including OFDMA systems, limited literature is available on determining the Erlang capacity of relay
based cellular OFDMA networks [uplink2], [amc], [Gauri]. In [uplink2], the uplink
Erlang capacity of relay-based OFDMA network has been derived considering adaptive modulation and coding supporting both
voice and data traffic. In [amc], the uplink capacity and spectral efficiency of relay-based cellular networks have been analyzed. The bandwidth distribution between BS and RSs has been determined to ensure that the blocking probability is less than a specific threshold. The impact of number of RSs and their positions on Erlang capacity is investigated by considering Adaptive Modulation and Coding (AMC) and Multiple-Input Multiple-Output (MIMO) transmissions.
In [uplink2] and [amc], it is assumed that all users require equal number of resources.
However, the impact of user location, shadowing and interference from neighboring cells on the resource requirement has not been considered. If distinct users of same data rate requirement are present at different locations, they may experience different Signal to Interference Ratio (SIR) and hence require different resources in terms of number of subcarriers to satisfy their data rate requirement. In the queuing literature, the problem of incoming users requiring different number of resources has been addressed in some works. In [Glimpson], wide band and narrow band traffic is considered, where no queuing is allowed for narrow band traffic and a finite length queue is provided for wide band traffic. The blocking probability for each traffic class is determined using numerical methods. Similarly, in [Kaufman] and [multi], the problem of multiple server requirement is analyzed and multidimensional Erlang loss formulas have been derived.
To the best of our knowledge, no literature is available for the computation of blocking probability in relay based cellular OFDMA systems, where different users of same rate requirement need different subcarriers. In [Gauri], different subcarrier requirement of users has been considered in the blocking probability computations. However, SIR experienced by a user and distribution of subcarrier requirement were determined using simulations. In [ICIP_Ranjan] (by one of the authors), Cumulative Distribution Function (CDF) of interference is computed analytically. However, blocking probability is not determined.
In this paper, we propose an analytical model to evaluate the performance of a relay based cellular OFDMA network (such as an LTE network) in terms of blocking probability. The distinct feature of our paper is that we consider the impact of user location, shadowing and interference from neighboring cells in our analysis for blocking probability. Specifically, we determine the SIR experienced by a user and probability distribution of the number of subcarriers required. Then, we classify incoming users into different classes based on their subcarrier requirement. We consider the network to be a multi-dimensional system with different classes and model the system states by multi-dimensional Markov chain. In such a system model, the
computational complexity is more due to the large state space involving the states of both BS and RS. To reduce this
complexity, we propose an approximation where the state space of BS and RS are decoupled. With this simplification, we evaluate the blocking probability of each class in a relay based OFDMA system. This approximation is justified by comparing the analytical results with simulation results where we do not make such assumption.
The rest of the paper is organized as follows. Section II introduces the system model for the downlink of relay based cellular OFDMA network. In Section III, a model to characterize Inter-Cell Interference (ICI) on a Mobile Station (MS) is presented
and the CDFs of ICI on BS-MS, BS-RS and RS-MS transmission links are derived. In
Section IV, an analytical model is proposed to determine the subcarrier requirement and its probability distribution based on ICI experienced.
In Section V, the incoming users are classified into various classes based on their subcarrier requirement. It is also shown that complexity is introduced due to the large size of state space when
both BS and RS are considered. Then, an analytical model is developed by considering the state space of BS and RS
separately. This model is used to compute the blocking probability for each
class of user at BS and RS. Finally, the blocking probability of a relay-based OFDMA network is computed using
multi-dimensional Erlang loss formulas [multi].
In Section VI, the simulation methodology is explained and both analytical and simulation results are discussed. Here, the system performance (in terms of blocking probability) of a non-relay system with that of the relay-based cellular OFDMA system is compared. Finally, Section VII concludes the paper with an insight into the future extensions of the present work.
II System Model
We consider the downlink transmission scenario in a relay-based cellular OFDMA network as shown in
Fig.1. We define the reference cell as a combination of seven sub-cells. The central
sub-cell consists of a BS centered at , while each surrounding sub-cell (i.e. , ,
) consists of one RS at the centre. For convenience, we approximate the coverage of BS and RS by hexagons as shown in Fig.1.
We define the central sub-cell as base region and the six
surrounding sub-cells , , as relay region in every cell.
We define a MS (user) present in the reference cell as target MS.
We assume that BS and RS have
Line of Sight (LoS) connection. All RSs are assumed to be amplify-and-forward type relays. However, we consider the factor of amplified noise to be small and therefore, neglect that in our calculations further.
We consider universal frequency reuse, i.e. all cells use the same spectrum, which is shared between BS and six RSs. We consider the interference from the first tier of neighboring cells only.
We also consider the effect of path loss and lognormal shadowing on the transmitted signal. Let the BS transmit at power
to a MS located at distance , then the received power at MS will be , where
is path loss exponent and represents lognormal shadowing on BS-MS link. is a Gaussian random variable with mean dB and standard deviation . Since thermal noise is negligible in an interference-limited reuse-one network, we ignore it in our computations. Note that we do not consider fast fading and frequency-selective fading as our objective is to evaluate the blocking probability from a long term capacity planning perspective. For the same reason, we do not consider any power control mechanism and assume that BS transmits at fixed power.
In practice, the association of MS with BS or RS is determined based on SIR. If SIR experienced by MS from BS is above threshold, then it will be associated with BS otherwise with RS. In the present paper however, we consider a model where users present in BS region are associated with BS directly and those present in relay region are associated with the corresponding RS. It is assumed that the users are uniformly distributed in the respective regions of the cell. As explained later in Section V, out of the total call arrivals to the cell, a fraction is assumed to occur in BS region, while the remaining are assumed to have occured in relay region.
We assume that there are number of subcarriers available in the reference cell, which are shared between BS and six RSs. Each RS and BS are allocated and subcarriers respectively, such that . If insufficient number of subcarriers are allocated to RS, then RS will not be able to relay the signals received from BS to MS. On the other hand, if the subcarriers allocated to RSs are more than the required, then there may be an increase in call blocking at the BS. Thus, the value of may influence the overall system performance and therefore needs to be carefully designed. In this paper, we do not consider an optimal method for sharing the subcarriers amongst BS and six RSs.
In the reference cell, all users have been
allocated orthogonal subcarriers and therefore no intra-cell interference exists. However, in a network with universal
frequency reuse, users will experience interference from RSs and BSs of neighboring cells. We consider the system to be fully loaded (i.e. all subcarriers are in use in all neighboring cells
of the first tier of cells). We analyze this interference on BS-MS, BS-RS and RS-MS link and compute their Cumulative Distribution Functions (CDFs).
Using these CDFs, we determine the probability distribution of subcarrier requirement on these three links.
We consider
the rate requirement to be same for all users. The blocking probability on each link is calculated
and then overall blocking probability for relay based OFDMA network is determined.
III Inter-Cell Interference modeling
In this section, we consider a target MS (user) in the reference cell.
We analyze the SIR experienced by the target MS on BS-MS link if it is associated with BS and on BS-RS and RS-MS links, if it is associated with RS. Then, we compute the CDF of SIR on these links following [ICIP_Ranjan]. For this, we divide the incoming users into two groups,
Group 1: Users present in base region are associated with the BS directly on the BS-MS link. These users are called direct users.
Group 2: Users present in the relay regions are associated with the BS via corresponding RS on BS-RS and RS-MS links. These users are called hopped users.
Note that we use the terms users and calls interchangeably in this paper.
III-A SIR on BS-MS, BS-RS and RS-MS transmission links
Let , and denote SIR on a subcarrier used on BS-MS, BS-RS and RS-MS links respectively. Then we have,
| (1) |
| (2) |
and
| (3) |
where,
-
•
, and denote the power transmitted by BS to target MS, BS to RS and RS to target MS respectively.
-
•
, and denote the distance between BS and target MS present in base region, BS and RS (with which the target MS is associated) and RS and target MS present in any of the relay regions respectively.
-
•
, and denote the distance between neighboring BS and target MS (present in base region), neighboring BS and RS (with which the target MS is associated) and neighboring RS and target MS (present in any of the relay regions) respectively.
-
•
is the number of interferers in the first tier of cells.
-
•
, and represent lognormal shadowing on BS-MS, BS-RS and RS-MS links. Each of them is a Gaussian random variable with mean dB and standard deviations , and dB respectively.
-
•
, and represent lognormal shadowing on neighboring BS and target MS link, neighboring BS and RS link, and neighboring RS and target MS link. Each of them is a Gaussian random variable with mean dB and standard deviations , and dB respectively.
III-B CDF of SIR
In this section, we determine mean and variance of interference to signal ratio in two steps.
In [Filho], [Yeh] and [Kostic], it has been argued that the total interference power received from
various interferers (in a universal frequency reuse system) can be modeled by lognormal distribution with some mean and variance. We make the same assumption here. Accordingly, we proceed to calculate the mean and variance of .
We rewrite Eq. 1 as,
Step-1: Let , and be the coordinates of BS in reference cell, target MS in
reference cell and the interfering BS present in the first tier respectively.
is grouped into two components, s and s as,
| (4) |
where,
and
is the ratio of distances and is a function of the position of user in the reference cell. The position of target MS in the reference cell is random but the interfering BSs have fixed positions. Therefore, s are correlated and as a result, s are correlated RVs.
is a ratio of two lognormal RVs, shadowing from interfering BS to the target MS and
shadowing from the serving BS to the target MS. As suggested in [son], it can be approximated by a lognormal RV with mean and variance
. Thus, all s are lognormal RVs but correlated. Note that lognormal shadowing is independent of position of user. Hence, it is reasonable to also assume for
and to be independent for any pair .
We assume that,
and = constant, .
The first and second moments of are determined as,
| (5) |
| (6) |
In Eq. 5 and 6, computations of , and are straightforward. and are solved as follows,
Since the distances s between the target MS and the interfering fixed BS are correlated, can not be separated into a sum of terms. It is computed by averaging over the area as follows,
| (7) |
Now, to compute , expectation is taken over all possible positions the target MS can take in the base region. These integrals are evaluated separately for each interfering BS and then summed for all BSs to get , as shown below,
| (8) |
Eq. 7 and 8 can be solved numerically for hexagonal geometry.
Step-2: We have obtained first and second moments of in Step-1 (Eq. 5 and 6). Its distribution can be approximated by lognormal distribution with parameters .
In general the moment can be written as,
| (9) |
Using = and and on inverting, we obtain,
| (10) |
and
| (11) |
Using Eq. 10 and 11, we determine the distribution as,
| (12) |
Here is the standard normal CDF.
Similar calculations are performed to obtain the CDF of and on BS-RS and RS-MS links as,
| (13) |
and
| (14) |
Thus, we have determined the distribution of interference to signal ratio on a subcarrier on the three transmission links, i.e., BS-MS, BS-RS and RS-MS links.
IV Analytical Model to determine resource requirement based on CDF of SIR
In cellular OFDMA system, an incoming user is allocated a certain number of sub-carriers to satisfy its rate
requirement. In our formulation, we consider that all incoming users have the same rate requirement .
Due to different SIR experienced by the users, they will require different number of subcarriers.
The objective of BS is to satisfy the rate requirement of each user, by
allocating it the requested number of subcarriers which depends upon its experienced SIR. There are orthogonal subcarriers available at the BS, each of bandwidth Hz.
Let, be the SIR experienced by a user while using subcarrier on link. Then, the
rate achieved using number of subcarriers on BS-MS link is given by,
| (15) |
Since no frequency dependent fast fading is considered (Section II), SIR on each subcarrier is same, i.e. , the number of subcarriers () required by any user can be expressed as,
| (16) |
Now, we distinguish users based on their subcarrier requirement as follows.
We divide the entire interference to signal ratio (determined in section III-B) range into
non-overlapping consecutive intervals with boundaries denoted by
. For each new user on BS-MS link, when the received interference to signal ratio falls in the range , then user is considered to be in
class . As lies in the range the highest possible class of a user will be when
falls in the range .
Let denote the number of subcarriers required by the class user on that link. In the present case, we have .
Let . Then, Eq. 16 can be re-written as,
| (17) |
Note that Eq. 17 is used to determine the interference boundaries by assigning the number of subcarriers = to each interval . Thus, for each interval and assigned number of subcarriers , the interference boundaries are determined. Let, denote the probability that an incoming user belongs to class and requires number of subcarriers on BS-MS link to meet its rate requirement. It is determined as,
| (18) | ||||
where is the CDF of interference to signal ratio (Eq. 12) on BS-MS link. Similar calculations are performed to determine the ‘probability of subcarrier requirement’111Note that the ‘probability of subcarrier requirement’ represents the probability that a discrete random variable, say equals the number of subcarriers required by a user. For the ease of discussion, we use this terminology throughout this paper. on BS-RS and RS-MS links and they are denoted by and respectively.
V Analysis of Blocking Probability
For a relay based cellular OFDMA system, we have two types of incoming calls
(as mentioned in section III):
direct and hopped calls. Let, and be the number of classes of direct calls and hopped calls respectively.
Let, and denote the class of direct and hopped calls where and . We denote the subcarrier requirement of class of direct calls and class of hopped calls by
, and on BS-MS, BS-RS and RS-MS links respectively such that, .
Note that denotes the total subcarriers required by the class user of the hopped call.
If an incoming user in base region requires subcarriers, then it belongs to class of direct call
and if it requires subcarriers in any of the relay regions, then it belongs to class of hopped call.
Hereafter, we denote the probability of subcarrier requirement for various calls by , and on BS-MS, BS-RS and RS-MS links respectively. These probabilities are evaluated as illustrated in Eq.18 in Section IV.
To admit a direct call, the required number of subcarriers should be available at the BS. However, to accomodate
a hopped call, the required number of subcarriers should be available at BS as well as RS. Thus, a direct call
implies the arrival of one call on BS-MS link and a hopped call implies arrival of one call each on BS-RS and RS-MS
link222In a practical cellular system, it is ensured that RS does not receive from BS and transmit to MS simultaneously in order to eliminate the relay transmitter causing interference to its own receiver. For example, in LTE, specific subframes known as the Multicast/Broadcast Single Frequency Network (MBSFN) subframes [LTE_RS_Txn] are utilized to create gaps in the RS-MS transmission, during which transmission on only BS-RS link happens. Though we have not specifically considered this scenario, our system model captures such transmission scenario if we consider resource sharing at the subframe level. Note that the analytical results remain unaffected with this consideration. In this section, we determine the blocking probability of users belonging to direct and hopped calls.
We assume that call arrivals in each cell are Poisson distributed with mean arrival rate . Let, a fraction of the total call arrivals, say be served directly by BS, then the arrival rate of direct calls is and that of hopped calls is . The service times of each class of direct and hopped calls are exponentially distributed with mean . From the assumption of uniform distribution of users, hopped calls are equally distributed across the six RSs in the cell. Thus, the arrival rate of
hopped calls in the coverage area of each RS is . Let, and be the blocking probability of direct and hopped calls respectively. Then, the overall call blocking probability is given by,
| (19) |
A direct call is blocked if the required number of subcarriers is not available at the BS and a hopped call is blocked if the required number of subcarriers is not available at any of the two i.e. BS or RS. We define the state of the system to be
| (20) |
where and are the number of users in class of direct calls and class of hopped calls respectively.
denotes the number of subcarriers required by the class user of direct call and
denotes the number of subcarriers required by the class user of hopped call.
These system states can be modeled by discrete time dimensional Markov chain.
The state space is finite and meets the following constraints-
| (21) |
| (22) |
| (23) |
| (24) |
The constraint in Eq. 21 give an upper bound on the number of subcarriers available for allocation on the three links. The total number of subcarriers available at BS and corresponding RS gives an upper bound on the number of subcarriers that can be used in the system. The number of subcarriers available at the BS gives an upper bound on the number of subcarriers that can be used by direct calls on BS-MS link and hopped calls on BS-RS link (Eq. 22). Similarly, the number of subcarriers available at RS gives an upper bound on the number of subcarriers that can be used by hopped calls on RS-MS link (Eq. 23). In the system there can be either no user or a finite non-negative number of users on each link (Eq. 24).
Example-1: For illustration, let us consider only one class of each call say, class 2 of direct call (i.e., ) and
class 3 of hopped call (i.e.,). Let and . The number of subcarriers for hopped
call is the sum of subcarriers required on BS-RS and RS-MS links. Note that BS-RS and RS-MS link may require either and or and depending on the SIR experienced on each link. Thus, there are two possible combinations of subcarrier requirement for a hopped call on BS-RS and RS-MS links i.e. and .
Let, the probability of subcarrier requirement of hopped call be . Then we have,
| (25) |
The arrival rate of hopped call of class () and direct call of class () is given by,
| (26) |
The states of the system are represented by two dimensional Markov chain in Fig. 2. Each state corresponds to the number of subcarrier requirement for direct calls and hopped calls. There are various combinations of different subcarrier requirement on BS-RS and RS-MS links for a hopped call.
The different combinations of subcarrier requirement for the first row of Markov chain in
Fig. 2 denotes the case, when only users of hopped call are present. It is further illustrated in Fig. 3, where the state representation is modified to indicate the number of subcarrier requirement for hopped calls on BS-RS and RS-MS links distinctly.
At any instant of time, the number of calls present in the system
using various combination of subcarriers can be found by traversing a path as shown with dotted lines in
Fig. 3. Similar combinations of subcarrier requirement of hopped calls with direct calls present in the system can be obtained for various rows of Markov chain of Fig. 2.
As mentioned in Example-1, when a hopped call with arrives in the system, it requires either of the
combinations or subcarriers on BS-RS and RS-MS links.
This hopped call is blocked when the required number of subcarriers are unavailable at either BS or RS. Observing the dotted lines in Fig. 3, it becomes clear that after allocating the resources to user, BS is left with subcarrier for new allocation on BS-RS link and RS has no subcarriers left for further allocation on RS-MS link and blocking occurs. The notation indicates that subcarriers are being used by different hopped calls on RS-MS link.
Similarly, other combinations of states leading to blocking state are shown in Fig. 3. This implies that there can be at most users of hopped calls in this example.
As can be noticed from this example, determining the set of all possible states which satisfy the given constraints for a single class of
each call is complex.
As the number of classes and the number of subcarriers at BS and RS increase, the size of the state space
increases and it becomes very difficult to determine all possible combinations. This complexity is due to two
reasons: a) State space consists of the subcarrier requirement of calls of all classes on all the three links and b) The states on BS-MS and BS-RS links are interrelated because BS has to use the available subcarriers for allocation to both direct call and hopped calls.
To simplify the computational complexity, we consider the calls served by BS and RS as separate systems as both have distinct set of subcarriers. We also consider that for a hopped call, the required number of subcarriers are allocated by BS on BS-RS link and by RS on RS-MS link. Allocation of subcarriers to a hopped user on BS-RS and RS-MS links by BS and RS separately enables decoupling of state space of BS and RS. With this consideration, we determine the blocking probability in base and relay regions separately in the following subsections. The sum of blocking probability of calls in base region and relay region is an approximation to the overall blocking probability. We verify the validity of this approximation through simulations.
V-A Blocking for Users present in Relay Region (Hopped Calls)
When a user is in any of the relay regions and experiences SIR and on BS-RS and
RS-MS link, it requires number of subcarriers with probability and
number of subcarriers with probability . The availability of
subcarriers on both the links i.e. BS-RS and RS-MS links is determined. If subcarriers are available on both the
links, and subcarriers are allocated by BS and RS. Otherwise, that
incoming user is blocked. In other words, blocking occurs when either number of subcarriers are unavailable on BS-RS link or
number of subcarriers are unavailable on RS-MS link.
Let, and be the blocking probability of hopped call on BS-RS and RS-MS link. Then, the average blocking probability of hopped calls is given as,
| (27) |
In this subsection, we determine and in the next subsection we will determine .
There are classes of hopped calls on RS-MS link, each requiring subcarriers. The arrival rate of each class of these calls at RS is . Let the service time for all classes of call be exponentially distributed with mean service time . Then, the offered load for class on RS-MS link is
= . It is assumed that after completion of a call, the subcarriers are released by the user on both the links and they become available for use at both BS and RS.
We define the state of serving RS as,
| (28) |
where is the number of users of hopped calls of class and is the number of subcarriers required by this hopped call of class. Any class of hopped call is said to be blocked, when all subcarriers are in use. Therefore, the states of the system is modeled by dimensional Markov chain. The state space is finite and meet the following constraints-
| (29) |
Example-2: Let us consider subcarriers and classes of hopped users. Let the users require subcarrier with probability and
subcarriers with probability . Thus, the arrival rate of
class- users is and that of class- is .
The states of the system are denoted by . The state transition diagram is
shown in Fig. 4. Under the assumption of statistical equilibrium, the state probabilities are
obtained by solving the global balance equations for each state.
Let us consider any four interconnected states in Fig. 4. If the flow in clockwise direction equals the flow in the opposite direction, then the process is said to be reversible [multi]. Let, be the state probability. Note that the state probability denotes the probability that the total number of subcarriers used by class-1 and class-2 users on RS-MS link are and respectively. Then, from Fig. 4, we have,
Clockwise:
.
Anticlockwise:
.
If these two expressions are equal, then the process is said to be reversible [multi].
We can express any state probability, say in terms of
by choosing any path between the two
states, and the state itself, i.e, (Kolmogorov’s criteria [Reviewer_5]).
In Fig. 4, can be obtained by choosing the path: , , and , and we obtain the following equation,
Thus, there are two users of class and one user of class and this state probability has product form. Similarly, Kolmogorov’s
criteria is applicable to a system with classes,
and the state probabilities in dimensional system will have product form [multi].
Let, be the probability that the system is in state .
Since all the states are reversible, the solution is given in the standard product form [multi] as,
| (31) |
Let, be the set of states in which an incoming hopped call on RS-MS link of either class is blocked. It is represented as,
| (32) |
In Fig. 4, the states in which an incoming user of class- will be blocked are
, and . The sum of the probabilities of these states is equal to the blocking probability
for class-. Similarly, the states in which an incoming user of class- will be blocked are ,
and . The sum of the probabilities of these states is equal to the blocking probability for class-. The above illustration makes it clear that the blocking probability for any class can be obtained by summing the probabilities of all those states in which an incoming user of that class will be blocked.
In general, for a relay based cellular OFDMA system with classes, blocking probability for hopped call of class on RS-MS link is given by,
The average blocking probability for hopped calls on RS-MS link is given by,
| (34) |
In the next sub-section, we determine the blocking probability of direct calls.
V-B Blocking for Users present in Base Region (Direct Calls)
When a user is in base region and experiences SIR , it requires number of subcarriers
with probability . The availability of subcarriers is determined at BS. If they are
available, then subcarriers are allocated by the BS. However subcarriers are also shared by class of hopped call on BS-RS link, each of which requires subcarriers.
Thus, there are and classes of direct calls on BS-MS link and hopped calls on BS-RS link respectively. The arrival rate of class of direct calls is and class of hopped calls is .
We define the state of BS as,
| (35) |
where is the number of direct users of class and is the number of hopped users
of class. and denote the subcarrier requirement
of and class of direct and hopped calls respectively.
If the subcarrier requirement for any class of direct call and hopped call on BS-RS link is same, then
for BS both the calls will belong to the same class, irrespective of whether it is a direct or a hopped call.
Thus, the state of BS can be modified as, where = 1,…, ,
denoting the class of users arriving at the BS. denotes the subcarrier requirement of class of user
and denotes number of users of class arriving at the BS.
It is possible that some hopped calls get the required number of subcarriers on BS-RS link but not on RS-MS link. This is accounted by multiplying by a discount factor . Let, the arrival rate of all calls at BS be . Then, the arrival rate of class call at BS will be, . The service time for all classes of calls at BS is exponentially distributed with mean service time . Then, the offered load for class call at BS is = .
Any class of calls (direct or hopped calls) at BS is said to be blocked, when all
subcarriers are in use. Therefore, the states of the system are represented by dimensional Markov chain. The state space is finite and the constraints to be met are,
| (36) |
Let, be the probability that the system is in state . Since all the states are reversible, the solution is given in the product form as following [multi],
| (37) |
Let, be the set of those states in which an incoming direct call or hopped call at BS of any class is blocked. It is represented as,
| (38) |
Therefore, the blocking probability for class user at BS is given by,
The average blocking probability for direct calls on BS-MS link and hopped calls on BS-RS link is given by,
| (40) |
Thus, from Eqs. 19, 27, 34 and 40, we can determine the overall blocking probability of the system.
VI Results and Discussions
VI-A Comparison of Analytical and Simulation Results
In this section, we illustrate the results based on the analytical models developed in the previous sections and present validation of the analytical results using simulations. We consider
the downlink of relay assisted OFDMA system. The values of system parameters chosen for the analysis are as per the LTE standard [3GPP_PHY] and are given in Table II.
We perform the analysis considering four rate requirement - and Kbps.
The simulation procedure consists of modeling a snapshot of location of users (calls), their arrival and departure times in the reference cell as well as neighboring cells. The user can be located either in the base region or relay region of a cell. We generate a fraction of total calls in the base region and remaining in the relay region. The call arrivals are Poisson distributed with rate and holding times are exponentially distributed with mean in all cells. Available subcarriers are shared between BS and six RSs.
For every new call arrival, we check the association of user with base region or relay region. Based on this association, a call is termed as direct call or hopped call. Accordingly, we evaluate the SIR experienced by that call on BS-MS link (or BS-RS and RS-MS links). We consider the random subcarrier allocation scheme on all the three transmission links. For a direct (hopped) call on BS-MS link (BS-RS and RS-MS links), one subcarrier is randomly chosen from the available subcarriers, i.e., the unused subcarriers from the total of for BS and for RS. Then, it is checked whether the user’s rate requirement is satisfied, that is whether for that subcarrier is greater than or equal to required rate . If not, BS or RS continues to add randomly chosen subcarriers until the total achievable rate become greater or equal to . If the available set of subcarriers can not meet the rate requirement, the call is blocked. Note that a hopped call is blocked if the required number of subcarriers are not available on either of the links. We consider that the set of allocated subcarriers to the user is utilized for the entire duration of the call. After the completion of call, the subcarriers are released by the user and they become available for use simultaneously at both BS and RS. At this point, the processing of one snapshot is complete and another snapshot is continued. Simulation is performed over such independent snapshots. From these simulations, we determine the probability distribution of the subcarrier requirement on each of the links.
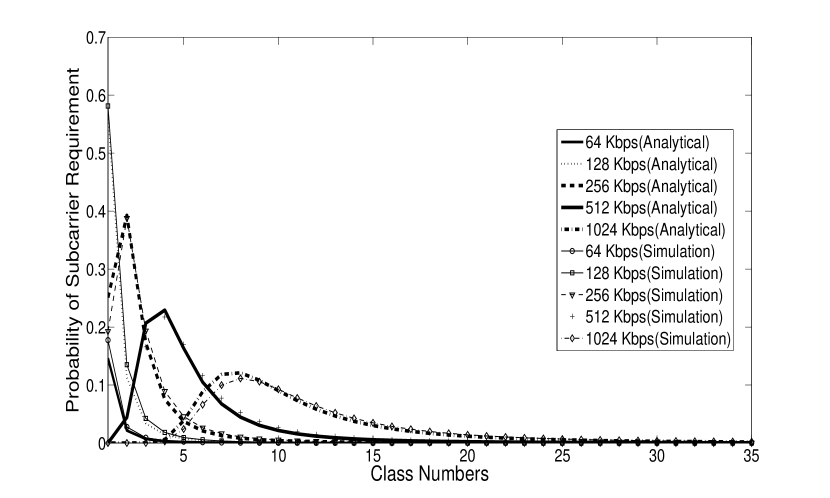
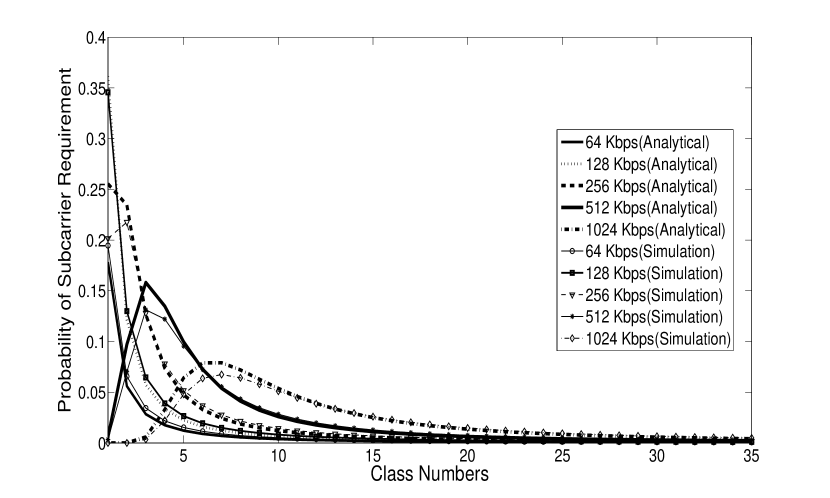
Fig. 5 and Fig. 6 give the probability of subcarrier requirement (evaluated in Eq. 18) for four different data rates on BS-MS and BS-RS link respectively. It is the probability of a call belonging to a certain class. The probability of a call belonging to lower class is more on BS-RS link due to line of sight path and lesser impact of shadowing.
From these two figures, we observe that the subcarrier requirement changes with the change in rate requirement (). For lower , less number of subcarriers are required and therefore, majority of users will belong to lower classes. For example, in Fig. 5, for Kbps, the probability of a call belonging to a class between 1 and 15 is non-zero, and the probability of a call belonging to higher classes is close to zero. Similarly, for high , say kbps, there are effectively no users that require less number of subcarriers. Therefore, the probability of a call belonging to a class between 5 and 35 is non-zero, and the probability of call belonging to lower classes is almost zero. This clearly indicates two things-
that for a given rate requirement, 1) the number of class will depend on the range for which the probability of a call belonging to a certain class (i.e.,
subcarrier requirement) is non-zero and 2) the definition of class will not always be (as defined in Section IV), in particular for higher rates. It will depend on the lowest and the highest class for which the subcarrier requirement is non-zero. For example, for Kbps, there will be classes and it will range from class to class , i.e., (offset of 4).
Thus, definition of class and determining the number of classes depend on the rate requirement. We observe that the simulation results closely match with the analytical results.
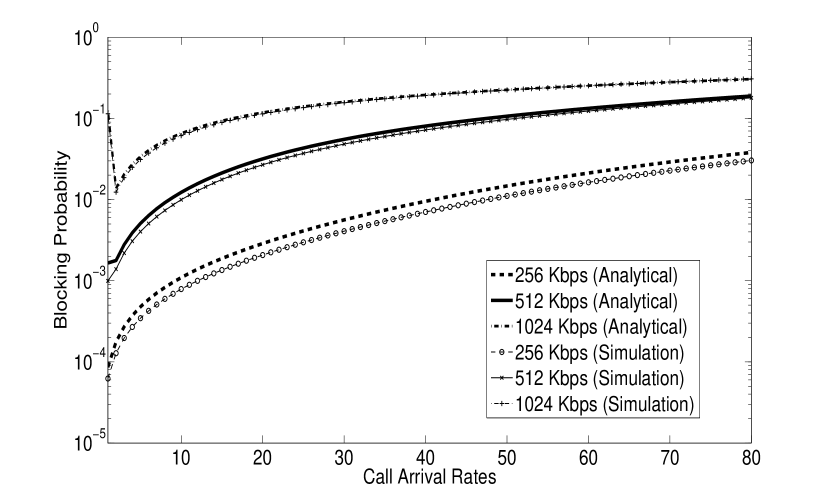
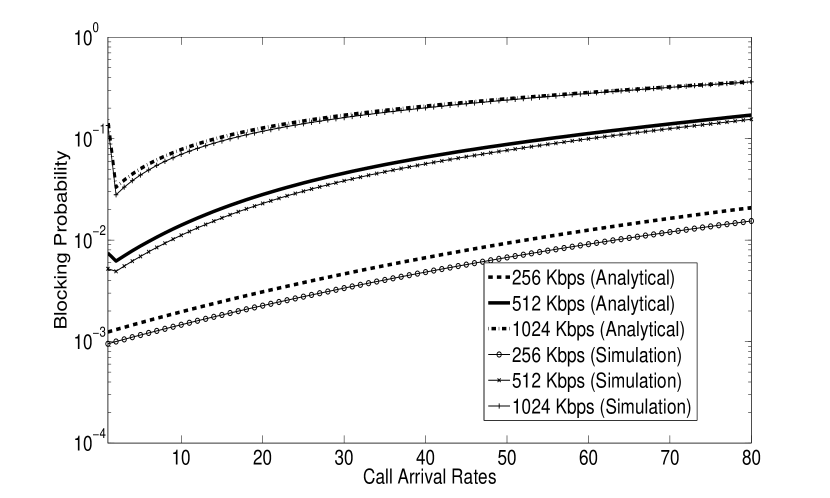
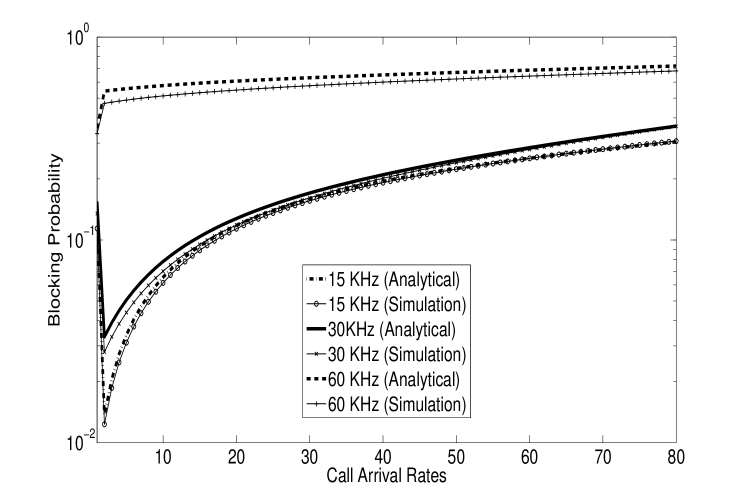
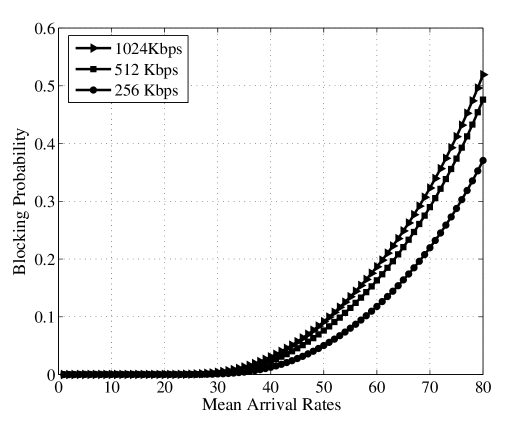
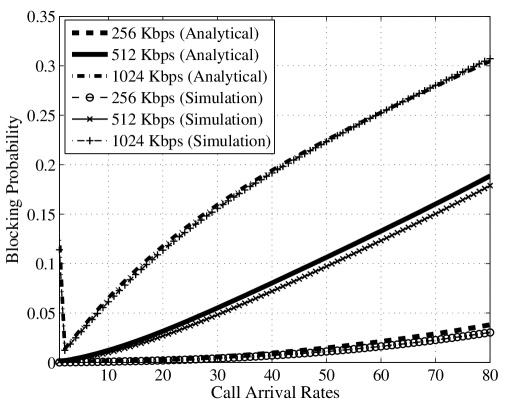
Fig. 7 and Fig. 8 illustrate the impact of rate requirement on blocking probability (evaluated in Eq. 19) for two cases: when the subcarrier bandwidth considered is of KHz and KHz. We observe that increasing the subcarrier
bandwidth results in an increase in the blocking probability. It is because when the subcarrier bandwidth is more,
the total number of subcarriers available in the system reduces. In this case, even though a user may meet
its rate requirement with fewer number of subcarriers, the overall blocking probability is likely to increase. Similar observation can be made from Fig. 9 where the blocking probability is computed for three different subcarrier bandwidth, , and KHz, for fixed rate requirement of Kbps.
From Fig. 7 and Fig. 8, we also observe
that irrespective of the subcarrier bandwidth, the blocking probability is influenced by the rate requirement of users.
As the rate requirement of users increase, they will
require more number of subcarriers and therefore, blocking probability increases. For the simulations, we count the number of times an incoming call is blocked and plot the blocking probability of the system. We observe a good agreement between analytical and simulation results.
As an intuitive insight, when the subcarrier bandwidth is high,
the blocking probability is influenced by the number of users belonging to lower classes and higher classes.
If majority of users belong to lower classes, then the subcarrier bandwidth will result in an allocation which will be much more
than their requirement, leading to an inefficient resource utilization and hence, increase in blocking probability.
On the other hand, if majority of users belong to higher classes,
then they will quench their resource requirement in fewer resources and blocking probability is likely to reduce.
However, in general when the probability that a user belongs to a higher or a lower class (i.e., the subcarrier requirement
of a class is more or less) is equal,
an increase in the subcarrier bandwidth will reduce the
number of resources available in the system and hence there will be an increase in the blocking probability.
VI-B Comparison of Non-Relay System with Relay-based OFDMA System through simulations
Figure 10(a) and 10(b) illustrate the impact of rate requirement on blocking probability for two cases: cellular OFDMA system without and with relays for subcarrier bandwidth of KHz. We observe that the blocking probability in relay based cellular OFDMA system is much lower than the system without relays. We observe that in relay based cellular OFDMA systems, for higher rate requirements such as, Kbps, the blocking probability is reduced by only . However, for lower rate requirements, such as Kbps, the blocking probability reduces by about . This demonstrates that relay deployment decreases the blocking probability and hence improves the capacity. We also observe that there is a close match in the simulation and analytical results in case of relay-based OFDMA system.
We can also observe the impact of arrival rate on the blocking probability in both cases. For lower arrival rate scenario, the blocking probability is higher for the system with relays compared to the system without relays. This happens because a hopped call is blocked when the required number of subcarriers are unavailable on either of the two links, BS-RS and RS-MS. With lower arrival rate, the possibility of having users of all classes is also less. For instance, if there are more users belonging to higher classes, then the probability of hopped call blocking may increase, thereby increasing the overall blocking probability of the system. For higher arrival rate scenario, the distribution of users belonging to different classes is likely to be more uniform. This results in admitting lower class users if the resources are insufficient for a higher class user and thus, blocking probability reduces in a system with relays, for higher arrival rate scenario. Thus, we can infer that a system with relays offers significant reduction in blocking probability compared to a system without relays, for higher arrival rate scenario.
Note that due to delay tolerant characteristic, data calls can be queued (delayed) and can be analyzed in terms of waiting time probability, i.e., the probability that a queued user gets service within the maximum acceptable waiting time. Thus, blocking probability analysis using Erlang loss model can not be applied for data calls.
Following standard queuing theory, it is known that very small blocking probability in Erlang loss model can also achieve small delay in equivalent Erlang delay model. It is due to this fact, analysis for voice calls at higher rates is also applicable for data calls of higher rate services such as, video downloads, video streaming, multimedia conferencing, on-line gaming etc.
In general, blocking probability for voice traffic and waiting time probability for data traffic () are related as follows,
| (41) |
where, is the number of resources (subcarriers) available in the system and is the offered traffic. This implies that the waiting time probability is greater than blocking probability by a factor of . The determination of blocking probability of voice calls for higher data rates may be helpful in the determination of waiting time probability of data calls. Therefore, we have performed the blocking probability analysis of voice calls for rate requirements as , and Kbps.
VII Conclusions and Future Work
In cellular OFDMA networks, in order to meet the same rate requirement, the number of subcarriers
required are different for different users (due to differences in their locations and experienced SIR) on various
links. Therefore traditional methods of blocking probability computation cannot be used directly. We have
proposed an analytical model to evaluate blocking probability for relay based cellular OFDMA networks. The CDF of SIR is
determined to compute the probability distribution of subcarriers required on
the three transmission links. The incoming users are classified into different classes based on their
subcarrier requirement. We have modelled such a system by a multi-dimensional Markov chain.
The effects of subcarrier bandwidth () and rate requirement () on the blocking probability are analyzed. We have also analyzed the effect of rate requirement on the definition of class and number of classes.
We have considered six relays per cell in our system model, with their locations fixed in the cell. However, the optimal location of RSs can impact the system performance in terms of improving cellular coverage or network capacity. One of the author’s work [NCC_Mahima] considers the optimal relay placement problem in the context of maximizing the cellular coverage. The optimal relay positioning to maximize capacity and reduce blocking probability is can be investigated as future work.
Though we do not consider multi-service traffic where each class of users has a different rate requirement, our analysis can be extended to such a scenario.
We have considered uniform distribution of users and partitioned total available subcarriers between BS and RS in somewhat heuristic manner. However practically, there may be non-uniform traffic in relay region and an optimal resource partitioning scheme can be designed.
VIII Acknowledgement
This work is supported by the India-UK Advanced Technology of Centre of Excellence in Next Generation Networks (IU-ATC) project and funded by the Department of Science and Technology (DST), Government of India.
| Symbol | Description |
|---|---|
| SIR experienced by a user while using subcarrier on BS-MS link. | |
| Rate requirement of incoming users | |
| Number of subcarriers required by any user | |
| Subcarrier Bandwidth | |
| Interference to signal ratio on BS-MS link | |
| Number of non-overlapping consecutive intervals into which the is divided | |
| Class of a user | |
| Number of subcarriers required by a user of class | |
| Probability that an incoming user on a direct call belongs to class | |
| Probability that an incoming user on a hopped call belongs to class | |
| Probability that an incoming user on BS-RS link belongs to class | |
| Probability that an incoming user on RS-MS link belongs to class | |
| CDF of interference to signal ratio on BS-MS link | |
| Number of classes of direct calls | |
| Number of classes of hopped calls | |
| Number of subcarriers required by class user of direct call | |
| Total number of subcarriers required by class user of hopped call on both links | |
| Number of subcarriers required by class user of hopped call on BS-RS link | |
| Number of subcarriers required by class user of hopped call on RS-MS link | |
| Number of subcarriers required by class user of direct or hopped call, served by BS | |
| Mean arrival rate of each call | |
| Offered load for class of hopped call | |
| Fraction of calls served directly by BS | |
| Arrival rate of direct calls | |
| Arrival rate of hopped calls | |
| Arrival rate of class of hopped calls | |
| Blocking probability of direct call | |
| Blocking probability of class user at BS | |
| Blocking probability of hopped call | |
| Blocking probability of hopped call on BS-RS link | |
| Blocking probability of hopped call on RS-MS link | |
| Overall blocking probability | |
| State of the system | |
| Number of users in class of direct calls | |
| Number of users in class of hopped calls | |
| Number of users in class of direct or hopped call, served by BS | |
| State of serving RS | |
| State of BS | |
| Set of states in which an incoming hopped call on RS-MS link is blocked | |
| Set of states in which an incoming direct or hopped call at BS is blocked | |
| Probability that the system is in state | |
| Probability that the system is in state |
| Parameters for Numerical Analysis | Value |
|---|---|
| Inter BS distance (meters) | |
| System Bandwidth (MHz) | 10 |
| Subcarrier bandwidth (KHz) | () |
| Number of Subcarriers available at | (when |
| BS | KHz) |
| (when | |
| KHz) | |
| Number of RSs in each reference cell | |
| Number of subcarriers available at | (when |
| each RS | KHz) |
| (when | |
| KHz) | |
| Number of interferring cells from first | |
| tier | |
| Path loss exponent | 3.5 |
| Shadowing standard deviation on | |
| BS-MS link | dB |
| and RS-MS link | |
| Shadowing standard deviation on | |
| BS-RS link | dB |
| Rate requirement of each call (Kbps) | |
| Maximum number of classes for each call | |
| = | () |
| Fraction of calls arriving at BS | 0.5 |
| Mean Arrival Rate (calls/unit time) | 1 to 80 |