Probing the Super Star Cluster Environment of NGC 1569 Using FISICA
Abstract
We present near-IR spectra of the central regions of the dwarf starburst galaxy NGC 1569 using the Florida Image Slicer for Infrared Cosmology and Astrophysics (FISICA). The dust-penetrating properties and available spectral features of the near-IR, combined with the integral field unit (IFU) capability to take spectra of a field, make FISICA an ideal tool for this work. We use the prominent [He i] (1.083m) and Pa (1.282 m) lines to probe the dense star forming regions as well as characterize the general star forming environment around the super star clusters (SSCs) in NGC 1569. We find [He i] coincident with CO clouds to the north and west of the SSCs, which provides the first, conclusive evidence for embedded star clusters here.
keywords:
galaxies: active — galaxies: dwarf — galaxies: star clusters infrared: galaxies1 Introduction
NGC 1569 is a nearby, 2.2 Mpc (Israel & van Driel, 1990), dwarf starburst galaxy. Its centre contains two, prominent super star clusters (SSCs), designated “A” and “B” by de Vaucouleurs et al. (1974). Originally thought to be foreground stars (Ables, 1971), later spectroscopic studies concluded that they are star clusters associated with NGC 1569 (cf. Prada, 1994). Hunter et al. (2000) performed a high-resolution, HST optical study of the stellar populations around the SSCs. They fit ages of 7 Myr for A and 10–20 Myr for B.
This galaxy has undergone star formation for almost a complete Hubble time, containing clusters spanning ages from 4 Myr to 10 Gyr (Aloisi et al., 2001; Anders et al., 2004; Hunter et al., 2000). Waller (1991) suggests this system underwent six starbursts in its history. Hunter et al. (2000) find most clusters are 30 Myr, indicating most cluster formation occurred at the end of the last starburst episode. Pasquali et al. (2011) point out that each consecutive starburst has a shorter duration and a higher star formation rate. Radio observations show a 200 pc diameter hole in the gas distribution around the SSC A (Israel & van Driel, 1990; Aloisi et al., 2001). This indicates a lack of star formation in this region around the SSCs. This inner region is also highly disturbed (Westmoquette et al., 2007b) and lacks supernova remnants (SNRs) (Greve et al., 2002). Furthermore, the more massive clusters formed at earlier times, while at later times, only less massive clusters formed (Anders et al., 2004). Anders et al. (2004) attribute this to the strong, cluster winds of the massive clusters, which prevented large molecular clouds from forming.
Star formation may still be occurring in a region to the north (Westmoquette et al., 2007b; Tokura et al., 2006), near cluster 30 as designated by Hunter et al. (2000) and to the north west, around cluster 10 (Hunter et al., 2000). The north west region is quite remarkable. It is dominated by cluster 10, designation from Hunter et al. (2000), which was initially thought to be another SSC (Prada, 1994), but later evidence suggests it is a less massive cluster (Westmoquette et al., 2007a; Buckalew et al., 2000). This region itself contains many clusters, with ages of 25 Myr (Anders et al., 2004). Just south of 10 lies an H ii region (Buckalew et al., 2000) and to it’s west extends a giant molecular cloud (Taylor et al., 1999). Using mid-IR observations, Tokura et al. (2006) find possible evidence for an embedded cluster here, which could substantiate evidence that star formation is progressing to the west (Greve et al., 2002). Pasquali et al. (2011) find that the dust extinction is higher in the NW than in the SE.
In this article we use the Florida Image Slicer for Infrared Cosmology and Astrophysics (FISICA), a near-IR image-slicing integral field unit (IFU), to observe the environment around the SSCs and cluster 10. Near-IR wavelengths are particularly useful as they contain the [He i] line at 1.083 m and the Pa line at 1.282 m, both of which are diagnostic spectral features of massive stars and star formation. In addition, the dust-penetrating properties of IR wavelengths allows us to probe dense regions hidden at other wavelengths.
Our goal in this work is to search for more evidence of massive star formation in the embedded regions around the SSCs as well as complement previous work by adding to the understanding of this complex environment. We present our work in the following manner: §2 outlines our observation method and analysis of the data, §3 presents a discussion of our results, comparing in detail to past work on this galaxy, and we summarize our findings in §4.
2 Observations and Data Analysis
On October 20, 2004, we acquired spectra of NGC 1569 using FISICA on the KPNO 4-m telescope. We took five consecutive 300 s exposures, producing a total on-source exposure of 25 min. Due to the extended nature of our target, we moved off-source by 95 arcsec to the SW to measure the sky background.
FISICA (Eikenberry et al., 2006) has a field-of-view (FOV) of 16 by 33 arcsec at f/15. The IFU divides the field into 22 strips 0.7 arcsec wide by 33 arcsec long. These strips are rearranged in a line and sent as a pseudo-longslit through the Florida Multi-object Imaging Near-IR Grism Observational Spectrometer (FLAMINGOS) spectrograph. All 22 spectra are imaged on the FLAMINGOS, 2K2K HgCdTe detector, and each has a resolution of R 1300.
We reduced these observations using the data pipeline, Florida Analysis Tool Born Of Yearning for high quality scientific data (fatboy). fatboy (C. Warner, et al. 2012, in preparation) calibrates each spectral frame using flat fields and dark frames and corrects for cosmic rays, and bad pixels. All spectra are rectified and all spectral lines are aligned using skylines. We did not need to worry about image distortion as a function of wavelength, because spatial information is preserved for IFUs that use mirrors.
A useful tool for analyzing IFU data is a data cube. To make the data cube, we used a self-written Python program. The main difference between a standard image is each pixel has spectral information. By this information in the direction, we produced a data cube for the FISICA field of NGC 1569. To ensure Nyquist sampling, the image of each slice is spread across two pixels. Considering we had a seeing of 3.0 pixels, we are Nyquist sampling the Airy disk and this is appropriate. Therefore, the reproduced image of the field will be foreshortened by a half in the direction. Artificially spreading the flux from each slice across a width of two pixels, we produced an image with the correct aspect ratio, having pixels with dimensions of 0.3 arcsec. More specifically, we measured the centroid in flux along each slice. From this, we measured the fractional flux for either half of the slice. This fractional flux was then placed in each of the two pixels for the newly binned slice.
2.1 Spectral Maps
When we initially examined the spectra, we immediately noticed a prominent [He i] line in many of the slices. This type of emission is often associated with massive stars and star formation. Considering the importance of this emission, we decided to explore its extent and relation to the SSCs in NGC 1569.
An easy way to address this query is to make a continuum-subtracted [He i] map. Before making this map, we needed to measure the width of the [He i] line and determine the wavelength range that would include this emission. First, we summed up all spectra from all slices, producing a single spectrum for the entire IFU frame. Fitting a sixth order, Gaussian function to the [He i] line, we measured the full width at half maximum (FWHM) and found a value of FWHM = 10.2 Å. We defined an ’extraction width’, = 12.8 Å (3 of the Gaussian fit). After summing up all [He i] emission within of the [He i] line centre for each slice, we recombined the slices, producing a [He i] map. We repeated this procedure for two continuum regions on either side of the [He i] line, also sampling within of each position, producing a pair of continuum maps. Averaging the continuum maps, we produced a master, averaged-continuum map. Subtracting this from the [He i] map, we made the continuum-subtracted [He i] map.
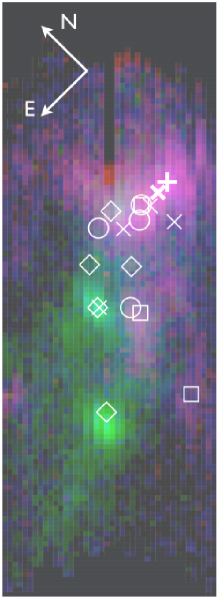
The continuum-subtracted [He i] map clearly shows an abundance of [He i] at the top, near the set of bright clusters, but this emission all but disappears for the two SSCs at the middle and bottom of the frame (see Fig. 1).
A second prominent line apparent in the spectrum is Pa (1.282 m). Like [He i], Pa is a signature of young, massive stars, making it a useful diagnostic for star formation in NGC 1569. Therefore, we also produced a continuum-subtracted map for this line as well. Following the same procedure outlined above for [He i], we stacked all spectra on the frame and fit a sixth order Gaussian function to the Pa line. Measuring a FWHM of 11.3 Å, we defined = 14.1 Å(3 of the Gaussian fit), extracted all Pa emission and produced a Pa map. Selecting continuum positions on either side of the Pa line, we extracted continuum emission using , where is the same size as that used for the Pa map. Recombining these continuum regions and averaging, we produced an averaged-continuum map. Finally, subtracting the averaged-continuum map from the Pa map left us with a continuum-subtracted Pa map.
| Region A | Region B | Region C | Region D | |
|---|---|---|---|---|
| (SSC A) | (SSC B) | (Cluster 10 Region) | ([He i] Pk.) | |
| [He i][He i]tot | 3.3610-4 | 1.0310-4 | 1.3610-3 | 1.79 10-3 |
| 2.6010-5 | 2.2110-5 | 3.3310-5 | 6.1910-5 | |
| Pa/Pa | 2.2710-4 | 1.3110-4 | 1.1310-3 | 1.5810-3 |
| 8.9810-6 | 5.4410-6 | 5.6610-5 | 1.1910-4 | |
| Cont.Cont.tot | 2.4310-3 | 3.0410-3 | 1.2110-3 | 4.8210-4 |
| 3.2210-4 | 4.8410-4 | 4.0610-5 | 2.8110-5 | |
| EW | 0.48 | 0.13 | 4.00 | 18.33 |
| 0.34 | 0.18 | 1.08 | 7.87 |
All ratios and EW are unit less. Uncertainties are listed below each flux ratio and EW measurement.
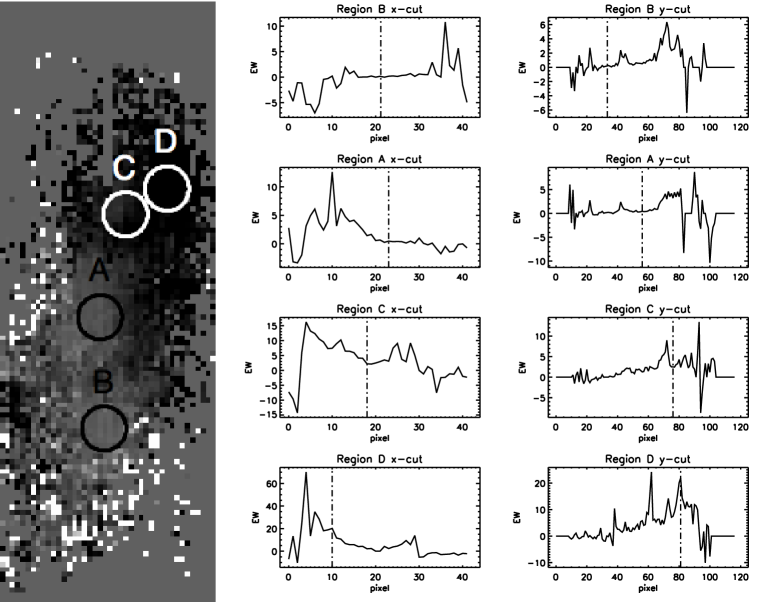
Before continuing, we performed a more quantitative analysis to address how much stronger, or weaker, the [He i] emission is compared to the continuum for specific regions in the map. We chose regions with a noticeable difference in emission; specifically the two SSCs, A (centre; region ’A’) and B (bottom; region ’B’), the region around cluster 10 (region ’C’) and the prominent [HeI] emission region to it’s west, right, (region ’D’) (see Fig. 2 and Fig. 3). Placing apertures over each region, we measured the total [He i] flux in each aperture. We defined the aperture radius as 4.3 pixels, which is twice the FWHM of the Gaussian point-spread-function of the SSCs. This choice in aperture size was sufficient to encompass each SSC without a substantial contribution from background sources. Dividing the fluxes by the total flux for the entire [He i] continuum-subtracted map, gave us the fraction of [He i] emission each region contributes to the IFU frame (see Table 1). Repeating this process with the same-sized apertures for the averaged-continuum map gave us the fraction of continuum emission each region contributes to the IFU frame (see Table 1). Notice the increase in intensity of [He i] flux from bottom-to-top, region ’B’ to ’A’ to ’C’ to ’D’, while the opposite effect is seen for the continuum flux.
Repeating the same quantitative analysis on the Pa map that we performed on the [He i] map, we computed the flux ratio in Pa flux for regions A, B, C and D to total Pa flux for the image. Lastly, using both continuum-subtracted maps, [He i] and Pa, plus an averaged continuum map, we produced a false colour image, high-lighting the various emission regions (Fig. 1).
We obtained further information on the central parts of NGC 1569 by making an equivalent width (EW) map. This is simply the [He i] continuum-subtracted map divided by the averaged-continuum map. Examining this EW map shown in Fig. 2, shows a region of large EW in the NW as well as a second peak to the north of cluster A. The highest EW is in the NW region and has a value of 64 (See Fig. 2). The peak in EW to the north is about a factor of ten lower in EW. Also, notice the much lower EW at the positions of the two SSCs. Next to the EW map we show plots of vertical and horizontal cuts through the centre of each region. Each cut is the median average of 2 pixels from the line.
2.2 Spectra
In addition to spectral maps, we also made spectra from the four regions A, B, C and D defined in §2.1 (see Fig. 3). These spectra were taken from the centre of each region and were produced by median combining the spectra 2 pixels from the centre in the -direction. Notice that the spectra for SSC B (Region B) is dominated by the continuum, while the spectra for the [He i] peak (Region D) is dominated by the emission lines [He i] and Pa.

3 Discussion
Thus far we have presented a description of the [He i] and Pa emission in the central regions of NGC 1569. We now proceed by comparing our observations to other studies at a variety of wavelengths to try to increase understanding of this complex region.
As mentioned above, there is a distinct lack of both [He i] and Pa emission present in both SSCs. While SSC A may contain trace amounts of these emission lines, SSC B is clearly devoid of any emission at these wavelengths. He ii observations also show a similar trend in emission properties (Buckalew et al., 2000). These observations are in agreement with H I observations, which indicate a 200 pc hole in the H I distribution, centered on SSC A (Israel & van Driel, 1990; Stil & Israel, 1998; Aloisi et al., 2001). This suggests that star formation has ceased in the inner regions of NGC 1569 (Aloisi et al., 2001). A detailed optical study of the stellar populations in these clusters indicates A contains luminous blue variables (LBVs), while B is dominated by red supergiants (Hunter et al., 2000). Thus the [He i] emission is most likely from the hot, blue stars in A, while the more evolved, massive stars in B explains why we do not see any emission in this cluster.
To the north of SSC B lies a small clump of [He i] and Pa emission. This region exhibits a relatively large equivalent width compared to the field, peaking at 23. It is south of cluster 30, as designated by Hunter et al. (2000), which is off our field. As seen in Fig. 1, there is no continuum emission, which is consistent with -band images, where it is only faintly detected (Hunter et al., 2000), as well as recent optical IFU observations (Westmoquette et al., 2007b). This contrasts with narrow-band [O iii] and H images which show prominent emission here (Buckalew & Kobulnicky, 2006). There is also a non-thermal radio source at this position (Greve et al., 2002). Furthermore, CO emission is observed at this location (Taylor et al., 1999), possibly indicating this source is an embedded, young star cluster, as suggested by Westmoquette et al. (2007b). In their detailed study of this area, Westmoquette et al. (2007b) were not able to detect any stellar signatures. Thus, our detection of [He i] is the first proof that this source is a young cluster forming from a blister in an expanding bubble of gas (Westmoquette et al., 2007b).
Just south of SSC A appears another region of emission. It is most prominent in [He i], but also seen in Pa and continuum. This source is a known H ii region (Waller, 1991) and is also seen in [O iii] images (Buckalew & Kobulnicky, 2006). In Westmoquette et al. (2007b), there is evidence for an unusual clump with a high velocity and large line widths. These authors suggest this clump lies along our sight-line and is not necessarily connected with the central regions of the galaxy. In our equivalent width map, we do not see evidence for large line widths here, but then we lack the spatial resolution of GMOS.
One of the most intriguing parts of NGC 1569 sits NW of SSC A, where star formation still appears to be going on. Optical images show an abundance of star clusters and bright stars here (Hunter et al., 2000; Anders et al., 2004). Many of the clusters in this region have ages of 25 Myr (Anders et al., 2004). The region is dominated by cluster 10 as designated by Hunter et al. (2000). Narrow-band, He ii observations show emission coincident with the cluster, and the authors hypothesize this emission is due to three WNL stars or is nebular in origin (Buckalew et al., 2000). Recent, optical luminosity measurements of cluster 10 confirm that massive stars are the best explanation for this emission (Westmoquette et al., 2007a). Westmoquette et al. (2007a) acquired HST images of this cluster and show that it is actually two clusters, 10A and 10B. Using photometry, they estimate 10A is between 5-7 Myr, while 10B is 5 Myr. In addition, cluster 6 (as designated by Hunter et al. (2000)) also has a young age, 4 Myr (Anders et al., 2004). These cluster ages indicate a younger population of clusters here. Furthermore, Pasquali et al. (2011) find evidence for a higher star formation rate in the NW.
South of cluster 10, and on the edge of this large [He i] complex, sits the H ii region identified by Waller (1991). This nebular region is coincident with [O iii] (Buckalew & Kobulnicky, 2006) and [S iv ] (Tokura et al., 2006) emission. It also sits perched on the edge of a giant molecular cloud (GMC) seen in CO observations (Taylor et al., 1999).
Progressing farther south we find the strongest peak in both [He i] and Pa. The Pa peak is offset to the north of the [He i] peak by 0.6 arcsec (see Fig. 1). Considering the average shifts in the image slices used to create the reconstructed image is 0.30.8 arcsec, we can not reliably differentiate the positions of the [He i] and Pa peaks.
Interestingly, the [He i] peak corresponds with the brightest mid-IR, [S iv] peak observed by Tokura et al. (2006). These authors suggest this is an embedded cluster consisting of 40 O7 stars. Our observations of coincident [He i] emission seems to confirm their finding and is the first conclusive evidence that a cluster is forming here. Furthermore, comparing the location of the [He i] and [S iv] peaks to CO maps presented in (Taylor et al., 1999), suggest this cluster is buried in the GMC that extends to the southwest.
This discussion demonstrates how newly formed star clusters provoke the continued formation of star clusters in the local environment of NGC 1569. Anders et al. (2004) mention that star formation is occurring along bubble walls, indicating self-propagating star formation, which is discussed by several authors. Buckalew & Kobulnicky (2006) find that the surface density of H ii regions remains constant with in annuli as the annuli are moved away from the center. They suggest this indicates feedback effects are confined to the center of the galaxy on scales of 1 pc. Westmoquette et al. (2007b) use HST observations to show the cometary appearance of molecular clouds, indicating the effects of stellar winds from the inner clusters. Lastly, Pasquali et al. (2011) find that line ratios of [Fe ii] 1.64m / Br are highest at the edge of gas-filled cavities and in the outskirts of the galaxy. This indicates the average between past and on-going star formation. In addition, it indicates that star formation has been quenched in the interior and more recently, triggered in a ring around the cavities 4 Myr ago, after the SSCs formed. Our observations of [He i] coincident with CO clouds provide evidence for embedded clusters that were triggered to form by cluster winds near the CO clouds.
4 Conclusions
Our observations of clumped [He i] emission to the N of SSC A and in the NW provide the first, conclusive evidence of newly forming star clusters here. Combining our observations, with additional, multi-wavelength data, we discussed a scenario of the on-going star formation in this galaxy.
Acknowledgments
DMC and SSE were supported in part by a NSF award (NSF-0507547) for this work. RG and NG acknowledge funding from NASA-LTSA grant NAG5-11635. Additional support for DMC was provided by a UNAM postdoctoral fellowship. FISICA was funded by the UCF-UF Space Research Initiative.
References
- Ables (1971) Ables, H.D., 1971, Publ. U.S. Naval Obs. XX, Part IV, p.60
- Aloisi et al. (2001) Aloisi, A., et al. 2001, AJ, 121, 1425
- Anders et al. (2004) Anders, P., de Grijs, R., Fritze-v. Alvensleben, U., & Bissantz, N. 2004, MNRAS, 347, 17
- Bisbas et al. (2011) Bisbas, T. G., Wünsch, R., Whitworth, A. P., Hubber, D. A., & Walch, S. 2011, ApJ, 736, 142
- Brand et al. (2011) Brand, J., Massi, F., Zavagno, A., Deharveng, L., & Lefloch, B. 2011,A&A, 527, A62
- Buckalew et al. (2000) Buckalew, B.A., Dufour, R.J., Shopbell, P.L., & Walter, D.K. 2000, AJ, 120, 2402
- Buckalew & Kobulnicky (2006) Buckalew, B.A. & Kobulnicky, H.A. 2006, AJ, 132, 1061
- Eikenberry et al. (2006) Eikenberry, S., et al. 2006, ProcSPIE, 6269, 146
- de Vaucouleurs et al. (1974) de Vaucouleurs G., de Vaucouleurs A., Pence W., 1974, ApJ, 194, L119
- Greve et al. (1996) Greve, A., Becker, R., Johansson, L.E.B., & McKeith, C.D. 1996, A&A, 312, 391
- Greve et al. (2002) Greve, A., Tarchi, A., Huttemeister, S., De Grijs, R., Van Der Hulst, J.M., Garrington, S., & Neininger, N. 2002, A&A, 381, 825
- Hunter et al. (2000) Hunter, D., O’Connell, R.W., Gallagher, J.S., & Smecker-Hane, T.A. 2000, AJ, 120, 2383
- Israel & van Driel (1990) Israel, F.P. & Van Driel, W. 1990, A&A, 236, 323.
- Koenig et al. (2012) Koenig, X. P., Leisawitz, D. T., Benford, D. J., et al. 2012, ApJ, 744, 130
- Lisenfeld et al. (2005) Lisenfeld, U., Israel, F. P., Stil, J. M., Sievers, A., & Haas, M. 2005, The Spectral Energy Distributions of Gas-Rich Galaxies: Confronting Models with Data, 761, 239
- Pasquali et al. (2011) Pasquali, A., et al. 2011, AJ, 141, 132
- Prada (1994) Prada, F., Greve, A., & McKeith C.D. 1994, A&A, 288, 396
- Stil & Israel (1998) Stil, J. M., & Israel, F. P. 1998, A&A, 337, 64
- Taylor et al. (1999) Taylor, C.L., Huttemeister, S., Klein, U., & Greve, A. 1999, A&A, 349, 424
- Tokura et al. (2006) Tokura, D., et al. 2006, ApJ, 648, 355
- Waller (1991) Waller, W.H. 1991, ApJ, 370, 144
- Westmoquette et al. (2007a) Westmoquette, M. S., Exter, K. M., Smith, L. J., & Gallagher, J. S. 2007a, MNRAS, 381, 894
- Westmoquette et al. (2007b) Westmoquette, M. S., Smith, L. J., Gallagher, J. S., & Exter, K. M. 2007b, MNRAS, 381, 913