Precision measurements of branching fractions for and
M. Ablikim1, M. N. Achasov5, O. Albayrak3, D. J. Ambrose39, F. F. An1, Q. An40, J. Z. Bai1, Y. Ban27, J. Becker2, J. V. Bennett17, M. Bertani18A, J. M. Bian38, E. Boger20,a, O. Bondarenko21, I. Boyko20, R. A. Briere3, V. Bytev20, X. Cai1, O. Cakir35A, A. Calcaterra18A, G. F. Cao1, S. A. Cetin35B, J. F. Chang1, G. Chelkov20,a, G. Chen1, H. S. Chen1, J. C. Chen1, M. L. Chen1, S. J. Chen25, X. Chen27, Y. B. Chen1, H. P. Cheng14, Y. P. Chu1, F. Coccetti18A, D. Cronin-Hennessy38, H. L. Dai1, J. P. Dai1, D. Dedovich20, Z. Y. Deng1, A. Denig19, I. Denysenko20,b, M. Destefanis43A,43C, W. M. Ding29, Y. Ding23, L. Y. Dong1, M. Y. Dong1, S. X. Du46, J. Fang1, S. S. Fang1, L. Fava43B,43C, F. Feldbauer2, C. Q. Feng40, R. B. Ferroli18A, C. D. Fu1, J. L. Fu25, Y. Gao34, C. Geng40, K. Goetzen7, W. X. Gong1, W. Gradl19, M. Greco43A,43C, M. H. Gu1, Y. T. Gu9, Y. H. Guan6, A. Q. Guo26, L. B. Guo24, Y. P. Guo26, Y. L. Han1, F. A. Harris37, K. L. He1, M. He1, Z. Y. He26, T. Held2, Y. K. Heng1, Z. L. Hou1, H. M. Hu1, J. F. Hu36, T. Hu1, G. M. Huang15, G. S. Huang40, J. S. Huang12, X. T. Huang29, Y. P. Huang1, T. Hussain42, C. S. Ji40, Q. Ji1, Q. P. Ji26,c, X. B. Ji1, X. L. Ji1, L. L. Jiang1, X. S. Jiang1, J. B. Jiao29, Z. Jiao14, D. P. Jin1, S. Jin1, F. F. Jing34, N. Kalantar-Nayestanaki21, M. Kavatsyuk21, M. Kornicer37, W. Kuehn36, W. Lai1, J. S. Lange36, C. H. Li1, Cheng Li40, Cui Li40, D. M. Li46, F. Li1, G. Li1, H. B. Li1, J. C. Li1, K. Li10, Lei Li1, Q. J. Li1, S. L. Li1, W. D. Li1, W. G. Li1, X. L. Li29, X. N. Li1, X. Q. Li26, X. R. Li28, Z. B. Li33, H. Liang40, Y. F. Liang31, Y. T. Liang36, G. R. Liao34, X. T. Liao1, B. J. Liu1, C. L. Liu3, C. X. Liu1, C. Y. Liu1, F. H. Liu30, Fang Liu1, Feng Liu15, H. Liu1, H. H. Liu13, H. M. Liu1, H. W. Liu1, J. P. Liu44, K. Y. Liu23, Kai Liu6, P. L. Liu29, Q. Liu6, S. B. Liu40, X. Liu22, Y. B. Liu26, Z. A. Liu1, Zhiqiang Liu1, Zhiqing Liu1, H. Loehner21, G. R. Lu12, H. J. Lu14, J. G. Lu1, Q. W. Lu30, X. R. Lu6, Y. P. Lu1, C. L. Luo24, M. X. Luo45, T. Luo37, X. L. Luo1, M. Lv1, C. L. Ma6, F. C. Ma23, H. L. Ma1, Q. M. Ma1, S. Ma1, T. Ma1, X. Y. Ma1, Y. Ma11, F. E. Maas11, M. Maggiora43A,43C, Q. A. Malik42, Y. J. Mao27, Z. P. Mao1, J. G. Messchendorp21, J. Min1, T. J. Min1, R. E. Mitchell17, X. H. Mo1, C. Morales Morales11, C. Motzko2, N. Yu. Muchnoi5, H. Muramatsu39, Y. Nefedov20, C. Nicholson6, I. B. Nikolaev5, Z. Ning1, S. L. Olsen28, Q. Ouyang1, S. Pacetti18B, J. W. Park28, M. Pelizaeus2, H. P. Peng40, K. Peters7, J. L. Ping24, R. G. Ping1, R. Poling38, E. Prencipe19, M. Qi25, S. Qian1, C. F. Qiao6, X. S. Qin1, Y. Qin27, Z. H. Qin1, J. F. Qiu1, K. H. Rashid42, G. Rong1, X. D. Ruan9, A. Sarantsev20,d, B. D. Schaefer17, J. Schulze2, M. Shao40, C. P. Shen37,e, X. Y. Shen1, H. Y. Sheng1, M. R. Shepherd17, X. Y. Song1, S. Spataro43A,43C, B. Spruck36, D. H. Sun1, G. X. Sun1, J. F. Sun12, S. S. Sun1, Y. J. Sun40, Y. Z. Sun1, Z. J. Sun1, Z. T. Sun40, C. J. Tang31, X. Tang1, I. Tapan35C, E. H. Thorndike39, D. Toth38, M. Ullrich36, G. S. Varner37, B. Wang9, B. Q. Wang27, D. Wang27, D. Y. Wang27, K. Wang1, L. L. Wang1, L. S. Wang1, M. Wang29, P. Wang1, P. L. Wang1, Q. Wang1, Q. J. Wang1, S. G. Wang27, X. L. Wang40, Y. D. Wang40, Y. F. Wang1, Y. Q. Wang29, Z. Wang1, Z. G. Wang1, Z. Y. Wang1, D. H. Wei8, J. B. Wei27, P. Weidenkaff19, Q. G. Wen40, S. P. Wen1, M. Werner36, U. Wiedner2, L. H. Wu1, N. Wu1, S. X. Wu40, W. Wu26, Z. Wu1, L. G. Xia34, Z. J. Xiao24, Y. G. Xie1, Q. L. Xiu1, G. F. Xu1, G. M. Xu27, H. Xu1, Q. J. Xu10, X. P. Xu32, Z. R. Xu40, F. Xue15, Z. Xue1, L. Yan40, W. B. Yan40, Y. H. Yan16, H. X. Yang1, Y. Yang15, Y. X. Yang8, H. Ye1, M. Ye1, M. H. Ye4, B. X. Yu1, C. X. Yu26, H. W. Yu27, J. S. Yu22, S. P. Yu29, C. Z. Yuan1, Y. Yuan1, A. A. Zafar42, A. Zallo18A, Y. Zeng16, B. X. Zhang1, B. Y. Zhang1, C. Zhang25, C. C. Zhang1, D. H. Zhang1, H. H. Zhang33, H. Y. Zhang1, J. Q. Zhang1, J. W. Zhang1, J. Y. Zhang1, J. Z. Zhang1, S. H. Zhang1, X. J. Zhang1, X. Y. Zhang29, Y. Zhang1, Y. H. Zhang1, Y. S. Zhang9, Z. P. Zhang40, Z. Y. Zhang44, G. Zhao1, H. S. Zhao1, J. W. Zhao1, K. X. Zhao24, Lei Zhao40, Ling Zhao1, M. G. Zhao26, Q. Zhao1, Q. Z. Zhao9,f, S. J. Zhao46, T. C. Zhao1, X. H. Zhao25, Y. B. Zhao1, Z. G. Zhao40, A. Zhemchugov20,a, B. Zheng41, J. P. Zheng1, Y. H. Zheng6, B. Zhong24, J. Zhong2, Z. Zhong9,f, L. Zhou1, X. K. Zhou6, X. R. Zhou40, C. Zhu1, K. Zhu1, K. J. Zhu1, S. H. Zhu1, X. L. Zhu34, Y. C. Zhu40, Y. M. Zhu26, Y. S. Zhu1, Z. A. Zhu1, J. Zhuang1, B. S. Zou1, J. H. Zou1
(BESIII Collaboration)
1 Institute of High Energy Physics, Beijing 100049, P. R. China
2 Bochum Ruhr-University, 44780 Bochum, Germany
3 Carnegie Mellon University, Pittsburgh, PA 15213, USA
4 China Center of Advanced Science and Technology, Beijing 100190, P. R. China
5 G.I. Budker Institute of Nuclear Physics SB RAS (BINP), Novosibirsk 630090, Russia
6 Graduate University of Chinese Academy of Sciences, Beijing 100049, P. R. China
7 GSI Helmholtzcentre for Heavy Ion Research GmbH, D-64291 Darmstadt, Germany
8 Guangxi Normal University, Guilin 541004, P. R. China
9 GuangXi University, Nanning 530004,P.R.China
10 Hangzhou Normal University, Hangzhou 310036, P. R. China
11 Helmholtz Institute Mainz, J.J. Becherweg 45,D 55099 Mainz,Germany
12 Henan Normal University, Xinxiang 453007, P. R. China
13 Henan University of Science and Technology, Luoyang 471003, P. R. China
14 Huangshan College, Huangshan 245000, P. R. China
15 Huazhong Normal University, Wuhan 430079, P. R. China
16 Hunan University, Changsha 410082, P. R. China
17 Indiana University, Bloomington, Indiana 47405, USA
18 (A)INFN Laboratori Nazionali di Frascati, Frascati, Italy; (B)INFN and University of Perugia, I-06100, Perugia, Italy
19 Johannes Gutenberg University of Mainz, Johann-Joachim-Becher-Weg 45, 55099 Mainz, Germany
20 Joint Institute for Nuclear Research, 141980 Dubna, Russia
21 KVI/University of Groningen, 9747 AA Groningen, The Netherlands
22 Lanzhou University, Lanzhou 730000, P. R. China
23 Liaoning University, Shenyang 110036, P. R. China
24 Nanjing Normal University, Nanjing 210046, P. R. China
25 Nanjing University, Nanjing 210093, P. R. China
26 Nankai University, Tianjin 300071, P. R. China
27 Peking University, Beijing 100871, P. R. China
28 Seoul National University, Seoul, 151-747 Korea
29 Shandong University, Jinan 250100, P. R. China
30 Shanxi University, Taiyuan 030006, P. R. China
31 Sichuan University, Chengdu 610064, P. R. China
32 Soochow University, Suzhou 215006, China
33 Sun Yat-Sen University, Guangzhou 510275, P. R. China
34 Tsinghua University, Beijing 100084, P. R. China
35 (A)Ankara University, Ankara, Turkey; (B)Dogus University, Istanbul, Turkey; (C)Uludag University, Bursa, Turkey
36 Universitaet Giessen, 35392 Giessen, Germany
37 University of Hawaii, Honolulu, Hawaii 96822, USA
38 University of Minnesota, Minneapolis, MN 55455, USA
39 University of Rochester, Rochester, New York 14627, USA
40 University of Science and Technology of China, Hefei 230026, P. R. China
41 University of South China, Hengyang 421001, P. R. China
42 University of the Punjab, Lahore-54590, Pakistan
43 (A)University of Turin, Turin, Italy; (B)University of Eastern Piedmont, Alessandria, Italy; (C)INFN, Turin, Italy
44 Wuhan University, Wuhan 430072, P. R. China
45 Zhejiang University, Hangzhou 310027, P. R. China
46 Zhengzhou University, Zhengzhou 450001, P. R. China
a also at the Moscow Institute of Physics and Technology, Moscow, Russia
b on leave from the Bogolyubov Institute for Theoretical Physics, Kiev, Ukraine
c Nankai University, Tianjin,300071,China
d also at the PNPI, Gatchina, Russia
e now at Nagoya University, Nagoya, Japan
f Guangxi University,Nanning,530004,China
Abstract
We present a precision study of the
and decay modes. The measurements are obtained using events accumulated with the BESIII detector at
the BEPCII collider operating at a center-of-mass energy corresponding to the mass.
We obtain and
.
The branching fraction ratio is determined to be . The precision of these measurements of
and represent a significant improvement over previously published values.
pacs:
13.25.Gv, 13.20.Gd
I INTRODUCTION
The study of the hadronic transitions between charmonium states has been an active field both for experimental and
theoretical research. The decays and were first observed thirty years ago, and improved measurements of the corresponding branching fractions were performed by the BESII bes2 and CLEO cleo1
collaborations. These decays are important probes of decay mechanisms that are characterized by the emission of a soft hadron. The QCD multipole-expansion (QCDME) technique was developed for applications to these heavy quarkonium system processes. For this, the measured branching
fraction for can be used to predict the transition rate between states kuangyp .
The branching-fraction ratio, , with denoting the individual branching fraction, was
suggested as a reliable way to measure the light-quark mass ratio getqarkmass .
Based on QCDME and the axial anomaly, the ratio is calculated to be with the conventionally accepted values of the quark masses
, and miller . Previously published measurements of this ratio give a significantly
larger value of pdg . Recently, using chiral-perturbation
theory, the Jülich group investigated the source of charmed-meson loops in these decays as a possible explanation for this discrepancy Feng-kunGuo:2009 .
Under the assumption that the charmed-meson loop mechanism saturates the decay widths, they obtained
a value , which indicates that the charmed-meson loop mechanism can play an important role in explaining the data. With parameters introduced into the
charmed-meson loop fixed using
as input, the hadron-loop contribution to
the isospin violation decay can be
evaluated Guo:2012tj ; Guo:2010ak . Measurements of these
branching fractions can provide experimental evidence for hadron-loop contributions in charmonim decays, and impose more stringent constraints on charmed-meson loop contributions. It will also help clarify the influence of long-distance
effects in other charmonium decays, e.g.Zhang:2009kr ; Guo:2012tj ,
and Li:2011ssa .
This paper presents the most precise measurement of the ratio and the related branching fractions for and .
II BESIII EXPERIMENT AND DATA SET
The BESIII experiment at the BEPCII NIM1 electron-positron collider is an upgrade of BESII/BEPC besii . The BESIII detector is designed to study hadron
spectroscopy and -charm physics besphysics . The
cylindrical BESIII spectrometer is composed of a Helium gas-based drift chamber
(MDC), a Time-Of-Flight (TOF) system, a CsI(Tl) Electromagnetic
Calorimeter (EMC) and a RPC-based muon identifier with a super-conducting
magnet that provides a 1.0 T magnetic field. The nominal detector acceptance is 93% of
. The expected charged-particle momentum resolution and photon
energy resolution are 0.5% and 2.5% at 1 GeV, respectively. The
photon energy resolution at BESIII is much better than that
of BESII and comparable to that achieved by CLEO cleo and the
Crystal Ball crysball . An accurate measurement of photon
energies enables the BESIII experiment to study physics involving
photons, and mesons with high precision.
We use a data sample of (106.410.86)106 decays npsip , corresponding to an integrated luminosity of
156.4 pb-1. In addition, a 43 pb-1 data sample collected at 3.65 GeV is used for QED background studies.
To optimize the event selection criteria and to estimate the
background, a geant4-based simulation boost is used that includes the geometries and
material of the BESIII detector components. An inclusive decay Monte Carlo (MC) sample is generated to study backgrounds. The generation of resonance production is simulated with
the MC event generator kkmckkmc , while
decays are generated with besevtgenevtgen for known decay
modes with branching fractions set to the
world average values pdg , and with lundcharmlundcharm for the
remaining unknown decays. The analysis is performed in
the framework of the BESIII offline software system boss
which handles the detector calibration, event reconstruction
and data storage.
III EVENT SELECTION
Selection criteria described below are similar to those used in previous BES analyses chicj2vv ; chicj2gv . Candidate and mesons are reconstructed using two photons , and the is reconstructed from lepton pairs ( or ).
Photon candidates are reconstructed by clustering
EMC crystal energies. The energy deposited in nearby
TOF counters is included to improve the reconstruction
efficiency and the energy resolution. Showers identified as
photon candidates must satisfy fiducial and shower-quality
requirements. A minimum energy of 25 MeV is required for barrel showers () and 50 MeV for endcap
showers (). Showers in the angular range between the barrel and endcap
are poorly reconstructed and excluded from the analysis.
To exclude showers generated by charged particles, a photon
is required to be separated by at least from the nearest charged track.
EMC-cluster timing requirements are used to suppress
electronic noise and energy deposits unrelated to the event. The number of photons, , is required to be .
Charged tracks are reconstructed from hit patterns in the MDC. The number of charged tracks is required to be two with zero net charge. For each track, the polar angle must satisfy
, and the track is required to originate from within cm of the interaction point in the beam direction and within cm of the beam line in the plane perpendicular to the beam. The candidates are reconstructed from pairs of oppositely charged tracks.
Tracks are identified as muons (electrons) if their ratios satisfy (), where and are the
deposited energy in the EMC and the momentum of the charged track, respectively.
To reduce the combinatorial background from uncorrelated combinations and to improve the mass resolution, a four-constraint kinematic fit (4C-fit)
is applied with the hypothesis constrained to the sum of the initial beam four-momentum. For events with more than two
photon candidates, the combination with the smallest is retained.
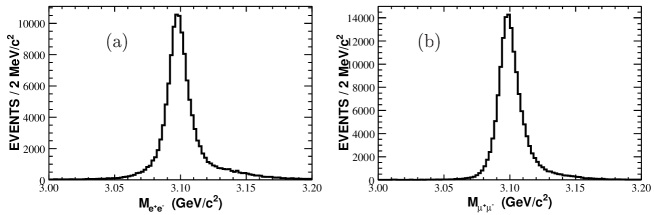
The invariant-mass distribution for lepton pairs () is shown in Fig. 1, where the signal is clearly seen with a
high signal to background ratio. For the further analysis, events are kept for which the reconstructed mass falls within a window of
; a mass window that is significantly larger than the mass resolution of about 8 MeV.
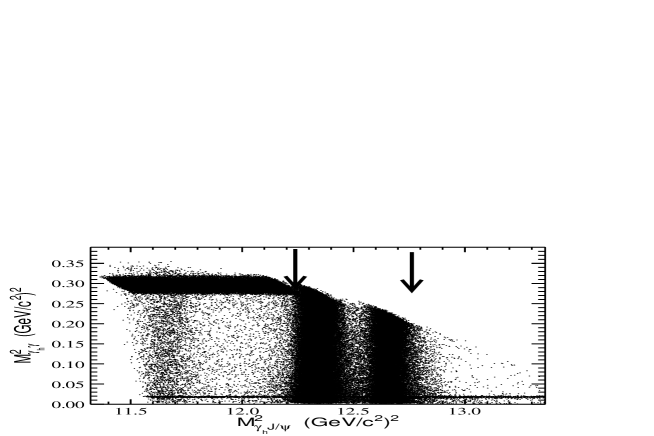
Figure 2 shows a Dalitz plot of the invariant-mass squared for the reconstructed and the energetic photon versus the two-photon invariant-mass squared , where denotes the photon with the higher energy .
Bands of , and are clearly visible. To suppress the dominant source of background, which is from decays,
the mass of the system is required to satisfy the condition
and for and , respectively. The 4C-fit is required to be less than
for the final states , respectively, where the values are determined by
optimizing the statistical significance , with the number of signal (background) events. The background event levels are determined from the inclusive MC sample.
Fig. 1: The invariant-mass distributions for (a) electron-positron and (b) di-muon pairs in the selected events in the data. Fig. 2: Dalitz plot of (vertical) versus (horizontal) for data, where denotes the energetic photon. The horizontal bands around M=0.02 (0.30) (GeV/c2)2 are due to
transitions. The vertical bands around =11.65 (12.30, 12.70) (GeV/)2 are due to transitions ; the arrows denote the requirements to remove backgrounds from the states as described in the text.
IV Data analysis
Background events from decays are studied using the inclusive MC sample. The background is
dominated by , decays. In addition, there are a few events from direct , decays ggjsi . The shape of the distribution of direct decays is smooth within both the and the mass regions.
The non-resonant background from is studied using -mass sidebands in the data. For ,
there is an additional background from , which has a smooth shape within the -mass
region. The background contribution from QED processes is studied using the continuum data taken at GeV, and it is found to be negligible.
The sum of all the MC-determined backgrounds in the distribution are shown in Fig. 3,
and they are found to be in reasonable agreement with those observed in the data.
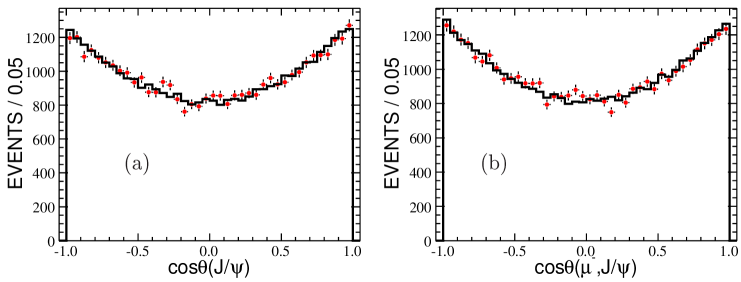
To determine the detection efficiency, the angular distributions are properly modeled
in the event generator which accounts for polarization in the and decays. These decays are dominated
by their transverse polarization; longitudinal polarization of the is negligible due to its production from annihilation, and, since the is produced via transitions,
its longitudinal polarization vanishes because of parity conservation. Thus, their polar-angle distributions take the form of
, where is the polar
angle of in the rest frame for decays, or the angle between the lepton momentum in rest frame and the momentum in the rest frame for decays. As an example, Fig. 4 shows angular distributions for and in decays, where the angular distributions obtained from MC simulations (histograms) are observed to be in excellent agreement with the data (the points with error bars).
Similarly, we have verified that the angular distributions in the decay are well described by MC simulations. The detection efficiencies are determined using these MC event samples, and the values are listed in Table 1. The efficiencies for final states are lower than that for final states because the tracks suffer from stronger bremsstrahlung effects.
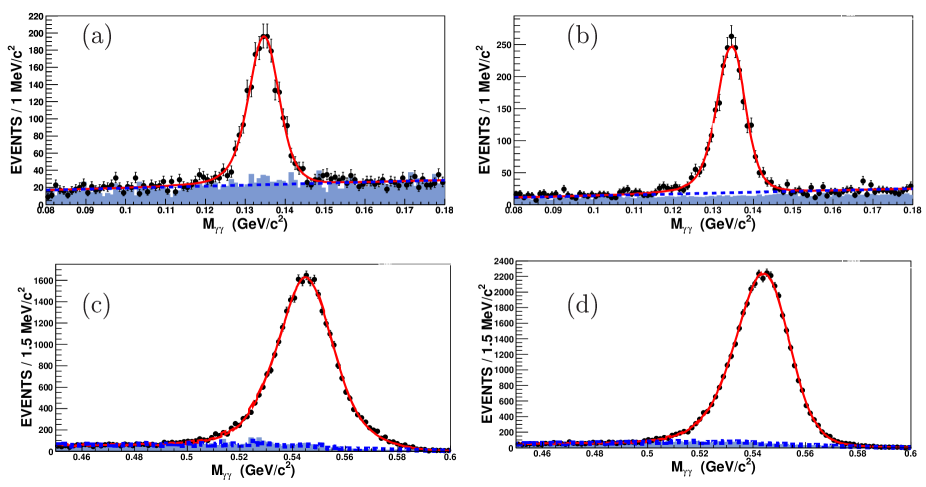
The signal yields are obtained from fits to the observed two-photon invariant mass Mγγ distributions. The observed line shapes are described with modified line shapes plus backgrounds. The and line shapes are taken from MC simulation including detector resolution; the and are described with relativistic Breit-Wigners in the event generation, and their masses and widths are fixed at their nominal values pdg . To account for possible differences in mass resolution between data and MC simulation, the / line shapes [LS] are modified by convolution with a Gaussian function G(). This technique of mass resolution smearing treatment was used in a previous publication chicj2vv . The probability distribution function (PDF) for the signal is taken as LSG(), where and correct the mass and mass resolution, respectively. The PDF for the dominant background contribution is obtained from MC
simulation and the residual background contribution is modeled as a first-order and a second-order polynomial function for the and channels, respectively.
The polynomial coefficients are free parameters with values determined from the data.
The fit results are shown in Fig. 3. For , the fit yields 182349 events for the sample with a goodness of fit of ,
and 226855 events for with a , where denotes the number of degrees of freedom
in the fit. For ,
the fit yields 29598202 events for with a and 38572280 events for
with a . The resulting values of and are and for all
the modes. The signal yields are listed in Table 1.
The branching fractions are calculated from the expression
(1)
where represents or , and are the signal yields and the number of events,
. and
denote the branching fractions of and pdg . The variable
represents the MC-determined detection efficiency. The measured branching fractions for each final state are listed in Table 2.
To validate the event selection criteria and fitting procedure, we perform a study using
a MC sample of 106106 inclusive events, with the known branching fractions as input.
The same analysis procedure as used for the real data is applied for this MC sample and the obtained branching fractions
for the channels are found to be consistent with the input branching values within the
statistical accuracy.
Fig. 3: (Color online) distributions and fit results. (a) , (b) , (c) ,
(d) , where the points with error bars are data, and the solid (red) curves are the total fit results, and the dashed curves are the fitted background shapes.
The hatched histograms represents dominant background events obtained from MC simulation and mass sidebands. Fig. 4: (Color online) Angular distributions for (a) in the rest frame, (b) in the helicity system, where is the angle between the momentum in rest frame and the momentum in rest frame. Points with error bars are data, and histograms are MC simulations as described in text.
IV.1 SYSTEMATIC ERRORS
The main sources of systematic uncertainty originate from the number of events, the trigger efficiency,
the lepton tracking, photon reconstruction, kinematic fitting, uncertainties of the branching fractions for
and , and the selection and fitting procedures.
The uncertainty on the number of events is 0.81 as reported in Ref. npsip . Trigger efficiency uncertainty is 0.15 as reported in Ref. trigger .
The photon reconstruction uncertainty is determined to be 1% per photon in Ref. chicj2gv , and, thus, the two-photon final state is assigned an uncertainty of 2. The tracking efficiency of the hard leptons is studied using a control sample of , decays. The tracking efficiency is calculated as
where indicates the number of events with all final tracks reconstructed successfully; and indicates
the number of events with one or both charged lepton tracks successfully reconstructed in addition to the pion-pair.
The difference in tracking efficiency between data and MC is calculated bin-by-bin over the distribution of transverse momentum versus the polar angle of the lepton tracks. By this method, tracking uncertainties are determined
to be 0.14(0.20) and 0.16(0.19) for ,
() and , (), respectively.
Some differences are observed between data and MC distributions from the kinematic fit. These differences are mainly due to inconsistencies in the lepton track parameters between MC and data.
We apply correction factors for various track parameters that are obtained from control
data samples, where . The correction factors are found by smearing the
MC simulation output so that the pull distributions properly describe those of the experimental data.
Half of the differences between the detection efficiencies, obtained using MC simulations with and without applying
these correction factors, are taken as systematic errors. These are 0.15(0.19) and
0.20(0.28) for ,
() and , (), respectively.
Requirements on the ratio and the invariant mass have been applied in the event selection. Uncertainties associated with these requirements are determined using the same control sample described above. Differences in the detection efficiency between the control data sample and the MC due to the ratio requirement are 0.06% and 0.05% for and , respectively. Uncertainties caused by the mass window selection are
0.06% for both the and channels.
An uncertainty due to the requirement arises from a difference, , in the mass resolution between the data and MC simulation, and is estimated by changing the MC-optimized requirement to one optimized using the data. Uncertainties caused by this requirement are determined in this way to be 0.55% (0.16%) and 0.11% (0.82%)
for , and
, , respectively.
Systematic errors due to the background shape are estimated by varying the function used to describe nondominant backgrounds from a 1st- (2nd)- order polynomial to a 2nd- (3rd-) order polynomial for . The difference in the signal yields observed is taken as a systematic error. The uncertainty due to the choice of fitting range is estimated by repeating the fits using a fitting range that is 80% as wide as that used in the original fit. The difference in the signal yields is taken as a systematic error.
Table 3 summarizes all the sources of systematic uncertainties.
IV.2 RESULTS AND DISCUSSION
Branching fractions for the decays and with are calculated with Eq. (1) using the fitting results and the detection efficiencies as inputs. Branching fractions measured using and final states are combined together with the weighted average method described
in Ref. pdg , here common systematic uncertainties are counted only once.
The combined branching fractions are and (see Table 2). Using the measured branching fractions, the ratio is calculated to be (see
Table 2). Note that systematic uncertainties that are common to both channels cancel in the ratio.
Our combined result on the -ratio is consistent with previous world average values with a precision improvement of about a factor of five.
These precise measurements of the
and branching fractions permit the study of isospin violation
mechanisms in the transition.
As shown in Feng-kunGuo:2009 ; gfk_zq , the axial anomaly does
not adequately explain the observed isospin violation, while
contributions from charmed meson loops would be a possible
mechanism for additional isospin violation sources. Confirmation of
sizeable contributions from charmed-meson loops would be an
indication that non-perturbative effects play an important
role in the charmonium energy region.
Table 1: Summary of signal yields and detection efficiencies for the each final state.
Mode
Final state
(%)
23.05
29.11
35.41
46.28
182349
226855
29598202
38572280
Table 2: Summary of measured branching fractions () and the ratio with comparison to world average values (see PDG).
Table 3: Summary of all systematic errors (%) considered in this analysis.
Sources
0.81
0.81
0.81
0.81
Trigger
0.15
0.15
0.15
0.15
Tracking
0.14
0.20
0.16
0.19
Photon
2.00
2.00
2.00
2.00
4-C Fit
0.15
0.19
0.20
0.28
1.01
1.01
1.01
1.01
0.03
0.03
0.51
0.51
M()
0.06
0.06
0.06
0.06
M()
0.55
0.16
0.11
0.82
E/p
0.06
0.05
0.06
0.05
Background shape
0.24
0.24
1.14
0.10
Fitting range
0.63
0.80
0.55
0.58
Total
2.55
2.55
2.77
2.66
Acknowledgement:
The BESIII collaboration thanks the staff of BEPCII and the computing center for their hard efforts. This work is supported in part by the Ministry of Science and Technology of China under Contract No. 2009CB825200; National Natural Science Foundation of China (NSFC) under Contracts Nos. 10625524, 10821063, 10825524, 10835001, 10935007, 11125525; Joint Funds of the National Natural Science Foundation of China under Contracts Nos. 11079008, 11179007; the Chinese Academy of Sciences (CAS) Large-Scale Scientific Facility Program; CAS under Contracts Nos. KJCX2-YW-N29, KJCX2-YW-N45; 100 Talents Program of CAS; Istituto Nazionale di Fisica Nucleare, Italy; Ministry of Development of Turkey under Contract No. DPT2006K-120470; U. S. Department of Energy under Contracts Nos. DE-FG02-04ER41291, DE-FG02-91ER40682, DE-FG02-94ER40823; U.S. National Science Foundation; University of Groningen (RuG) and the Helmholtzzentrum fuer Schwerionenforschung GmbH (GSI), Darmstadt; WCU Program of National Research Foundation of Korea under Contract No. R32-2008-000-10155-0
References
(1)J. Z. Bai et al. (BES Collaboration), Phys. Rev. D 70, 012006 (2004).
(2) H. Mendez et al. (CLEO Collaboration), Phys. Rev. D 78, 011102 (2008).
(3)Y. P. Kuang and T. M. Yan, Phys. Rev. D 24, 2874 (1981); Y. P. Kuang et al., ibid.37, 1210 (1988).
(4)B. L. Ioffe, Yad. Fiz. 29, 1616 (1979) [Sov. J. Nucl. Phys. 19, 827 (1979)];
B. L. Ioffe and M. A. Shifman, Phys. Lett. B 95, 99 (1980).
(5)G. A. Miller et al., Phys. Rep. 194, 1 (1990).
(6) J. Beringer et al. (Particle Data Group), Phys. Rev. D 37, 010001 (2012).
(7)F. K. Guo, Christoph Hanhart, and Ulf-G. Meiner, Phys. Rev. Lett., 103, 082003 (2009); ibid.104, 109901(E) (2010).
(8)
F. K. Guo, C. Hanhart, G. Li, U. G. Meissner and Q. Zhao,
Phys. Rev. D 83, 034013 (2011) [arXiv:1008.3632 [hep-ph]].
(9)
Z. K. Guo, S. Narison, J. M. Richard and Q. Zhao,
Phys. Rev. D 85, 114007 (2012) [arXiv:1204.1448 [hep-ph]].
(10)
Y. J. Zhang, G. Li and Q. Zhao,
Phys. Rev. Lett. 102, 172001 (2009) [arXiv:0902.1300 [hep-ph]].
(11)
G. Li and Q. Zhao,
Phys. Rev. D 84, 074005 (2011) [arXiv:1107.2037 [hep-ph]].
(12)M. Ablikim et al. (BES Collaboration), Nucl. Instrum. Meth. A 614, 345 (2010).
(13) J. Z. Bai et al. (BES Collaboration),
Nucl. Instrum. Meth. Phys. Res., Sect. A 458, 627 (2001); 344, 319
(1994).
(14) D. M. Asner et al., Int. J. Mod. Phys. A 24, Supp. (2009) [arXiv:0809.1869v1 [hep-ex]].
(15) G. Viehhausser et al., Nucl. Inst. Meth. A 462, 146 (2001).
(16)M. Oreglia et al. (Crystal Ball Collaboration), Phys. Rev. D 25, 2259 (1982).
(17) M. Ablikim et al. (BESIII Collaboration), arXiv:1209.6199 [hep-ex].
(18)Z. Y. Deng et al., High Energy Physics & Nuclear Physics 30, 371 (2006).
(19) S. Jadach, B. F. L. Ward, and Z. Was, Comput. Phys.
Commun. 130, 260 (2000); Phys. Rev. D 63, 113009 (2001).
(20) Ping Ronggang, Chin. Phys. C 32, 599 (2008).
(21) J. C. Chen, G.S. Huang, X. R. Qi, D.H. Zhang, and Y. S. Zhu, Phys. Rev. D 62, 034003 (2000).
(22) W. D Li, H. M Liu et al., in Proceedings of CHEP06,
Mumbai, India, 2006 edited by Sunanda Banerjee (Tata
Institute of Fundamental Research , Mumbai, 2006).
(23)M. Ablikim et al. (BESIII Collaboration), Phys. Rev. D 83, 112005 (2011).
(24) M. Ablikim et al. (BESIII Collaboration), Phys. Rev. Lett. 107, 092001 (2011).
(25)M. Ablikim et al. (BESIII Collaboration), arXiv:1204.0246 [hep-ex].
(26) N. Berger et al., Chinese Physics C 34, 1779 (2010).
(27) F. K. Guo, C. Hanhart, G. Li, Ulf-G. Meiner and Q. Zhao, Phys. Rev. D 83, 034013.