The growth of massive stars via stellar collisions in ensemble star clusters
Abstract
Recent simulations and observations suggest that star clusters form via the assembling of smaller sub-clusters. Because of their short relaxation time, sub-clusters experience core collapse much earlier than virialized solo-clusters, which have similar properties of the merger remnant of the assembling clusters. As a consequence it seems that the assembling clusters result in efficient multiple collisions of stars in the cluster core. We performed a series of -body simulations of ensemble and solitary clusters including stellar collisions and found that the efficiency of multiple collisions between stars are suppressed if sub-clusters assemble after they experience core collapse individually. In this case, sub-clusters form their own multiple collision stars which experienced a few collisions, but they fail to collide with each other after their host sub-clusters assemble. The multiple collision stars scatter each other and escape, and furthermore the central density of the remnant clusters had already been depleted for the stars to experience more collisions. On the other hand, if sub-clusters assemble before they experience core collapse, the multiple collisions of stars proceed efficiently in the remnant cluster, and the collision products are more massive than virialized solo-clusters and comparable in mass to cold solo-clusters.
keywords:
galaxies: star clusters:general — methods: N-body simulations – galaxies: star clusters: individual: R136 — open clusters and associations: individual: NGC3603, Westerlund1, Westerlund 21 Introduction
Young dense star clusters observed in the Milky Way and the Large Magellanic Cloud (LMC), e.g., R136 (Massey & Hunter, 1998; Crowther et al., 2010), NGC 3603 (Stolte et al., 2006; Harayama et al., 2008), Westerlund 1 (Clark et al., 2005; Brandner et al., 2008; Gennaro et al., 2011) and 2 (Ascenso et al., 2007; Rauw et al., 2007), are good samples for understanding the formation mechanism of dense star clusters. They are massive () and dense (), and seem to be approaching (or might have experienced) core collapse although they are young (Myr) (Mackey & Gilmore, 2003). For example, in R136 in the LMC, its high core density () (Mackey & Gilmore, 2003) and the existence of high-velocity stars (runaway stars) escaping from the cluster (Brandl et al., 2007; Evans et al., 2010; Bestenlehner et al., 2011; Gvaramadze & Gualandris, 2011) suggest that it experienced core collapse (Fujii & Portegies Zwart, 2011). If such a young massive cluster experiences core collapse, repeated collisions (so-called runaway collisions) of stars, and as a consequence the formation of very massive stars (), are expected (Portegies Zwart et al., 1999; Portegies Zwart & McMillan, 2002; Moeckel & Clarke, 2011; Baumgardt & Klessen, 2011). Such very massive stars formed through multiple stellar collisions could result in the formation of intermediate-mass black holes (IMBHs) (Ebisuzaki et al., 2001).
The formation of IMBHs in dense star clusters via multiple collisions has been studied using -body simulations (Portegies Zwart et al., 1999, 2004; Gürkan et al., 2004; Freitag et al., 2006), and the results suggest that IMBHs with could be formed in such dense clusters. Including stellar evolution, however, a high mass-loss rate due to the stellar wind of massive stars prevents the growth of the massive stars (Belkus et al., 2007; Glebbeek et al., 2009). A very high collision rate is required for such very massive stars to overcome the copious mass-loss and nevertheless leads to the formation of an IMBH (Fujii et al., 2008).
There are some mechanisms to enhance the growth rate of the very massive stars, but the most important factor is the moment of core collapse, . This short but high density phase is necessary for the cluster to become collisionally dominated, which is critical for the collision rate of stars in the cluster. Earlier collapse times assist an efficient mass accumulation because stars can start multiple collisions before the cluster starts to lose massive stars via stellar evolution.
The core-collapse time is determined by the relaxation time of the virialized star cluster, which with a Salpeter-type mass function is about 20% of the half-mass relaxation time, (Portegies Zwart & McMillan, 2002; Heggie & Hut, 2003). Massive clusters are unlikely to reach core collapse before the end of main-sequence lifetime of their most massive stars, which for is Myr. These clusters can still reach core collapse before the most massive stars leave the main-sequence if they are born kinematically relatively cold. A sub-virial cluster evolves faster dynamically than a cluster that is born in vitial equilibrium; mass segregation in sub-virial clusters also proceeds on a shorter time scale (Allison et al., 2009). Mass segregation as well as core collapse proceed on the same –dynamical– timescale, and for sub-virial clusters also the increase of the core density proceeds on a shorter time scale than for virialized clusters. The accelerated dynamical evolution of sub-virial clusters enables an efficient mass-growth via multiple collisions of stars.
Mass segregation causes the massive stars to sink to the cluster center, and consequently to pile up in the cluster core. In the core these star find each other and initiate a collision runaway (Portegies Zwart et al., 1999). The consequent mass-growth due to stellar collisions can be quite efficient, in particular if the massive stars are concentrated in the core. Allowing a cluster to be born with some degree of mass segregation also makes the collision runaway more efficient (Ardi et al., 2008; Goswami et al., 2012), much in the same way as sub-virial initial conditions reduces the time of mass-segregation, which again leads to an enhanced collision rate (Allison et al., 2009).
Fractal initial conditions and assembling sub-cluster models also result in an early dynamical evolution similarly to sub-virial initial conditions (Aarseth & Hills, 1972; McMillan et al., 2007; Moeckel & Bonnell, 2009; Allison et al., 2009; Yu et al., 2011; Smith et al., 2011; Fujii et al., 2012). The short relaxation time of sub-clumps compared to initially massive single clusters causes early mass segregation and core collapse. The memory of such early dynamical evolution is conserved in the merger remnant (McMillan et al., 2007; Fujii et al., 2012, hereafter Paper 1), the formation of star clusters by assembling them seems to be an effective way for efficient multiple collisions of stars in young star clusters.
In paper 1, we found that the formation scenario of young dense star clusters via mergers of ensemble sub-clusters can successfully explain the mature characteristics of young massive star clusters such as R136 in 30 Dor region. The age of R136 is only 2–3 Myr, but it shows dynamically mature characteristics, such as mass segregation, a high core density, and a wealth of high velocity escaping stars (Mackey & Gilmore, 2003; Brandl et al., 2007; Evans et al., 2010; Bestenlehner et al., 2011; Gvaramadze & Gualandris, 2011). However, the relaxation time of R136 obtained from its current mass and radius is Myr (Mackey & Gilmore, 2003), which is too long to have reached core collapse at its current age. In paper 1, we performed a series of -body simulations of ensemble clusters and demonstrated that “ensemble”-cluster models can reproduce observations such as the core density, the fraction of high-velocity escapers, and the distribution of massive stars which experienced collisions, but “solo”-cluster models, which are initially spherical and virialized, fail to reproduce these observations. Furthermore, these characteristics of the ensemble models are also consistent with the characteristics of other massive young clusters like R136 in the LMC and NGC 3603 in the Milky Way (Crowther et al., 2010).
If young dense clusters formed via assembling sub-clusters and have experienced core collapse, it is expected that repeating collisions can lead to the formation of very massive stars and possibly even IMBHs. In the observed young dense clusters, however, there is no evidence of IMBHs, but some very massive stars with an initial mass of 100–300 are observed (Stolte et al., 2006; Bestenlehner et al., 2011; Mengel & Tacconi-Garman, 2009; Gennaro et al., 2011; Roman-Lopes et al., 2011).
In this paper, we perform a series of -body simulations of solo and ensemble star clusters and demonstrate that the growth of very massive stars through multiple collisions is mediated by star cluster complexes. Our simulations show that the quick dynamical evolution of ensemble clusters does not always result in the formation of extremely-high-mass stars. When the assembling of clusters proceeds after each sub-cluster experiences core collapse (“late-assembling” case), multiple-collision stars that form in each sub-cluster fail to coalesce to an extremely massive star, but leads to the formation of several very massive stars. Some of these very massive stars can escape from the cluster as high-velocity stars due to the three-body or binary-binary encounters. When the sub-clusters assemble before they experience core-collapse (“early-assembling” case), the collision rate is enhanced and the assembled cluster forms an extremely massive star of .
2 Method and Initial Conditions
We performed a series of -body simulations of solo clusters and ensemble clusters, that merge to a single cluster with a mass equal to solo clusters. For the ensemble of sub-clusters, we adopted two models. A: a King model (King, 1966) with a dimensionless concentration parameter, , of 2 and the total mass , and B: a King model with and . The half-mass radii, , of these models are 0.092 and 0.22 pc, and the numbers of particles, , are 2048 (2k) and 8192 (8k), respectively. The core density is the same for both models (). We assumed a Salpeter initial mass function (IMF) (Salpeter, 1955) between 1 and 100 . We call these models 2kw2 and 8kw5.
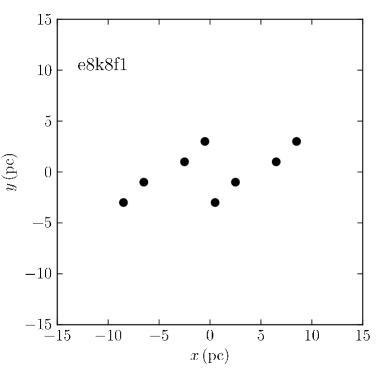
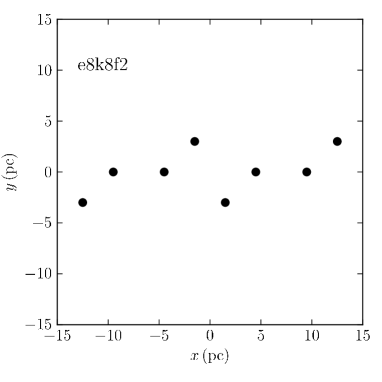
We distribute 4 or 8 of these sub-clusters in two different initial configurations: spherical or filamentary. The former model stems from clumpy star formation in giant molecular clouds, and the latter is motivated by star formation in a filamentary gas distribution or shocked region of colliding gas in the spiral arms of a galactic disk. The clumpy star formation is initiated by observations of Westerlund 1 (Gennaro et al., 2011) and R136 (Sabbi et al., 2012) and simulations (Bonnell et al., 2011; Saitoh et al., 2011). For the spherical models, we adopted 4 or 8 of models 2kw2 as sub-clusters, and distributed them randomly in a volume with a radius of and with zero velocity. We varied between 1 and 6 pc. For the filamentary models, we initialized 8 individual 8kw5 model sub-clusters. We initialized these sub-clusters with two different initial mean separations (models e8k8f1 and e8k8f2), but with zero velocity. The initial positions of the sub-clusters for these models are illustrated in Figure 2. All runs are summarized in table 2.
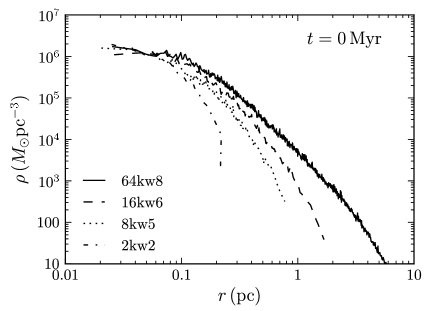
For the solo models, we adopted two more initial conditions with of and . With the same mass function, these models have 16384 (16k) and 65536 (64k) stars and are initialized using King models with and 8, respectively. In order to obtain the same core density as that of sub-clusters, their half-mass radii are 0.32 and 1.0 pc. We call these models as 16kw6 and 64kw8. In Table 1 we summarize the initial conditions, and we present their initial density profiles in Figure 1. We performed additional simulations of sub-virial (cold) initial conditions for 16kw6, and an extra set of simulations in which we reduced the kinetic energy (velocity of each particle) to two-thirds and 10% of the virialized velocity. We call these models as s16k-cool and s16k-cold, respectively (see table 2).
The -body simulations are performed using the sixth-order Hermite scheme with individual timesteps with an accuracy parameter 0.15–0.3 (Nitadori & Makino, 2008). We adopted the accuracy parameter to balance speed and accuracy, and the energy error was % for all runs. Our code does not include special treatment for binaries, but the sixth-order Hermite scheme can handle hard binaries formed in our simulations (see section 2 in Paper 1). We took into account collisions of stars with a sticky-sphere approach and mass loss due to the stellar wind for stars with with a rate of yr-1 (Fujii et al., 2009), which is similar to that obtained in (Belkus et al., 2007; Pauldrach et al., 2012). We neglected the mass-loss from stars with because it does not affect the results on the short timescale of our simulations (Myr). The stellar radii are taken from the zero-age main-sequence for solar metallicity and the radii follow Hurley et al. (2000) for stars with up to . For more massive stars, we extrapolate the result around and the result is similar to SeBa stellar evolution software (Portegies Zwart & Verbunt, 1996; Portegies Zwart & Yungelson, 1998; Toonen et al., 2012). The details of the code are described in Fujii et al. (2009).
| Model | |||||||||
|---|---|---|---|---|---|---|---|---|---|
| () | (pc) | (pc-3) | (km/s) | (Myr) | (Myr) | ||||
| 2kw2 | 2048 | 2 | 0.097 | 11 | 0.30 | 0.58 | 0.28 | ||
| 8kw5 | 8192 | 5 | 0.22 | 15 | 1.9 | 0.92 | 0.15 | ||
| 16kw6 | 16384 | 6 | 0.32 | 17 | 4.4 | 1.1 | 0.12 | ||
| 64kw8 | 65536 | 8 | 1.0 | 19 | 44 | 1.8 | 0.053 |
is the velocity dispersion.
| Model | geometry | (pc) | (sub-)cluster | ||
|---|---|---|---|---|---|
| e2k4r3 | 4 | spherical | 2.5 | 2k2w | 3 |
| e2k4r6 | 4 | spherical | 5.1 | 2k2w | 1 |
| e2k8r1 | 8 | spherical | 0.51 | 2k2w | 2 |
| e2k8r3 | 8 | spherical | 1.3 | 2k2w | 1 |
| e2k8r5 | 8 | spherical | 2.8 | 2k2w | 2 |
| e2k8r6 | 8 | spherical | 3.3 | 2k2w | 2 |
| e8k8f1 | 8 | filamentary | 2.8 | 8kw5 | 1 |
| e8k8f2 | 8 | filamentary | 4.2 | 8kw5 | 1 |
| s2k | 1 | - | - | 2kw3 | 7 |
| s8k | 1 | - | - | 8kw5 | 6 |
| s16k | 1 | - | - | 16kw6 | 6 |
| s64k | 1 | - | - | 64kw8 | 2 |
| s16k-cool | 1 | - | - | 16kw6 | 2 |
| s16k-cold | 1 | - | - | 16kw6 | 1 |
The models are named according to the following rules; “e” and “s” indicate ensemble and solo models, respectively. For ensemble models, following numbers indicate the number of particles of sub-clusters and the number of sub-clusters. The last part indicates the initial configuration of sub-clusters; “r” and the following number mean spherical and the value of the maximum radius, , “f” indicates filamentary initial configurations (see figure 2 for the initial positions of sub-clusters in these models). For solo models, the number indicates the number of particles. is the averaged distance to the nearest-neighbour sub-clusters, and is the number of runs. s16k-cool and s16k-cold are the same model as s16k, but the velocity of 67% and 10% of s16k, respectively.
3 Solo-cluster models
3.1 Virialized solo-cluster models
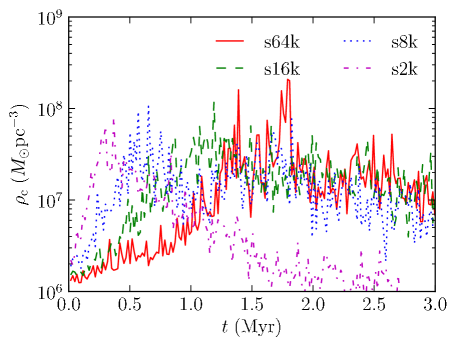
We describe the results of the initially virialized solo-cluster models, which we will refer as the “standard” model. In Figure 3 we present the time evolution of the core density for models s2k, s8k, s16k, and s64k. The core densities are calculated using the method of Casertano & Hut (1985). We identify the moment when the cluster reaches the highest core density as the core-collapse time. The core-collapse time measured from the simulations is , , , and Myr for models s2k, s8k, s16k, and s64k, respectively (see also Table 3). The core-collapse time is consistent with those obtained by previous simulations (Gürkan et al., 2004), if we take into account the differences in the mass range of the mass function. As is demonstrated in Gürkan et al. (2004), the core-collapse time scales with the central relaxation time (Heggie & Hut, 2003):
| (1) |
Here , , , and, are the gravitational constant, the mean mass of stars, and the central velocity dispersion and density, respectively. Here is the Coulomb logarithm. In our simulations, for models s8k, s16k, and s64k, but for model s2k. For model s2k, however, is shorter than because the core radius exceeds the half-mass radius. If we adopt a shorter relaxation time, then for all the models.
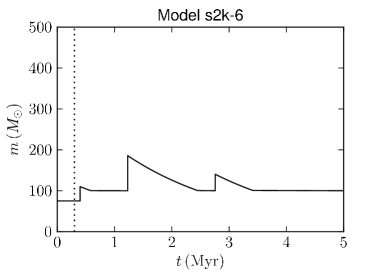
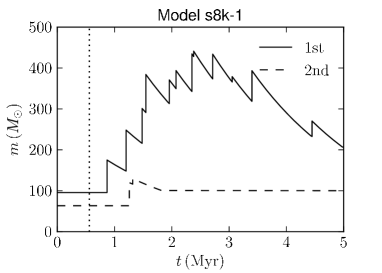
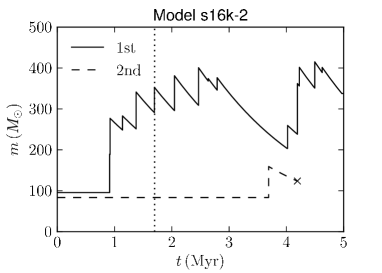
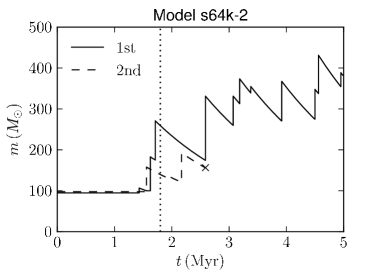
The core collapse of the cluster initiates a collision runaway in the cluster core (Portegies Zwart et al., 1999). In Figure 4 we present the merger histories of the multiple-collision stars in the solo-cluster simulations s2k, s8k, s16k, and s64k. In each model, one primary collision product (PCP) per cluster grows through repeated collisions of stars. In model s2k the mass-loss due to the stellar wind exceeds the mass-gain by the collisions, and therefore the PCP has lost all gained mass by the end of the simulation (5Myr). PCPs grow up to the maximum mass via repeating collisions, but by the time it explodes (2–3 Myr Belkus et al., 2007; Pauldrach et al., 2012) the star is . Here we define as the maximum mass of a star reached during its lifetime as a result of collisions.
PCPs are not the only stars that experienced collisions. In models s8k, s16k, and s64k, we find secondary collision products (SCPs). In most cases SCPs experience only one collision (sometimes a few collisions), but never grow as massive as PCPs, although SCPs sometimes exceed our adopted upper-limit to the IMF (). The SCPs end up merging with PCPs (see bottom right panel in Figure 4) or just lose their mass by stellar evolution (see top right panel in Figure 4). This result agrees with previous numerical simulations (Freitag et al., 2006).
We also find that the time when the PCPs reach their maximum mass , , is scaled by , and that 2.3, 2.2, 2.2, and 2.6 for models s2k, s8k, s16k, and s64k, respectively.
3.2 Cold solo-cluster models
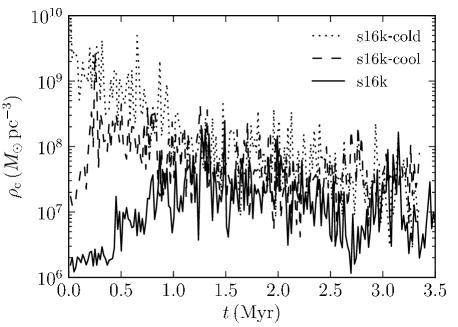
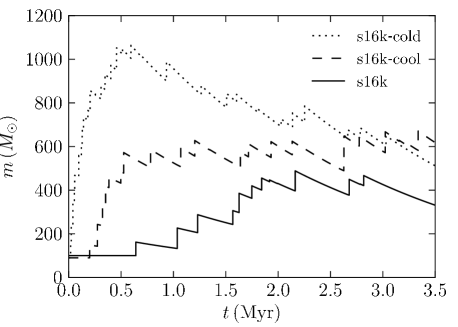
Sub-virial (cold) initial conditions reach core collapse considerably earlier than virialized ones. Cold models have therefore been suggested to explain the dynamically advanced appearance of observed young star clusters (Allison et al., 2009). In Figure 5 we present the core-density evolution of models s16k-cool and s16k-cold, which initially have 67% and 10% of the virialized temperature. These models reach core collapse much earlier than virialized models, and as a consequence multiple collisions start earlier and proceed at a higher collision rate. In figure 6 we present the mass evolution of the PCPs for models s16k-cold and s16k-cool. Colder initial conditions result in a higher of the PCPs. The high is a result of the high collision rate, which is caused by the high density in the core (see Figure 5).
By the time the PCPs leave the main sequence (of Myr), their masses have been reduced considerably due to stellar mass-loss, which competes with the mass gain by collisions. In model s16k-cold, the PCP grows quickly in the beginning of the simulation, but after 0.5 Myr the mass-loss rate due to the stellar wind becomes higher than the mass-growth by stellar collisions. In model s16k-cool, the PCP stops growing at 0.5 Myr because the mass-growth rate balances to the mass-loss rate, and then the PCP maintains its mass until the end of the simulation (3.5 Myr). Although the final masses of the PCPs are comparable in both s16k-cool and s16k-cold models, of model s16k-cold is twice as massive as that of model s16k-cool.
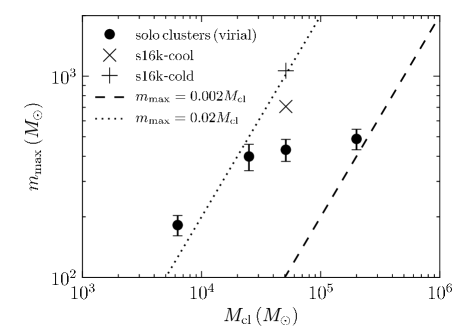
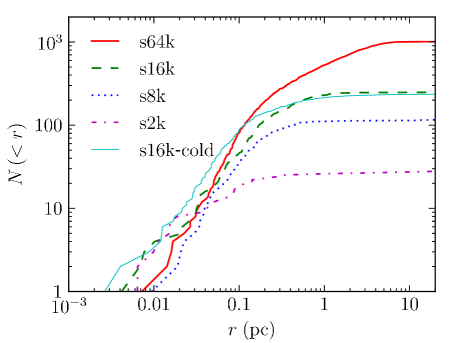
In Figure 7 we show of the PCPs for all solo models. The maximum mass of the PCPs in models s8k, s16k, and s64k is quite similar () irrespective of . One might expect that more massive clusters contain a larger number of massive stars and therefore a more massive cluster can form a more massive PCP. In our simulation, however, the number of stars which merged into the PCPs and the mean mass of the merged stars are quite similar among these models (see Table 3). By comparing models s8k, s16k, and s64k, their and are quite similar even though their total cluster masses are different. If the collisions selectively occur among the most massive stars and the numbers of collisions are the same, larger clusters should have a larger mean collision mass because larger clusters contain more massive stars. However, the number of massive stars does not simply follow this relation. In figure 8 we plot the cumulative number distribution of massive stars with at the moment in which the mass of the PCP reaches . The number of stars with within 0.05 pc are similar () among models s8k, s16k, and s64k and slightly smaller for model s2k. In particular for the models s16k and s64k, the distribution of massive stars preserves the initial distribution in the outer part of the cluster because the half-mass relaxation time exceeds . The dynamical evolution in these models is driven on a timescale of , and they have similar core properties: , , and (see Table 1 and Figure 3).
In model s2k, on the other hand, and as a consequence the dynamical evolution proceeds throughout the entire cluster. Model s8k shows an evolution similar to that of model s2k: for model s8k is as high as that of model s2k. For these models Myr, which is sufficiently short for massive stars in the outer part of the cluster to join the collisions in the core. Similar to the model s2k, models s16k-cool and s16k-cold can also gather massive stars from the entire cluster to the cluster center irrespective of their initial positions. In addition, these sub-virial models achieve very high density (see Figure 5), which enhances the collision rate. The massive stars in model s16k-cold are more concentrated towards the cluster center compared with model s16k (see Figure 8).
Even though for model s2k the PCP can accumulate stars from the entire cluster population of massive stars, their total number and mass still cannot compete with the population of massive stars in the more massive clusters. In these latter models, the maximum mass of the PCP is limited by the reservoir of massive stars, which manages to segregate to the core by the moment of the core collapse. A larger cluster mass therefore does not automatically lead to a massive PCP. As seen in Figures 4 and 6, the mass evolution of the PCPs in models s2k, s8k, and s16k-cold show a clear peak in the middle of the simulation. In the later phase, when the collision rate decays, their mass-loss rate exceeds their mass-growth rate by stellar collisions. In models s16k and s64k, on the other hand, they have not exhausted their reservoir of massive stars because their half-mass relaxation time is not shorter than the simulation time and therefore some of the massive stars still remain in the outer part of the clusters.
We empirically obtained a relation that (dotted line in Figure 7) for the low cluster-mass models () and the cold model. For massive clusters, however, is smaller than that according to this relation. For the most massive cluster (), is consistent with the result presented by Portegies Zwart & McMillan (2002), (dashed line in Figure 7).
| Model | (Myr) | (Myr) | (Myr) | ||||
| e2k4r3-1 | 287 | 0.45 | 0.2–0.87 | 375 | 78.3 | 8 | |
| e2k4r3-2 | 260 | 0.78 | 0.03–1.2 | 454 | 60.6 | 15 | |
| e2k4r3-3 | 268 | 0.61 | 0.6–1.3 | 139 | 56.7 | 12 | |
| e2k4r6 | 238 | 0.57 | 2.2–2.7 | 743 | 46.8 | 16 | |
| e2k8r1-1 | 998 | 0.80 | 0.03–0.38 | 0 | 44.2 | 45 | |
| e2k8r1-2 | 667 | 1.35 | 0.03–0.32 | 160 | 69.4 | 22 | |
| e2k8r3 | 530 | 0.86 | 1.0 –0.75 | 147 | 80.2 | 14 | |
| e2k8r5-1 | 334 | 1.11 | 0.47–1.9 | 1192 | 57.0 | 25 | |
| e2k8r5-2 | 486 | 0.78 | 0.03–2.0 | 651 | 61.2 | 19 | |
| e2k8r6-1 | 245 | 0.59 | 0.77–2.4 | 1367 | 51.0 | 24 | |
| e2k8r6-2 | 274 | 0.42 | 0.03– | 970 | 45.5 | 21 | |
| e8k8f1 | 1310 | 1.40 | 0.4–1.2 | 268 | 73.0 | 42 | |
| e8k8f2 | 659 | 2.28 | 0.8–2.0 | 995 | 88.4 | 33 | |
| s2k | - | 53.3 | 4.6 | ||||
| s8k | - | 63.2 | 11.3 | ||||
| s16k | - | 65.8 | 13.2 | ||||
| s64k | - | 0 | 66.0 | 15.5 | |||
| s16k-cold | 1064 | 0.59 | - | 0 | 46.6 | 40 | |
| s16k-cool | - | 0 | 51.1 | 28.5 |
4 Ensemble-cluster models
In section 3 we demonstrated that the results obtained from our solo-cluster models are consistent with previous numerical studies. In this section we present the results of ensemble-cluster models, in which sub-clusters assemble to finally form one single cluster. In ensemble-cluster models, sub-clusters collapse on a timescale shorter than that for solo-clusters with the same total mass. Their further evolution is dominated by the dynamical evolution of the sub-clusters before they merge. The conservation of the dynamical states through the mergers (Vesperini et al., 2009) drives the further evolution of the cluster merger products. As a result, ensemble clusters tend to experience core collapse considerably faster than solo clusters which have initially similar properties to those of the merger remnant of ensemble clusters. In paper 1 we already showed that the quicker dynamical evolution of ensemble clusters can explain the mature characteristics of young dense clusters such as R136 and NGC 3603. Here we use that enhanced dynamical evolution to study the PCPs. The early dynamical evolution of ensemble clusters is similar to that of cold solo-clusters. One might expect that ensemble clusters also result in the formation of massive PCPs, but we will show that the early evolution of ensemble clusters is more complicated.
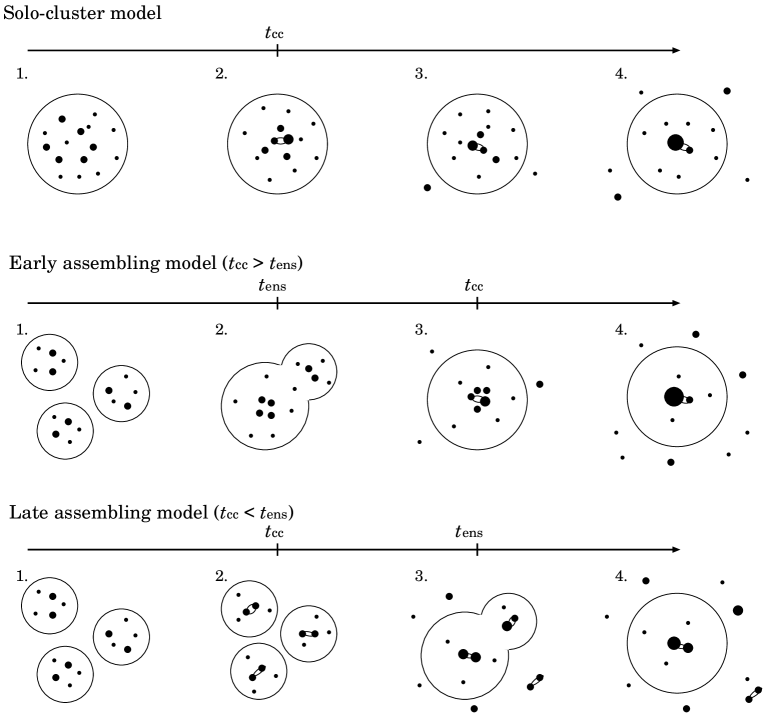
In Figure 9 we illustrate the schematic evolution of two typical evolutionary paths of ensemble clusters. We find that the most important parameter for the evolution of ensemble clusters is the moment of assembling, , compared to of sub-clusters. If (“early assembling”), the PCPs in the remnant cluster grow efficiently by stellar collisions because the short relaxation time of the sub-clusters drives mass-segregation and core collapse faster than solo clusters. This evolution is similar to that of cold solo-clusters.
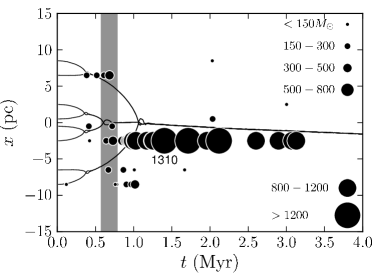
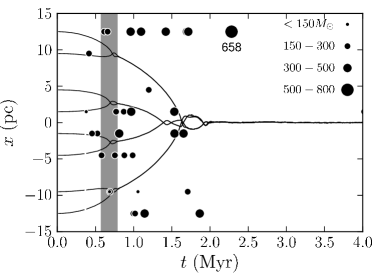
If (“late assembling”), each sub-cluster experiences core collapse before they assemble and form a PCP per individual sub-cluster. The mass of each PCP is limited by the sub-cluster mass as we described in section 3. After the assembling of two or more sub-clusters, the PCPs formed in the sub-clusters sink to the center of the remnant cluster and interact each other. Most of them, however, are scattered and ejected from the cluster because they tend to reside in hard binaries with a massive companion. The PCPs tend to be in the hardest binaries with the most massive stars when they formed in the sub-clusters. In each binary-binary encounter following a sub-cluster merger, two PCPs may collide although they are also ejected without experiencing a collision. Therefore, the majority of the PCP-binaries are scattered or ionized, and only one PCP-binary survives in the remnant cluster by the time the assembly is completed. The surviving PCP cannot continue to grow in mass because by that time the central density of the assembled clusters has been depleted due to the early dynamical evolution.
4.1 Stellar collisions in ensemble clusters
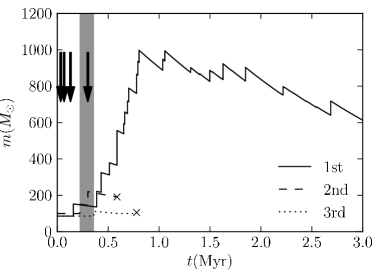
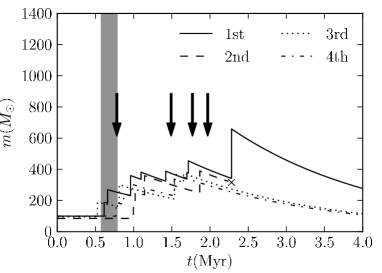
In Figures 10 and 11, we present the mass evolution of PCPs and SCPs in ensemble clusters. The left and right panels show early and late assembling models, respectively. In early assembling models, one massive PCP per remnant cluster grows after the assembling of sub-clusters. Even though some of the sub-clusters start forming PCPs before assembling, the PCPs merge after the host sub-clusters merged. In late assembling models, on the other hand, each sub-cluster grows its own PCP, but most of them do not collide with each other even after the assembling of their host sub-clusters.
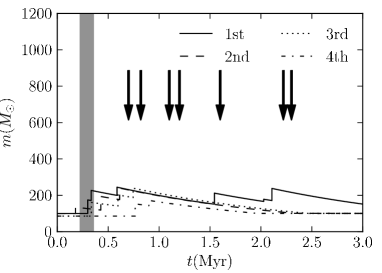
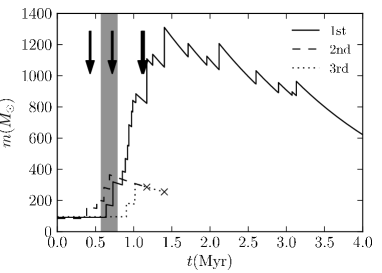
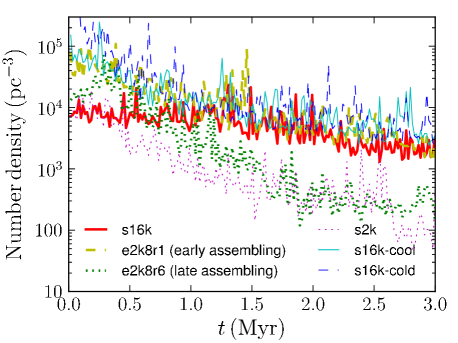
We find the reason for the difference between early and late assembling cases in the density evolution of these clusters. In Figure 12 we show the time evolution of the maximum number densities for ensemble and solo clusters. Here we plot the maximum value of the local density, which is calculated using six nearest neighbours. (Note that the maximum local density does not trace the density of one individual sub-cluster.) In early assembling cases, the density increases on the core-collapse timescale of the solo sub-cluster (model s2k), but the maximum density is higher than that of model s2k and rather comparable to those of the cold models (models s16k-cold, s16k-cool). The evolution after the core collapse is similar to that of the cold models. The density gradually decreases and eventually becomes comparable to that of virialized solo-clusters (model s16k).
The density in late assembling cases also grows on the core-collapse timescale of the sub-clusters until a peak is reached at Myr. The density decreases as quickly as that of the solo sub-clusters (model s2k), which is different from early assembling cases. By the end of the simulations, the number density of the late assembling cases is an order of magnitude lower than in the early assembling cases. The relatively low density prevents the growth of PCPs in the late assembled clusters. The effect of the difference in the density can be seen in the number of stellar collisions, in Table 3. In early assembling models (e2k8r1-1 and e8k8f1) and the cold solo model (s16k-cold), and , but in late assembling models (e2k8r5, e2k8r6, and e8k8f2) and .
In late assembling models (for e2k8r5 and e2k8r6), the maximum mass of the PCPs is 200–400 , but the mass of the PCP is similar to those of multiple SCPs, which were PCPs in the sub-clusters. This feature is consistent with young dense clusters such as R136 in the LMC, which contains five mass stars (Crowther et al., 2010; Bestenlehner et al., 2011), although there is no evidence of any extremely massive stars with .
4.2 Maximum mass of PCPs in ensemble clusters
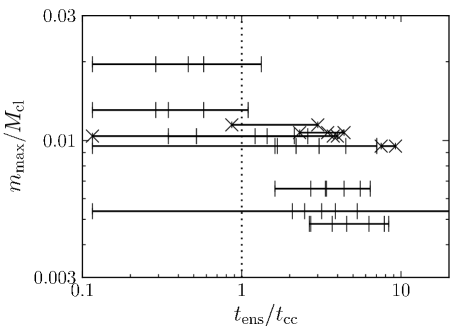
As we show in section 4.1, early assembling of sub-clusters results in the formation of a PCP, while late assembling forms a less massive PCP and multiple SCPs as massive as the PCP. In Figure 13 we present the relation between and of ensemble models, where is the core-collapse time of the sub-clusters. Irrespective of the number of sub-clusters, the maximum mass of the PCPs decreases as the assembling time is delayed.
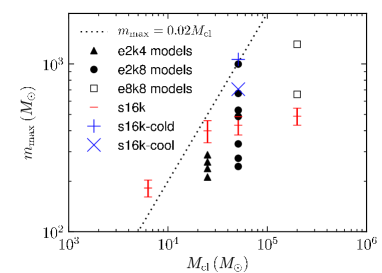
In the left panel of Figure 14, we show the relation between of the PCPs and for both solo and ensemble clusters. (Note that for the solo clusters, the data is the same as that shown in Figure 7). The PCP mass of early assembling models is higher than that of solo clusters with the same cluster mass and as massive as that of the cold model. In late assembling models, the PCPs is almost as massive as those of the solo clusters with the same mass.
The difference in the maximum mass of PCPs is understood if we take into account all the PCPs and SCPs in the cluster. In the right panel of Figure 14, we present the total mass of all the PCPs and SCPs in the cluster. The total masses are roughly located on the relation that . This result suggests that the potential maximum mass of the PCPs is 2% of the cluster mass, although the value depends on the initial mass function and the mass-loss rate due to the stellar wind. The total mass of the SCPs is summarized in Table 3 as . These SCPs fail to merge with the most massive PCP and their mass will be lost from the cluster by escape or stellar evolution.
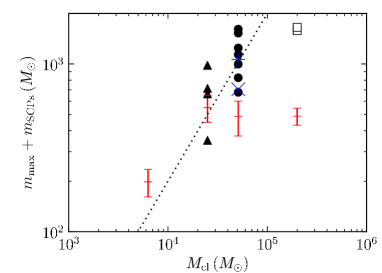
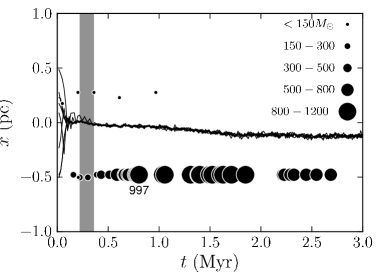
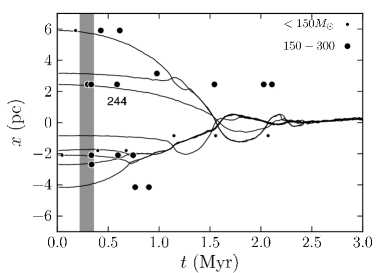
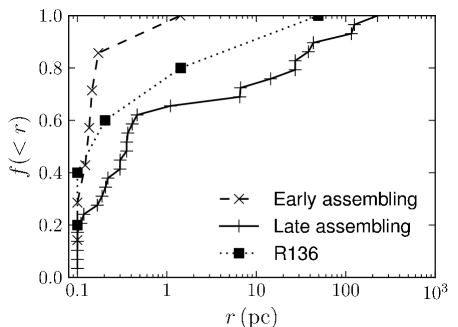
In Figure 15, we plot the radial distribution of PCPs and SCPs, which grows to . We combine the results from several runs, separating them in the early and late assembling cases. While all the PCPs and SCPs are located in the cluster core in the early assembling case, % of them are ejected from the clusters or located in the outskirts of the cluster ( pc) in the late assembling case. The numbers of PCPs and SCPs per cluster are on average 1.75 and 5.8 for the early and late assembling cases, respectively. In Figure 15 we also present the cumulative number distribution of stars with in the R136 region (Crowther et al., 2010; Bestenlehner et al., 2011). The number of such massive stars and their distribution imply that R136 experienced some late assembling, and observationally a sub-cluster has been found around R136 (Sabbi et al., 2012).
4.3 Central Density of Remnant Clusters
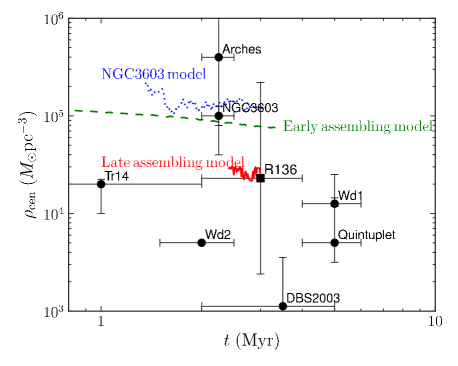
In Figure 16, we compare the central density of the remnant clusters with the observed density of young massive clusters. Since the core radii and core densities of the simulated clusters are obtained from rather small number of particles they show relatively large fluctuations (see Figures 3 and 5). We adopted the core radius of NGC3603 of 0.14 pc for the models e2k4r3, because the mass of these models is comparable to that of NGC3603 (Harayama et al., 2008). The total mass of the models e2k8 is comparable to that of R136, for which we adopted a core radius of 0.4 pc (Selman & Melnick, 2012) rather than the observed 0.025 pc (Hunter et al., 1995; Andersen et al., 2009). We argue that the observe value is rather strongly affected by the dynamical evolution of the cluster, and also influenced by the small number of stars in the core; both tend to cause an under estimate of the core radius. In the same figure we also plot the observed densities of a number of the young clusters listed in (Pfalzner, 2009) and Anderson et al. (2012). Those observed density are not measured in the same way as we determine the central density in our simulations, although we tried to mimic the observational technique to measure the core radius as good as possible. Late assembly models turn out to have a central density which is an order-of-magnitude lower than in the early assembly models. Those lower densities very well matches the central density in the observations of R136. The central density of virialized solo cluster models evolve quite similarly to the early assembly simulations.
5 Summary and Discussion
We performed -body simulations of solo and ensemble star clusters and found that ensemble clusters evolve through typically two pathways depending on their assembling time compared to the core-collapse time of the sub-clusters.
In the early assembling case the sub clusters merge before they experience core collapse individually: . After merging, their remnant clusters have dynamically mature characteristics (strongly mass segregated and core collapsed) compared to solo-clusters. The early assembling clusters experience mass segregation and core collapse on the time scale of the sub-clusters, which is shorter than that of initially large solo clusters; the short relaxation time of sub-clusters is conserved in the remnant clusters. This dynamically early evolution results in efficient multiple collisions of stars and helps the formation of extremely massive primary collision products (PCPs) with . The evolution of the early assembling clusters can be mimicked by solo-clusters when those are born sub-virial.
In the late assembling case the sub clusters experience core collapse before they merge into the larger conglomerate: . The dynamically mature characteristics of the merger remnant suppresses the growth of massive stars via stellar collisions. In this case, the sub-clusters experience core collapse individually and form their own PCPs, but the maximum mass of the PCPs in the sub-clusters is limited by the total mass of the sub-clusters. Even after the sub-clusters assemble, the PCPs stop growing because the central density of the remnant cluster is already depleted due to the quick dynamical evolution of the sub-clusters. Since the PCPs in sub-clusters form massive binaries, they interact with each other in the remnant clusters. Some of them (SCPs) collide, but the others are scattered from the cluster by three-body or binary-binary encounters. In our simulations, 40% of the SCPs are ejected from the cluster or scattered to the outskirts of the remnant clusters. The SCPs sometimes escape with a high velocity (km/s) and reach pc from the cluster within their life time ( Myr). The observed massive high-velocity stars such as VFTS 682 might be formed in this way (see also Paper 1).
We also investigated the maximum mass of the PCPs and found that in ensemble clusters, the maximum mass depends on the assembling time of sub-clusters. In the early assembling models, the maximum mass of the PCPs is comparable to that of sub-virial solo-clusters. In the late assembling models, however, the maximum mass is similar to that of the solo sub-clusters; the difference is mainly caused by the number of collisions. In the late assembling models a larger number of SCPs are ejected from the cluster than in the early assembling case and the SCPs fail to merge to the PCP.
When the collisions of stars proceed most successfully (in early assembling and cold solo models), we find that the maximum masses of the PCPs reach 2% of the total mass of the clusters even if we take into account the high mass-loss rate due to the stellar wind. Assuming an R136-like cluster of , the expected maximum mass is . Such an efficient mass growth might result in the formation of IMBHs. For lower metalicity, the massive stars are predicted to collapse directly to IMBHs (Heger et al., 2003).
In late assembling cases, however, a smaller PCP and multiple SCPs (–) are expected to exist inside or around the remnant clusters. These stars are in the mass range of type Ib/c supernovae (SNe) assuming solar metallicity (Heger et al., 2003). In recent observations of dense molecular clouds in the central molecular zone in the Galactic center, several expanding shells were found, and the estimated total kinetic energy of them is erg. (Tanaka et al., 2007; Oka et al., 2012). Especially, three major shells have a kinetic energy of erg, which corresponds to a hypernova explosion. A young dense massive clusters which is similar to our late-merger models might be embedded in this dense molecular cloud. Furthermore, escaping SCPs will explode up to pc from the host cluster. Actually type Ib/c SNe associate with star forming regions (Anderson et al., 2010; Leloudas et al., 2011; Anderson et al., 2012; Crowther, 2012), and for example Type Ic SN 2007gr is located at pc from a young cluster (Crockett et al., 2008).
Acknowledgments
The authors thank Jeroen Bédorf for the Sapppro2 library, Alex Rimoldi for careful reading of the manuscript, and Masaomi Tanaka for fruitful discussion. This work was supported by the Japan Society for the Promotion of Science (JSPS) Research Fellowship for Research Abroad, the Netherlands Research Council NWO (grants #643.200.503, #639.073.803 and #614.061.608), the Netherlands Research School for Astronomy (NOVA). Numerical computations were carried out on the Cray XT4 at the Center for Computational Astrophysics (CfCA) of the National Astronomical Observatory of Japan and the Little Green Machine at Leiden University.
References
- Aarseth & Hills (1972) Aarseth S. J., Hills J. G., 1972, A&A, 21, 255
- Allison et al. (2009) Allison R. J., Goodwin S. P., Parker R. J., de Grijs R., Portegies Zwart S. F., Kouwenhoven M. B. N., 2009, ApJ, 700, L99
- Andersen et al. (2009) Andersen M., Zinnecker H., Moneti A., McCaughrean M. J., Brandl B., Brandner W., Meylan G., Hunter D., 2009, ApJ, 707, 1347
- Anderson et al. (2010) Anderson J. P., Covarrubias R. A., James P. A., Hamuy M., Habergham S. M., 2010, MNRAS, 407, 2660
- Anderson et al. (2012) Anderson J. P., Habergham S. M., James P. A., Hamuy M., 2012, MNRAS, 424, 1372
- Ardi et al. (2008) Ardi E., Baumgardt H., Mineshige S., 2008, ApJ, 682, 1195
- Ascenso et al. (2007) Ascenso J., Alves J., Beletsky Y., Lago M. T. V. T., 2007, A&A, 466, 137
- Baumgardt & Klessen (2011) Baumgardt H., Klessen R. S., 2011, MNRAS, 413, 1810
- Belkus et al. (2007) Belkus H., Van Bever J., Vanbeveren D., 2007, ApJ, 659, 1576
- Bestenlehner et al. (2011) Bestenlehner J. M., Vink J. S., Gräfener G., Najarro F., Evans C. J., Bastian N., Bonanos A. Z., Bressert E., Crowther P. A., Doran E., Friedrich K., Hénault-Brunet V., Herrero A., de Koter A., Langer N., Lennon D. J., Maíz Apellániz J., Sana H., Soszynski I., Taylor W. D., 2011, A&A, 530, L14+
- Bonnell et al. (2011) Bonnell I. A., Smith R. J., Clark P. C., Bate M. R., 2011, MNRAS, 410, 2339
- Brandl et al. (2007) Brandl B. R., Portegies Zwart S. F., Moffat A. F. J., Chernoff D. F., 2007, in Astronomical Society of the Pacific Conference Series, Vol. 367, Massive Stars in Interactive Binaries, N. St.-Louis & A. F. J. Moffat, ed., p. 629
- Brandner et al. (2008) Brandner W., Clark J. S., Stolte A., Waters R., Negueruela I., Goodwin S. P., 2008, A&A, 478, 137
- Casertano & Hut (1985) Casertano S., Hut P., 1985, ApJ, 298, 80
- Clark et al. (2005) Clark J. S., Negueruela I., Crowther P. A., Goodwin S. P., 2005, A&A, 434, 949
- Crockett et al. (2008) Crockett R. M., Maund J. R., Smartt S. J., Mattila S., Pastorello A., Smoker J., Stephens A. W., Fynbo J., Eldridge J. J., Danziger I. J., Benn C. R., 2008, ApJ, 672, L99
- Crowther (2012) Crowther P. A., 2012, ArXiv e-prints
- Crowther et al. (2010) Crowther P. A., Schnurr O., Hirschi R., Yusof N., Parker R. J., Goodwin S. P., Kassim H. A., 2010, MNRAS, 408, 731
- Ebisuzaki et al. (2001) Ebisuzaki T., Makino J., Tsuru T. G., Funato Y., Portegies Zwart S., Hut P., McMillan S., Matsushita S., Matsumoto H., Kawabe R., 2001, ApJ, 562, L19
- Evans et al. (2010) Evans C. J., Walborn N. R., Crowther P. A., Hénault-Brunet V., Massa D., Taylor W. D., Howarth I. D., Sana H., Lennon D. J., van Loon J. T., 2010, ApJ, 715, L74
- Freitag et al. (2006) Freitag M., Gürkan M. A., Rasio F. A., 2006, MNRAS, 368, 141
- Fujii et al. (2008) Fujii M., Iwasawa M., Funato Y., Makino J., 2008, ApJ, 686, 1082
- Fujii et al. (2009) —, 2009, ApJ, 695, 1421
- Fujii & Portegies Zwart (2011) Fujii M. S., Portegies Zwart S., 2011, Science, 334, 1380
- Fujii et al. (2012) Fujii M. S., Saitoh T. R., Portegies Zwart S. F., 2012, ApJ, 753, 85
- Gaburov et al. (2008) Gaburov E., Gualandris A., Portegies Zwart S., 2008, MNRAS, 384, 376
- Gennaro et al. (2011) Gennaro M., Brandner W., Stolte A., Henning T., 2011, MNRAS, 412, 2469
- Glebbeek et al. (2009) Glebbeek E., Gaburov E., de Mink S. E., Pols O. R., Portegies Zwart S. F., 2009, A&A, 497, 255
- Goswami et al. (2012) Goswami S., Umbreit S., Bierbaum M., Rasio F. A., 2012, ApJ, 752, 43
- Gürkan et al. (2004) Gürkan M. A., Freitag M., Rasio F. A., 2004, ApJ, 604, 632
- Gvaramadze & Gualandris (2011) Gvaramadze V. V., Gualandris A., 2011, MNRAS, 410, 304
- Harayama et al. (2008) Harayama Y., Eisenhauer F., Martins F., 2008, ApJ, 675, 1319
- Heger et al. (2003) Heger A., Fryer C. L., Woosley S. E., Langer N., Hartmann D. H., 2003, ApJ, 591, 288
- Heggie & Hut (2003) Heggie D., Hut P., 2003, The Gravitational Million-Body Problem: A Multidisciplinary Approach to Star Cluster Dynamics, Heggie D. & Hut P., ed.
- Hunter et al. (1995) Hunter D. A., Shaya E. J., Holtzman J. A., Light R. M., O’Neil Jr. E. J., Lynds R., 1995, ApJ, 448, 179
- Hurley et al. (2000) Hurley J. R., Pols O. R., Tout C. A., 2000, MNRAS, 315, 543
- King (1966) King I. R., 1966, AJ, 71, 64
- Leloudas et al. (2011) Leloudas G., Gallazzi A., Sollerman J., Stritzinger M. D., Fynbo J. P. U., Hjorth J., Malesani D., Michałowski M. J., Milvang-Jensen B., Smith M., 2011, A&A, 530, A95
- Mackey & Gilmore (2003) Mackey A. D., Gilmore G. F., 2003, MNRAS, 338, 85
- Massey & Hunter (1998) Massey P., Hunter D. A., 1998, ApJ, 493, 180
- McMillan et al. (2007) McMillan S. L. W., Vesperini E., Portegies Zwart S. F., 2007, ApJ, 655, L45
- Mengel & Tacconi-Garman (2009) Mengel S., Tacconi-Garman L. E., 2009, Ap&SS, 324, 321
- Moeckel & Bonnell (2009) Moeckel N., Bonnell I. A., 2009, MNRAS, 400, 657
- Moeckel & Clarke (2011) Moeckel N., Clarke C. J., 2011, MNRAS, 410, 2799
- Nitadori & Makino (2008) Nitadori K., Makino J., 2008, New Astronomy, 13, 498
- Oka et al. (2012) Oka T., Onodera Y., Nagai M., Tanaka K., Matsumura S., Kamegai K., 2012, ApJS, 201, 14
- Pauldrach et al. (2012) Pauldrach A. W. A., Vanbeveren D., Hoffmann T. L., 2012, A&A, 538, A75
- Pfalzner (2009) Pfalzner S., 2009, A&A, 498, L37
- Portegies Zwart et al. (2004) Portegies Zwart S. F., Baumgardt H., Hut P., Makino J., McMillan S. L. W., 2004, Nature, 428, 724
- Portegies Zwart et al. (1999) Portegies Zwart S. F., Makino J., McMillan S. L. W., Hut P., 1999, A&A, 348, 117
- Portegies Zwart & McMillan (2002) Portegies Zwart S. F., McMillan S. L. W., 2002, ApJ, 576, 899
- Portegies Zwart & Verbunt (1996) Portegies Zwart S. F., Verbunt F., 1996, A&A, 309, 179
- Portegies Zwart & Yungelson (1998) Portegies Zwart S. F., Yungelson L. R., 1998, A&A, 332, 173
- Rauw et al. (2007) Rauw G., Manfroid J., Gosset E., Nazé Y., Sana H., De Becker M., Foellmi C., Moffat A. F. J., 2007, A&A, 463, 981
- Roman-Lopes et al. (2011) Roman-Lopes A., Barba R. H., Morrell N. I., 2011, MNRAS, 416, 501
- Sabbi et al. (2012) Sabbi E., Lennon D. J., Gieles M., de Mink S. E., Walborn N. R., Anderson J., Bellini A., Panagia N., van der Marel R., Maíz Apellániz J., 2012, ApJ, 754, L37
- Saitoh et al. (2011) Saitoh T. R., Daisaka H., Kokubo E., Makino J., Okamoto T., Tomisaka K., Wada K., Yoshida N., 2011, in IAU Symposium, Vol. 270, IAU Symposium, J. Alves, B. G. Elmegreen, J. M. Girart, & V. Trimble, ed., pp. 483–486
- Salpeter (1955) Salpeter E. E., 1955, ApJ, 121, 161
- Selman & Melnick (2012) Selman F. J., Melnick J., 2012, ArXiv e-prints
- Smith et al. (2011) Smith R., Slater R., Fellhauer M., Goodwin S., Assmann P., 2011, MNRAS, 416, 383
- Stolte et al. (2006) Stolte A., Brandner W., Brandl B., Zinnecker H., 2006, AJ, 132, 253
- Tanaka et al. (2007) Tanaka K., Kamegai K., Nagai M., Oka T., 2007, PASJ, 59, 323
- Toonen et al. (2012) Toonen S., Nelemans G., Portegies Zwart S., 2012, A&A, 546, A70
- Vesperini et al. (2009) Vesperini E., McMillan S., Portegies Zwart S., 2009, Ap&SS, 324, 277
- Yu et al. (2011) Yu J., de Grijs R., Chen L., 2011, ApJ, 732, 16