A Search for Short-term Variability in the Very High Energy -ray Emission from the Crab Nebula
Abstract
The Crab Nebula has long been considered a standard candle in high energy astrophysics, but in recent years this assumption has been strongly contradicted in keV-GeV wavebands. In light of these developments, a search for variability is being performed on the nebula at Very High Energies (VHE; GeV), the preliminary results of which are presented here. This initial study is based on 10 years () of archival data from the Whipple 10 m telescope. The data set was searched for evidence of variability on the timescales of 1, 7, and 14 days. To date, no significant flaring activity has been found, but simulations are in progress to determine the level of variability that would be detected.
Keywords:
gamma rays: observations – ISM: supernova remnants – ISM: individual (Crab Nebula):
98.58.-w1 Introduction
The Whipple 10 m -ray telescope is located at the Fred Lawrence Whipple Observatory in southern Arizona. Until June 2011, it operated in the range TeV and pioneered the Imaging Atmospheric Čerenkov Telescope (IACT) technique for the detection of VHE -rays. The telescope was of Davies-Cotton design, consisting of a reflector and a camera at the focal plane to record the -ray images. The reflector was composed of 248 tessellated hexagonal mirrors mounted on a spherical surface with a total reflecting area of m2. The last camera in operation consisted of 379 PMTs and had a field of view of with an angular resolution of , as described in [1].
Detected by the Whipple 10 m telescope, the Crab Nebula was the first TeV source discovered [2]. It has since been considered a standard candle of VHE -ray astronomy, as it has for X-ray and lower energy -ray astronomy [e.g., 3]. As the brightest source in the VHE sky, it was ideal for this role.
In 2011, both AGILE [4] and Fermi-LAT [5] reported the discovery of flaring activity in the Crab Nebula at MeV - GeV energies. The flares occur at a frequency of per year, and have been observed to last between 4 and 15 days. ARGO-YBJ [6] also reported enhanced flux at GeV - TeV energies from the Crab Nebula. These developments have motivated this search for VHE variability on short timescales for which the Atmospheric Čerenkov Technique is particularly suited.
2 Analysis and results
A data set of Crab Nebula observations taken with the Whipple 10 m telescope was compiled from the last 10 years (). Data were taken in 28-minute observations with a standard experimental setup under good weather conditions with an elevation angle .
Motivated by the flaring timescales reported by Fermi-LAT and AGILE, the Whipple data set was searched for short-term variability on timescales of 7 and 14 days, as well as a shorter timescale of 1 day. A sliding window algorithm was developed to perform this analysis. The window is shifted along the data set night-by-night for each season. The significance of the emission in the window is calculated using the search window as the ON region and the the rest of the season as the OFF region. A high significance value would indicate the presence of a flare.
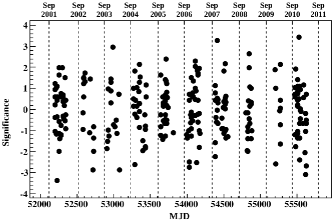
Figure 1 shows the window significances for a search timescale of 1 day for the 10 observing seasons. The highest significance detected in a 1-day window was pre-trials, corresponding to a post-trials probability of () [e.g., 7]. Both 7- and 14-day search windows yielded lower post-trials maximum significances. Thus, there is no evidence for strong VHE flaring activity on these timescales in the current data set.
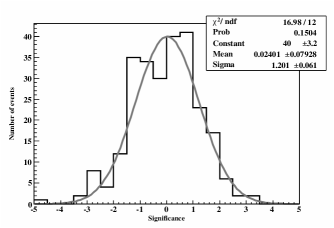
Figure 2 shows the distribution of window significances obtained with a 1-day search timescale for the 10-year data set. A similar distribution was created for each search window timescale, and fit with a Gaussian. The variances of the Gaussian fits to the significance histograms are not consistent with 1.0, indicating that the observed variations are not solely due to statistical fluctuations. Randomising the dates of the observations and reanalysing the “shuffled” data preserves the width of the distribution, so it is independent of the configuration of the data.
3 Simulations
A Monte Carlo simulation was developed to test whether the width of the significance histograms are consistent with statistical fluctuations, given the overlapping search windows. 18,000 nights of observations were simulated with the same source sampling as the real data and analysed. It was found that significance histograms produced with the three search timescales from the simulated data have variances very close to 1.0.
25,000 individual data sets, equivalent in length and sampling to the observational data, were then simulated and analysed and a distribution of the variances was produced. A variance of 1.3 (as seen in the real data, see Figure 2) was observed in only two cases. This clearly points to a non-statistical source of the broadness of the data distributions. Varying observation angles and atmospheric changes are likely the main contributing factors.
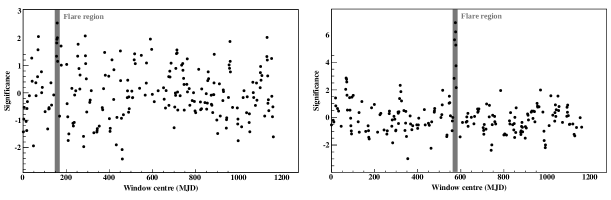
The simulation was adapted to simulate a single flare of known length and emission within an otherwise standard data set. The data sampling was adjusted to ensure one simulated run per night for the duration of the flare, while still maintaining random sampling in the rest of the data set. This idealised scenario of full sampling of the flare provides the means to put an upper limit on the level of flaring activity that would be detected. The simulation was run 600 times for two different flare emission levels. In both cases, a medium flare duration of 5 days was used, with flare emission levels of 2 average Crab Nebula and 1.5 average Crab Nebula.
Figure 3 shows typical data sets obtained for both flare emission levels. For a 7-day window, it was found that the flare was detected above post-trials in of the data sets, and even when not detected it was always clearly visible by eye. The flare was only detected once post-trials, and was generally impossible to pick out by eye.
4 Conclusion
No significant flaring activity has been found in this 10-year archival data set from the Whipple 10 m telescope. The recent model of Bednarek and Idec [8] predicts TeV flux variability of the order of above 1 TeV and on the same timescales as that observed at GeV energies. The Monte Carlo simulations indicate that flares would need to be of the order of in order to be significantly detected, and so this model cannot be constrained with the current data set. However, this work will be expanded by extending the Whipple archival data set to include earlier epochs, which could potentially double the data set. VERITAS data will also be added to the study, considerably augmenting the data set from 2007 onwards and potentially providing the sensitivity to constrain the emission model.
A search for a long-term decline in the TeV Crab Nebula flux, similar to that seen at keV energies [9] will be undertaken. This is complicated by the fact that the Crab Nebula has been used as a calibration source for IACTs since the founding of this field.
5 Acknowledgements
This research is supported by grants from the U.S. Department of Energy Office of Science, the U.S. National Science Foundation and the Smithsonian Institution, by NSERC in Canada, by Science Foundation Ireland (SFI 10/RFP/AST2748) and by STFC in the U.K. We acknowledge the excellent work of the technical support staff at the Fred Lawrence Whipple Observatory and at the collaborating institutions in the construction and operation of the instrument. Anna O’Faoláin de Bhróithe acknowledges the support of the Irish Research Council “Embark Initiative”.
References
- [1] Kildea, J., et al., 2007, Astroparticle Physics, 28(2), 182
- [2] Weekes, T. C., et al., 1989, ApJ, 342, 379
- [3] Kirsch, M. G., et al., 2005, SPIE Conference Series, 5898, 22, arXiv:astro-ph/0508235v1
- [4] Tavani, M., et al., 2011, Science, 331, 736, arXiv:1101.2311v1
- [5] Abdo, A. A., et al., 2011, Science, 331, 739, arXiv:1011.3855v3
- [6] Vernetto, S., 2011, ICRC, 7, 126,
- [7] Biller, S. D., 1996, ApJ, 4, 285
- [8] Bednarek, W., and Idec, W., 2011, MNRAS, 414(3), 2229, arXiv:1011.4176v2
- [9] Wilson-Hodge, C. A., et al., 2011, ApJL, 727, L40+, arXiv:1010.2679v2