A Surface Stacking Fault Energy Approach to Predicting Defect Nucleation in Surface-Dominated Nanostructures
Abstract
We present a surface stacking fault (SSF) energy approach to predicting defect nucleation from the surfaces of surface-dominated nanostructure such as FCC metal nanowires. The approach leads to a criteria that predicts the initial yield mechanism via either slip or twinning depending on whether the unstable twinning energy or unstable slip energy is smaller as determined from the resulting SSF energy curve. The approach is validated through a comparison between the SSF energy calculation and low-temperature classical molecular dynamics simulations of copper nanowires with different axial and transverse surface orientations, and cross sectional geometries. We focus on the effects of the geometric cross section by studying the transition from slip to twinning previously predicted in moving from a square to rectangular cross section for nanowires, and also for moving from a rhombic to truncated rhombic cross sectional geometry for nanowires. We also provide the important demonstration that the criteria is able to predict the correct deformation mechanism when full dislocation slip is considered concurrently with partial dislocation slip and twinning. This is done in the context of rhombic aluminum nanowires which do not show a tensile reorientation due to full dislocation slip. We show that the SSF energy criteria successfully predicts the initial mode of surface-nucleated plasticity at low temperature, while also discussing the effects of strain and temperature on the applicability of the criterion.
keywords:
Nanowire , surface stacking fault , twinning , slip1 Introduction
One of the fundamental mechanical properties of a material is its yield strength, or the maximum amount of load a material can take before sustaining irreversible plastic deformation, and eventually failure or fracture. In metals, because the unit plastic deformation mechanism is the dislocation, researchers have focused on developing models to predict when a metal will yield via dislocation nucleation, and therefore what the yield strength of the metal will be.
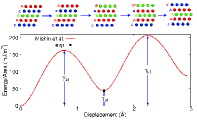
Seminal work towards this end was performed by Vitek [1, 2], who formulated a curve of potential energy versus displacement known as the generalized stacking fault (GSF) curve. The curve typically takes a nearly sinusoidal shape [3], in which the energy barrier that must be crossed in order for defect nucleation to occur is called the unstable stacking fault energy (see Fig. 1). Upon crossing the barrier, an equilibrium lattice spacing that does not correspond to the bulk equilibrium structure can be found, which corresponds to an intrinsic stacking fault (ISF). The resulting excess energy as compared to the bulk equilibrium for this configuration is called the intrinsic stacking fault energy . In the case of face-centered cubic (FCC) metals, the displacement axis of the GSF curve is along the direction as this is the slip direction for partial dislocations in an FCC crystal.
The ideas underlying the GSF have been utilized for various predictions regarding nanoscale plasticity over the years, and have also formed the basis for recent theories used to predict whether defect nucleation via twinning or slip will occur. These theories originate from the seminal work of Rice [4], who formulated a model of dislocation nucleation from a crack tip. Specifically, Rice considered the competition between crack tip yielding via dislocation nucleation as compared to brittle fracture by comparing the energy needed to create new fracture surfaces to the energy barrier to be overcome () in order for ductile fracture to occur. Rice’s ideas were extended by Tadmor and Bernstein [5] and Bernstein and Tadmor [6] to consider the competition between dislocation nucleation and twinning at a crack tip. However, these theories all consider bulk materials, and do not include surface effects, which are critical for plasticity in low-dimensional nanostructures such as nanowires [7, 8, 9]. Other theories concerning the twinning versus slip competition in nanowires have recently been summarized in the excellent review of Weinberger and Cai [9].
There has been considerable success, as demonstrated above, in applying the GSF to predicting, at an atomistic level, defect nucleation in bulk materials. However, the validity of the GSF for predicting defect nucleation from the surfaces of nanostructures such as nanowires has not been demonstrated to-date.
Nanowires are an important class of low-dimensional nanostructures that have been extensively studied in the past ten or so years [10]. Because they are one-dimensional in nature, and because they are characterized by a large surface area to volume ratio, their transverse surfaces have been found to play a critical role in controlling their operant inelastic deformation mechanisms. The deformation mechanisms of metal nanowires have been studied in detail recently, primarily through classical molecular dynamics (MD) simulations. While more extensive reviews on the deformation and plasticity of metal nanowires have recently appeared [8, 9], we highlight here those works that are particularly relevant to the present work, i.e. those which demonstrate the unexpected surface-mediated inelastic deformation mechanisms in nanowires that motivate the present work.
One important finding was that the transverse surfaces have a direct, first order effect on the operant inelastic deformation mechanism [7] of metal nanowires. This work [7] also demonstrated that traditional notions used to predict deformation bulk mechanisms such as the Schmid factor may not be able to capture the surface-dominated mechanisms observed in nanowires. Another important finding was that the geometry of the nanowire cross section also has a direct effect on the operant inelastic deformation mechanism of nanowires [11, 12, 13]. Ji and Park [11, 12] elucidated this by considering the deformation of copper nanowires with cross sectional geometries varying from square to rectangular. They found that while square nanowires yielded by nucleation and propagation of full and partial dislocation slip, rectangular nanowires yielded by nucleation and propagation of twins. A similar conclusion was found by Leach et al. [13], who studied the effects of truncating a rhombic cross section on the deformation mechanisms of silver nanowires. While fully rhombic cross section nanowires were observed to reorient in tension via nucleation and propagation of twins to a orientation [14, 15], truncated rhombic nanowires were found to fail via nucleation and propagation of partial dislocations, while pentagon cross section nanowires were also found to fail via nucleation and propagation of partial dislocations.
These MD studies collectively demonstrate that a predictive model of surface-nucleated incipient plasticity should account for loading mode (i.e. tension or compression), transverse surface orientation, nanowire axial orientation and the geometry of the nanowire cross section. It is worth noting that while the experimental literature on deformation mechanisms in metal nanowires is quite sparse compared to the fully populated literature on MD simulations, evidence of the effects discussed above has emerged. For example, the brittle nature of deformation and fracture of pentagonal silver nanowires was recently demonstrated by Zhu et al. [16]. Similarly, rhombic cross section gold nanowires were observed to undergo long-ranged twin migration and propagation, enabling a tensile-stress-induced reorientation to square cross section nanowires [17]. In contrast, pristine hexagonal cross section copper nanowires were observed to undergo brittle fracture by Richter et al. [18], which suggests that the cross sectional geometry of the nanowires is in fact a critical factor controlling the inelastic deformation mechanism.
Outside of classical MD simulations, there have also been atomistic approaches based on classical stability theory, in which defect nucleation at the surfaces of nanostructures occurs when either the determinant of the Hessian becomes negative [19], or when the change in potential energy from one configuration to another decreases [20]. However, both of these approaches were for defect nucleation from infinitely large surfaces attached to semi-infinite bodies, and therefore may not hold predictive power for defect nucleation from the surfaces of one-dimensional nanowires. Other researchers have also utilized energy landscape exploration techniques to investigate the nucleation barriers that must be overcome for specific plastic deformation mechanisms to occur [21, 22, 23]. These approaches, while insightful, have also not yielded a generic and predictive capability that correlates the observed incipient plastic deformation mechanism to the nanowire size, cross sectional geometry, axial and surface orientation.
Therefore, we present in this work a generalized stacking fault criteria for surfaces. The work is based upon the classical GSF approach of Vitek [1, 2], though applied to finite domain nanostructures such as nanowires; we note that the the bulk GSF-like criteria of Bernstein and Tadmor [6] was used by Liang and Zhou [24] to explain the deformation mechanisms of rhombic NWs, though again, the criteria of Bernstein and Tadmor [6] did not include surface effects. Ideas very similar to the ones presented in this manuscript were discussed by Leach [25] in a Ph.D. thesis, though no work along these lines was published. We demonstrate that because this approach accounts for all features discussed above, i.e. loading mode, transverse surface orientation, axial orientation and cross sectional geometry, it is applicable to a wide range of metal nanowire geometries and loading modes. We illustrate the proposed approach as compared to companion benchmark MD simulations.
2 Methodology
For all MD simulations performed in this work, the interaction between copper atoms is described using the embedded atom method (EAM) [26], using the potential developed by Mishin et al. [27]. In the EAM, the total energy of the system is expressed in terms of the summation over each atom ,
| (1) |
where is the total number of atoms. Atom is embedded in its position by the first ‘embedding’ term with respect to the electron density at this position. The second term provides the repulsive force between atom and its neighbors, which helps to stabilize the whole structure. The EAM potential of Mishin et al. [27] was chosen due to its accuracy in capturing the stacking fault and surface energies of copper.
All MD simulations were performed using the publicly available simulation code LAMMPS [28, 29], while the OVITO package was used for visualization [30]. In the MD simulation, the system is first thermalized at a constant temperature by the Nóse-Hoover [31, 32] heat bath for 100 ps. Free boundary conditions were applied along the two lateral directions of the nanowire by introducing a large vacancy space in the simulation box along these two directions. Along the axial direction, one end of the nanowire was fixed while the other was free. Tensile strain was then applied, similar to previous works [33], by adding a ramp velocity that scaled linearly from zero at the fixed end to a maximum value at the free end. The added velocity profile results in a strain rate of s-1, which is a typical value in MD simulations, and which does not preclude the generation of twins, full or partial dislocations, as shown in previous works [7, 11, 12, 13, 14, 15].
2.1 Bulk GSF Energy Curve Calculation
For bulk FCC copper, the GSF energy curve is calculated using standard procedures [3]. Specifically, the simulation block is rectangular with its three orthogonal coordinate directions along the , , and lattice directions. Periodic boundary conditions are applied in the and directions, while free boundary conditions are applied in the direction. The structure is divided into two halves by a plane. These two halves are sheared with respect to each other along the direction using small displacement increments. The total potential energy () of the structure is recorded at each shearing displacement, while the atoms are allowed to relax in the direction during the shearing process. The GSF energy is then calculated from , where is the change in the total potential energy due to the relative displacement between two halves and is the area of the shearing plane.
Fig. 1 shows the GSF energy curve for bulk copper. The top inset in the figure demonstrates the evolution of the atomic configuration at the shearing interface during the relative displacement of the two halves of the crystal. An intrinsic stacking fault (ISF) occurs at the partial Burgers vector with , while an unstable stacking fault (US) occurs at the displacement of . Subsequent shearing results in the second peak in the bulk GSF energy curve, which corresponds to the unstable twinning (UT) energy. As expected, good agreement in the ISF energy is obtained between the Mishin et al. [27] potential (44.5 mJ/m2) and experiments (45.0 mJ/m2) [34].
2.2 Surface Stacking Fault Energy Curve Calculation
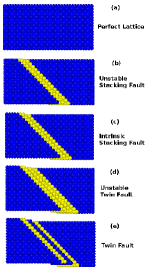
The surface stacking fault (SSF) energy curve for unstrained nanowires can be calculated via the following two steps. First, the nanowire is relaxed to a minimum energy configuration. During this process, surface atoms contract inwards towards the bulk atoms to maximize their electron density. Second, the SSF energy curve for the twinning fault of the nanowire can then be obtained through the process shown in Fig. 2, where the CuNW in (a) is sheared rigidly along a plane in the direction. Unlike in the bulk case, the two blocks of atoms comprising the nanowire are not allowed to relax in the nanowire case. This is primarily due to the difficulty in constraining the nanowire relaxation to occur only in the direction, as in the bulk case. However, as we demonstrate below, this small approximation does not degrade the accuracy or utility of the SSF curves. As the strain increases, the configuration of the unstable stacking fault is reached in (b), followed by the formation of an ISF in (c). After the first ISF is formed, the deformation continues to shear a neighboring plane in the same direction, resulting in the formation of the second unstable twinning fault seen in (d). Finally, the formation process finishes with the twinning fault in (e). Similar to the bulk case, the SSF energy for nanowire here is then calculated from .
We also calculate the SSF energy curves for axially strained nanowires, for reasons that we explain in detail in the discussion of the numerical examples. For these SSF curves, the nanowire is strained axially in increments of 0.1%, where the atoms are allowed to relax after the two ends of the nanowire are fixed at the new length. From these energy minimizing positions, the shearing process described above and illustrated in Fig. 2 is performed to extract the SSF energy curve for the prescribed axial strain.
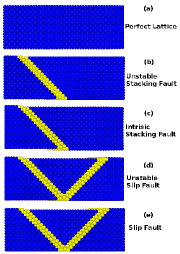
Fig. 3 demonstrates the formation process of a slip fault. The production of the first ISF from (a) to (c) is the same as the formation process of the twinning fault shown in Fig. 2, so the SSF energy curve are the same for twinning and slip faults up to the occurrence of the first ISF in Fig. 3(c). The slip formation continues by generating a second ISF, where the nanowire is sheared along another plane along its corresponding direction. The slip fault is formed in (e). The SSF energy for the slip fault is also calculated from the change of the total potential energy in the structure.
The SSF energy curves for twinning and slip deformation pathways are the same up to the emergence of the first ISF. Afterwards, these two SSF energy curves start to differ. At the second unstable stacking fault, if the twinning SSF energy is lower than that of the slip deformation, then the twinning deformation will be the energetically favored pathway during the inelastic deformation of this system. Otherwise, slip will be the energetically favored pathway.
Thus, the basis of the SSF-based defect prediction criteria is to compare the energetic cost to nucleating a slip defect, or a twinning defect as calculated using the SSF energy curve. If the energetic cost for slip is larger than twinning, then the prediction is that twinning will occur first. Conversely, if the energetic cost for twinning is larger than slip, then the prediction is that slip will occur first. In this way, the energy barrier between the twinning and the slip deformation in the SSF energy curve can be used as a criteria to predict the energetically favorable plasticity mechanism during the deformation of the nanowire.
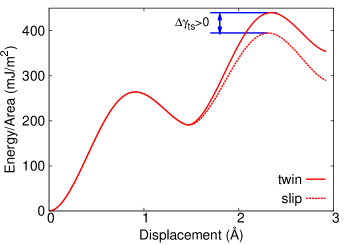
The criteria is explicitly demonstrated in Fig. 4 for a CuNW of dimension lattice constants, where the SSF energy curves for twinning and slip are compared. In Fig. 4, the energy barrier (), which is the energy difference between the second peaks of the unstable twinning and slip SSF curves, is also displayed. Therefore, for this specific example, the criteria predicts that the initial plastic deformation event will be slip deformation, as the energy barrier has a positive value.
We should note that the energetics of the SSF deformation path depends on where along the nanowire the second partial occurs. In some cases, the energy will be lower if the second partial occurs close to the first partial dislocation. Otherwise, if the two partials in the slip process occur at different places along the nanowire, then the SSF energy curve for slip deformation will be the same as for the twinning deformation.
3 Results
As shown below, we consider two numerical examples. The first considers a tensile loading-induced transition from slip to twinning that was previously predicted in CuNWs [11] when the cross sectional geometry changed from square to rectangular. The second considers a tensile loading-induced transition from twinning to slip that was previously predicted in AgNWs [13] in going from a rhombic to truncated rhombic cross sectional geometry.
We emphasize that these examples were not chosen arbitrarily. Specifically, it has been established in the literature that defect nucleation in nanowires is dependent, to varying degrees, on the Schmid factor, the (bulk) GSF energy, and the orientation of the transverse surfaces. In fact, a very lucid and detailed analysis of MD simulations of nanowire plasticity, and the ability of these three key factors in predicting the observed deformation mechanisms, was recently performed by Weinberger and Cai [9]. In that work, it was noted that while it is known that the three factors are important, a predictive model that incorporated all three effects is currently lacking.
In view of this, the examples discussed below were chosen specifically because they show a transition in the operant deformation mechanism that cannot be captured by bulk deformation measures such as the Schmid factor, which is purely geometric and does not capture surface effects [7], and the bulk GSF energy, which again neglects surface effects. The effects of side surface are important, but only seen in the case of the rhombic NWs, which exhibit a change in the initial surface structure with increasing truncation of the cross sectional geometry. As will be illustrated below, the SSF model does account for changes in initial surface structure, but because it combines a variety of effects (changes in cross sectional geometry, surface orientation, axial orientation and size) into a single constant (the SSF curve), further investigation will be required to delineate each of these individual effects on the observed transition in deformation mechanism.
3.1 Square to Rectangular NWs
The rationale for the simulations in this section are to investigate the ability of the proposed SSF criteria to capture the transition from slip to twinning-dominated deformation that was observed in earlier MD simulations [11] when the cross section of copper nanowires (CuNWs) changed from square to rectangular. We perform such simulations, while calculating the SSF energy curves for both twinning and slip deformation pathways. These SSF energy curves are then used to predict for the favored deformation pathway in the CuNWs. Concurrent low-temperature (0.1K) MD simulations are performed to monitor the deformation pathway during the inelastic deformation of the CuNWs under tension. We will validate the SSF criteria by comparing the deformation pathway predicted by the SSF energy calculations to that observed in the MD simulations.
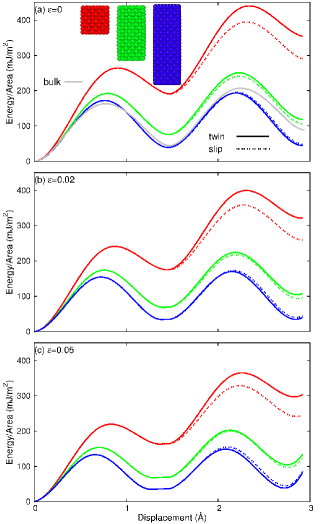
The three nanowires studied had size =(40, 4, 4), (40, 4, 8), and (40, 4, 12) cubic lattice units (CLU), where the CLU= Å is the lattice constant of FCC copper. All three CuNWs had the same axial orientation along the direction, with four side surfaces. Fig. 5 (a) shows the SSF energy curves of the undeformed CuNWs. For the two CuNWs with 4 and 8, the deformation energy required for slip is lower than that for the twinning. For , the SSF energy curves for the twinning and slip pathways are almost indistinguishable, which implies that either twinning or slip could occur.
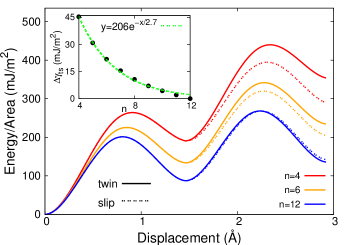
We also examined size effects on the SSF curve in square CuNWs of dimension with 4, …, 12, with the results summarized in Fig. 6. Our calculations show that for all of this set of square cross-section CuNWs, the deformation mechanism is always predicted to be slip, so the preferred deformation pathway is size-independent. However, with increasing , the energy barrier difference between slip and twinning deformation decays exponentially, which suggests that an exponential decay is a characteristic property for surface or edge effects with regards to the deformation mechanism.
We also show the SSF energy curves for all the three CuNWs with strain and 0.05 in Figs. 5 (b) and (c), where we emphasize that these strains are below the yield strain of all CuNWs. By performing the SSF calculation on the tensile-strained nanowires, it is clear that the strain has no effect on the square CuNW (40,4,4), where slip remains the preferred deformation mechanism.
In contrast, the difference in the energy barrier for twinning and slip in the CuNW (40, 4, 8) becomes very small at , with the SSF energy for slip being slightly lower than twinning. We have also calculated the SSF energy curve for CuNW (40, 4, 8) with even larger tensile strains, and observed similar trends, i.e that the energy for slip is always very close to but slightly lower that for twinning. However, as the cross sectional geometry becomes even more rectangular as for the CuNW (40,4,12) case, it is seen that the twinning pathway energy barrier becomes progressively smaller as strain increases than that for slip. These results are in agreement with the MD simulation results of Ji and Park [11], who predicted the slip to twinning transition as the nanowire cross sectional geometry transitioned from square to rectangular. The energy barriers between twinning and slip deformation for the square to rectangular CuNWs are summarized in Table 1.
| structure | square to rectangular | rhombic with truncation level | ||||||
| 4 | 8 | 12 | 0 | 1 | 2 | 3 | 4 | |
| 0.0 | 45.3 | 9.6 | -1.5 | -17.2 | -9.3 | 0.1 | 24.6 | 26.1 |
| 0.02 | 41.2 | 6.6 | -3.2 | -19.5 | -12.1 | -4.2 | 18.7 | 21.8 |
| 0.05 | 36.2 | 2.6 | -6.0 | -23.3 | -17.2 | -10.1 | -7.7 | 6.4 |
We verify the predictions of the SSF curves in Fig. 5 by performing MD simulations of the tensile deformation of CuNWs. Because of the strain-induced evolution in the predicted deformation mechanism seen in Fig. 5, we use the SSF energy calculated from a strained CuNW in Fig. 5(c) to predict the deformation pathway we expect to see in the MD simulations. From Fig. 5 (c), the energetically preferred deformations predicted by the SSF energy are slip, slip/twinning, and twinning for the three CuNWs with 4, 8, and 12. For , two deformation pathways can occur simultaneously due to their close SSF energy curves, and thus our SSF calculation predicts a transition from slip to twinning deformation in CuNWs with increasing width to height ratio .
Fig. 7 shows the configuration of the CuNW (40, 4, 4) under strain at 0.1 K. The top image is colored according to the potential energy per atom, while the bottom image is colored by the centrosymmetry parameter. Only atoms with centrosymmetry parameters within the color bar are shown in the bottom image. No twinning deformation is observed in the deformed structure, while slip deformations can be observed. This MD simulation result is therefore consistent with the prediction by the SSF energy in Fig. 5 (c).
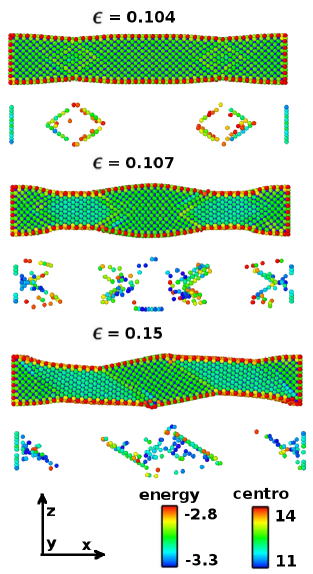
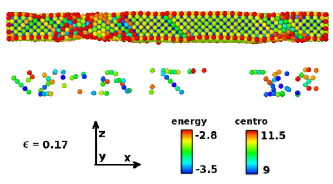
Fig. 8 shows the evolution of the configuration for the CuNW (40, 4, 8) from MD simulation at 0.1 K. With increasing tension, the CuNW starts to yield at , where the initial yield mechanism is partial dislocation slip from the top and bottom surfaces that meet at the center of the nanowire to form a rhombic dislocation structure as illustrated by the bottom image for . Under slightly higher tension, , the rhombic deformation shapes break open and propagate along the axial direction of the nanowire. At , a transition from slip to twinning is observed. These MD simulation results are consistent with the SSF energy prediction in Fig. 5 (c).
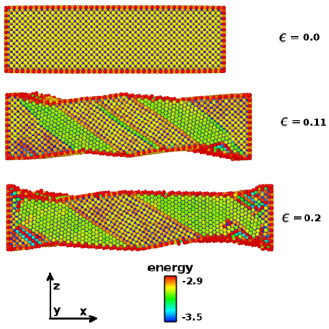
Fig. 9 shows the deformation of the CuNW (40, 4, 12) under tensile loading at 0.1 K. Twinning is found to be the sole deformation mechanism throughout the MD simulation. Specifically, there are several observable twin boundaries in separate regions of the nanowire at . With increasing strain , these twin boundaries separate to form larger twinned regions in the nanowire. The MD simulations again verify the prediction from the SSF energy in Fig. 5 (c).
To explain the observed twinning, we note that all transverse surfaces are initially . If the cross section is square, there is no asymmetric (surface) energetic driving force; instead, slip systems on alternating planes are activated which keeps the cross section square. In contrast, wires with a rectangular cross section have two transverse surfaces that have a majority of the available transverse surface area. We note that the twinning occurs on the larger surfaces, which allows both to reduce their surface area by reorienting to the close-packed surface. The asymmetry of the cross sectional geometry thus results in a sufficient surface energetic driving force for the larger surfaces to reduce their area and therefore their energy through reorientation via twinning-dominated deformation.
Overall, we have shown in this section that the SSF criteria can correctly predict the previously observed transition from slip to twinning in CuNWs as the cross sectional geometry evolves from square to rectangular, particularly if strain effects on the SSF curve are accounted for.
3.2 Rhombic NWs
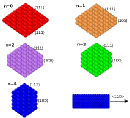
The rationale for the simulations in this section are to investigate the ability of the proposed SSF criteria to capture the transition from slip to twinning-dominated deformation that was observed in earlier MD simulations [13] when the cross section of silver nanowires changed from rhombic to truncated rhombic. We investigate this phenomenon in the present work for copper nanowires (CuNWs). The truncations considered are shown in Fig. 10, where the cross section is truncated with truncation level 0, 1, 2, 3, and 4. For , all side surfaces are planes, with the length of this set of CuNWs being 10 nm. The CuNW is truncated at the two lower apex, resulting in the exposure of two side surfaces. With increasing truncation level , the area of the exposed surfaces increases. In the following, we will first present the SSF energy calculation for this set of CuNWs, followed by the MD simulation results.
The SSF energy curves for all five truncated rhombic CuNWs are shown in Fig. 11 (a) for structures without strain. The curves for twinning are displayed by solid lines while the curves for slip are displayed by dashed lines. All curves are colored according to the corresponding cross section as shown in the inset of Fig. 11 (a). With increasing truncation levels from 0 to 4, there is a transition in the relationship between the deformation energy of twinning and slip pathways. The transition happens at , where the energy barrier difference between twinning and slip pathways is almost zero.
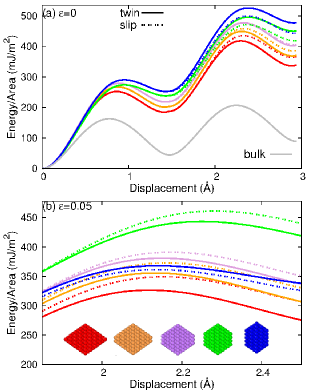
As discussed above for the square to rectangular cross section nanowires, accounting for the effects of strain is important to accurately apply the SSF energy criteria. We thus show in Fig. 11 (b) the SSF energy for these five CuNWs under tensile strain . For clarity, only curves around the second extreme values in Fig. 11(a) are shown. We will use Fig. 11 (b) to predict the preferred deformation pathway for the truncated rhombic CuNWs. From these SSF energy curves, the deformation energy for twinning is lower than that of slip in rhombic CuNWs with truncated level . As a result, the twinning deformation is predicted to be the preferred pathway of these three CuNWs. The deformation energy for twinning is higher than that of the slip in rhombic CuNWs with truncated level . It is thus predicted that the slip deformation is the preferred pathway in these two () CuNWs. The energy barriers between the twinning and slip deformation mechanisms for rhombic NWs with varying truncation level are summarized in Table 1. We will perform MD simulations to show the transition from twinning to slip in the deformation pathway for this set of CuNWs with increasing from 0 to 4. Similar MD simulations can be found in the work by Leach et.al [13].
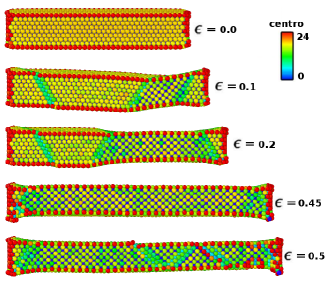
Fig. 12 shows the tensile deformation at 0.1 K in the MD simulation for the rhombic CuNW with truncation level . The only observed deformation mechanism is twinning, which is generated at lower strain and then propagates along the nanowire length under further tensile loading. The long-range propagation of the twin boundaries reorients the side surfaces from to , while the axial orientation reorients from to with a corresponding change in cross sectional geometry from rhombic to square. These simulation results are consistent with earlier MD simulations focused on nanowire shape memory and pseudoelasticity [14, 35, 15], and more recently the work of Seo et al. [17], who gave the first experimental demonstration of such long-ranged twin boundary propagation and the subsequent reorientation.
After the propagation of the twinning boundaries along the nanowire length, the reorientated nanowire undergoes yielding via slip at . We similarly find through the MD simulations that twinning is the only deformation mechanism observed during the tensile deformation of the rhombic CuNWs with truncated levels 1 and 2. These MD simulation results are in good agreement with the SSF energy shown in Fig. 11 (b).
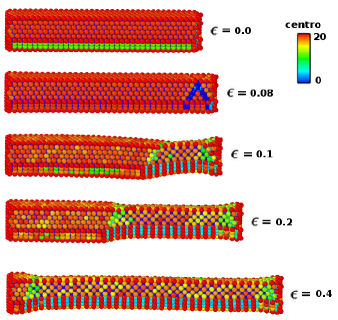
Fig. 13 shows the MD simulation for the tensile deformation of the rhombic CuNW with truncation level at 0.1 K. In the second image, copper atoms within the deformed region are removed, so that a slip deformation can be clearly observed near the right boundary at strain . With increasing tensile strain, this slip deformation turns into a twinning deformation as shown in the third image at . The twinning deformation is then propagated along the nanowire and the CuNW is reorientated from a rhombic CuNW into a square nanowire with two {100} surfaces and two {110} surfaces. We note that the reorientation of the side surfaces in going from the rhombic to square nanowire is as follows: and .
An important point to make here is that the MD simulations in Fig. 13 demonstrate that while the SSF energy calculation accurately predicts the initial deformation mechanism in the nanowires, it does not yield accurate predictions of subsequent plastic events at larger strains. This illustrates one limitation with the SSF approach, i.e. if the initial deformation mechanism is not predictive, which then results in incorrect predictions of the mechanical response of the nanowire. In the case shown in Fig. 13, the twinning-driven reorientation does occur when in fact the initial defect pattern suggests that it should not. This is not surprising considering that the SSF calculation is done for defect-free, strained structures without any pre-existing stacking faults or twins. Furthermore, we note that other defect nucleation theories, namely the seminal bulk GSF criteria, would also exhibit this shortcoming if the overall mechanical response is predicted based only on the initial nucleation event.
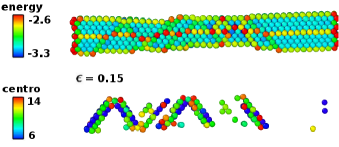
Fig. 14 shows the slip-dominated deformation of the rhombic CuNW with truncation level from MD simulation at 0.1 K, where the top image is colored according to the potential energy per atom while the bottom image is colored by the centrosymmetry parameter. The slip deformation and the absence of any twinning is clearly observed in the bottom image. The MD simulation is consistent with the SSF energy calculation, which predicts the slip deformation to be the preferred pathway in this CuNW.
Before concluding this section, we provide an energetic explanation for the twinning to slip deformation transition in the truncated rhombic CuNWs. During the deformation of the truncated rhombic CuNWs, the four {111} surfaces are reoriented to {100} surfaces, while the two {100} surfaces are reoriented to {110} surfaces. Furthermore, it is important to note that in both cases, the reoriented surface has a higher surface energy than the initial surface orientation. Because of this, we calculate the surface energies for the , and surfaces to be 1242.3, 1352.6, and 1480.5 mJ/m2, which are in agreement with the values published by Mishin et al. [27]. Based on these values, it can be seen that there is an energetic penalty of 109.3 mJ/m2 to reorient a {111} surface into a {100} surface. Similarly, there is a 127.9 mJ/m2 energetic penalty for reorienting a {100} surface into a {110} surface. In both cases, these energetic differences represent energy barriers that must be overcome by the twinning deformation. As the truncation level increases, a greater proportion of {100} surface area is exposed with a similar reduction in {111} surface area. This is important because, as discussed above, the energetic cost of reorienting a {111} surface to {100} is lower than the cost of reorienting a {100} surface to {110}. This is why the energetic barrier to twinning deformation increases as the truncation of the rhombic CuNWs increases.
In contrast, when slip is the operant deformation mode, no lattice reorientation is observed in the truncated rhombic CuNWs. In this case, the energy that is added to the system results from the imperfect stacking arrangement in the NW in conjunction with the surface step that results at the free surface due to the stacking fault. The energetic barrier for this process also changes with increasing truncation, but not as dramatically as it does during the twinning-dominated deformation mode. As a result, there is a predicted twinning to slip transition in the deformation mechanism as discussed above.
3.2.1 Discussion on Rhombic NWs
At this point, it is important to discuss the current SSF predictions for the deformation of rhombic CuNWs with the recent experiments of Seo et al. [17], who observed the reorientation of AuNWs via long-ranged coherent twin propagation. These experimental results were in contrast to earlier MD predictions for the deformation of AuNWs [14, 24], which predicted that due to the eventual nucleation of full dislocations, the reorientation would not be observed in AuNWs. The relevant implication for the SSF criteria proposed in this work is that it, like the seminal bulk GSF criteria before it, depends crucially on the ability of the interatomic potential to correctly capture the details of the defect nucleation mechanism. Thus, similar to all other MD simulations, inaccuracies in the interatomic potential will lead to erroneous SSF deformation mechanism predictions.
Another important factor to consider is thermal effects on the SSF predictions. To study temperature effects on the deformation pathway, we show in Fig. 15 the structural evolution from MD simulation for the truncated rhombic CuNW with at 10 K. We find that the deformation mechanism indeed exhibits stochastic behavior. The only difference among these three simulations shown in the figure is the initial conditions, which result from different initial distributions of velocities, all satisfying the Boltzmann distribution at 10 K. From the simulation shown in the top panel, twinning is found to be the only deformation mechanism, where the twinning leads to the same reorientation previously observed, for example, in Fig. 12, and in general for all CuNWs with truncation levels at low temperature 0.1 K. In the simulation shown in the middle panel, both twinning and slip deformations are found, while in the simulation shown in the bottom panel, only the slip deformation is observed. In the first two cases, the nanowire can undergo a large strain (typically ), indicating twinning to be the major deformation pathway; while in the last case, the nanowire fractures at much lower strain (typically ), which indicates slip as the dominant deformation pathway.
The MD simulation at 10 K thus illustrates that the SSF energy calculation cannot predict the deformation pathway at higher temperature, which can be understood from an energetic perspective. Fig. 11 (b) shows that the energy barrier between twinning and slip is about mJ/m2 at the second unstable stacking fault. Most of this energy comes from those copper atoms sitting in the two planes that are sheared along the direction to calculate the SSF energy. The energy barrier can further be distributed onto each copper atom in these two planes by multiplying the area per atom in this plane: i.e , with Å2, where the factor of 2 is needed to divide the energy barrier onto one of the two shearing surfaces. Some simple algebra then gives meV.
Besides , there is another important energetic contribution in this system at finite temperature, i.e the thermal vibration energy. According to the equipartition theorem, the vibrational energy of each degree of freedom at temperature is , where is the Boltzmann constant. The thermal energy for each atom is , which is 1.3 meV at 10 K. We can see that the two energy scales and are on the same order. The thermal vibration reflects a random movement of each copper atom, while the GSF energy curve predicts a deterministic movement. Since the energy scales of these two movements are on the same order, the random movement from thermal vibrations can counteract the deterministic motion imposed in calculating the SSF energy, and is the reason why the SSF prediction fails at higher (i.e. non-zero) temperature. In contrast, at the low temperature 0.1 K that we have used for the majority of our MD simulations, the thermal vibrational energy is about two orders smaller than the SSF energy barrier , so the thermal-induced random movement can be safely ignored, resulting in accurate predictions from the SSF energy.
Finally, we comment on recent experiments that may encourage new interpretations of surface-mediated plasticity. First, we note the recent experiments of Sedlmayr et al. [36], who studied AuNWs with the same hexagonal cross section as the CuNWs previously studied by Richter et al. [18]. In contrast to the brittle fracture observed by Richter et al. [18], both brittle and ductile behavior was observed by Sedlmayr et al. [36]. In contrast, exclusively brittle fracture was observed in pentagonal AgNWs by both Zhu et al. [16] and also by Filleter et al. [37]. These results point to the likelihood of random stochastic effects, such as surface roughness, in yielding seemingly contradictory experimentally observed deformation mechanisms in NWs having the same geometry, or the same geometry and material. Support for such a stochastic hypothesis was also shown through MD simulations for different initial random velocities (and the same temperature) in Fig. 15. The key implication is that the SSF results shown in the present work were conducted on nanowires with idealized geometries, no surface roughness, and no stochastic effects due to being at 0 K; these differences may lead to different predictions for the deformation mechanisms and mechanical properties than are seen experimentally.
3.3 Universality of the surface stacking fault energy criteria
In the above, we have demonstrated the agreement between the proposed SSF criteria and the corresponding MD simulations. However, we considered only partial dislocation slip and twinning as the possible deformation mechanisms and in the calculation of the SSF energy curves. To demonstrate the universality of the SSF criteria, it is important to demonstrate that it can also predict full dislocation slip, particularly when full dislocation slip is enabled concurrent to both partial dislocation slip and twinning. The importance of capturing full dislocation slip emerges naturally from our previous study of rhombic nanowires, where earlier MD simulation results by Liang and Zhou [24] showed that in contrast to copper, rhombic aluminum nanowires do not undergo the tensile stress-induced reorientation from to due to the nucleation of full dislocations.
If more than two deformation pathways, i.e. considering full dislocation slip in addition to partial dislocation slip and twinning, is necessary, then SSF criteria can be naturally extended. Specifically, we calculate the SSF curves for all three deformation mechanisms, and then use the same prediction criteria as before in that the deformation mechanism with the lowest SSF energy at the second unstable stacing fault is the energetically favored pathway for the initial plastic deformation event.

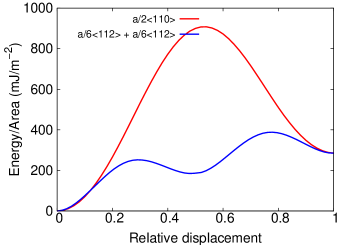
Fig. 16 displays the formation of a full dislocation via two partials in the rhombic CuNW with the plane slipping in the direction. Of course, the full dislocation can also be formed through the slipping of the plane in the direction, as these two deformation paths result in the same full dislocation, since . Fig. 17 shows the SSF curves for the full dislocation from these two different paths. Not surprisingly, it shows that the former deformation pathway comprised of two partials has much lower energy than the single full dislocation, so it will be the favored path. Therefore, in the following, the SSF energy curves corresponding to the full dislocation are calculated by the summation of two partials, which is obtained by shifting the plane in the direction.
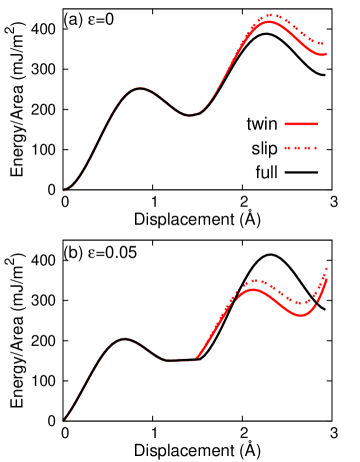
Fig. 18 shows the SSF energy curves for the rhombic CuNW corresponding to the twinning deformation, the slip deformation, and the full dislocation. While all three deformations have the same SSF curve before the first intrinsic stacking fault, they separate afterwards. Furthermore, as before, we find that tensile strain has an important effect on the SSF energy of the full dislocation. In panel (a), we show that the full dislocation has the lowest SSF energy at the second unstable stacking fault at zero tensile strain. However, panel (b) shows that at 5% tensile strain, the SSF energy of the full dislocation becomes the highest among the three deformation mechanisms, which makes it the least energetically favorable. As has already been discussed, the SSF energy should be applied at a non-zero strain state in order for the most accurate predictions of the favored deformation pathway. Therefore, the SSF energy curves in Fig. 18 demonstrate that twinning is the favored deformation mechanism for rhombic CuNWs with truncation level , because the the twinning deformation has the lowest SSF energy at the second unstable intrinsic stacking fault. This also explains why full dislocations were not observed in our previous MD simulations of rhombic CuNWs.
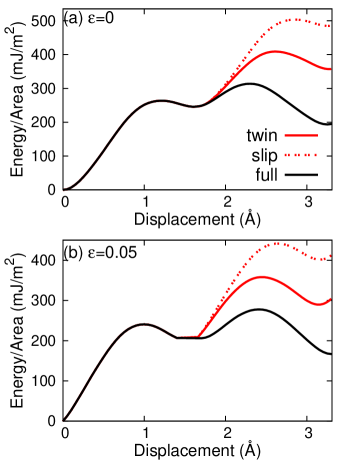
To demonstrate that the SSF calculations can distinguish between the three potential deformation mechanisms, we performed SSF calculations for rhombic aluminum (Al) NWs, where the AlNWs had the same geometric structure as the rhombic CuNWs (i.e. same number of atoms), with the only difference being the larger lattice constant of a=4.05 Åfor Al, and the usage of a different EAM potential [38] that is appropriate for Al. Fig. 19 (a) shows that the SSF energy for the rhombic AlNW is similar as that of the CuNW without strain, in that the full dislocation has the lowest SSF energy curve. However, at 5% tensile strain, we find that the full dislocation still has the lowest SSF energy for the rhombic AlNW, which is different from the trend seen for CuNWs in Fig. 18. From Fig. 19 (b), the SSF criteria predicts the full dislocation to be the favored deformation pathway for this rhombic AlNW, in agreement with the MD simulations of Liang and Zhou [24]. Indeed, Fig. 20 demonstrates that, full dislocations are the initial deformation mechanism in rhombic AlNWs under tensile strain at 0.1 K. This result demonstrates that the SSF criteria can distinguish between full dislocation slip, partial dislocation slip, and twinning to predict the correct deformation mechanism at low temperature.
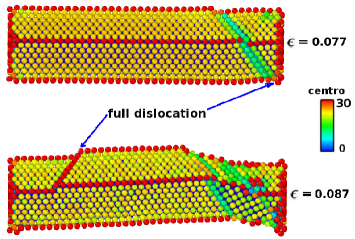
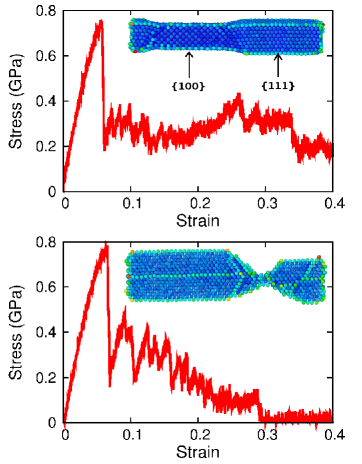
Fig. 21 shows two MD simulations for the rhombic AlNW at 300 K under tensile strain. The only difference between the two simulations in the figure is their randomly prepared initial velocities, which demonstrates the stochastic nature of the deformation process beyond prediction of the initial deformation mechanism, which the surface SSF criteria captures accurately. In the top panel, the NW reorients from the initially rhombic NW into a square cross section NW through the nucleation and propagation of twins. The necking phenomenon induced by the full dislocation is observed in the bottom panel, and is similar to that previously reported by Liang and Zhou [24]. This stochastic effect is similar as what we have observed in Fig. 15 for the CuNW. It again illustrates that the SSF criteria is not suitable for higher temperature, where the thermal vibration energy becomes comparable to or larger than the SSF energy barrier.
4 Conclusions
In conclusion, we have proposed a criteria based on the surface stacking fault (SSF) energy to predict the incipient mode of plasticity in surface-dominated nanostructures such as nanowires. The criteria is based upon whether the unstable twinning energy or unstable slip energy is smaller as determined from the surface stacking fault energy curve. The validity of the idea was demonstrated by comparison with classical molecular dynamics simulations of nanowires that were previously predicted to exhibit a deformation mechanism transition from slip to twinning based on variations of the nanowire cross sectional geometry. Importantly, the SSF criteria was also shown to accurately distinguish between full dislocation slip, partial dislocation slip and twinning when all three deformation mechanisms are considered concurrently. The SSF energy criteria was shown to be most accurate at low temperatures, while strain effects were demonstrated to potentially alter the deformation mechanism from slip to twinning for certain nanowire geometries.
5 Acknowledgements
JWJ thanks Y. C. Zhang and J. H. Zhao for valuable help in the usage of LAMMPS package. We acknowledge helpful correspondence from J. A. Zimmerman at the Sandia National Laboratory. The work is supported by the Grant Research Foundation (DFG) Germany. HSP acknowledges support from the NSF grant CMMI-1036460. All authors acknowledge the insightful comments and suggestions of both anonymous reviewers.
References
- Vitek [1966] Vitek, V.. Thermally activated motion of screw dislocations in BCC metals. Physica Status Solidi 1966;18:687–701.
- Vitek [1968] Vitek, V.. Intrinsic stacking faults in body-centered cubic crystals. Philosophical Magazine 1968;18:773–786.
- Zimmerman et al. [2000] Zimmerman, J.A., Gao, H., Abraham, F.F.. Generalized stacking fault energies for embedded atom FCC metals. Modelling and Simulation in Materials Science and Engineering 2000;8:103–115.
- Rice [1992] Rice, J.R.. Dislocation nucleation from a crack tip: an analysis based on the peierls concept. Journal of the Mechanics and Physics of Solids 1992;40(2):239–271.
- Tadmor and Bernstein [2004] Tadmor, E.B., Bernstein, N.. A first principles measure for the twinnability of FCC metals. Journal of the Mechanics and Physics of Solids 2004;52:2507–2519.
- Bernstein and Tadmor [2004] Bernstein, N., Tadmor, E.B.. Tight-binding calculations of stacking energies and twinnability in FCC metals. Physical Review B 2004;69:094116.
- Park et al. [2006] Park, H.S., Gall, K., Zimmerman, J.A.. Deformation of FCC nanowires by twinning and slip. Journal of the Mechanics and Physics of Solids 2006;54(9):1862–1881.
- Park et al. [2009] Park, H.S., Cai, W., Espinosa, H.D., Huang, H.. Mechanics of crystalline nanowires. MRS Bulletin 2009;34(3):178–183.
- Weinberger and Cai [2012] Weinberger, C., Cai, W.. Plasticity of metal nanowires. Journal of Materials Chemistry 2012;22:3277–3292.
- Xia et al. [2003] Xia, Y., Yang, P., Sun, Y., Wu, Y., Mayers, B., Gates, B., et al. One-dimensional nanostructures: synthesis, characterization, and applications. Advanced Materials 2003;15(5):353–389.
- Ji and Park [2006] Ji, C., Park, H.S.. Geometric effects on the inelastic deformation of metal nanowires. Applied Physics Letters 2006;89:181916.
- Ji and Park [2007] Ji, C., Park, H.S.. The coupled effects of geometry and surface orientation on the mechanical properties of metal nanowires. Nanotechnology 2007;18:305704.
- Leach et al. [2007] Leach, A.M., McDowell, M., Gall, K.. Deformation of top-down and bottom-up silver nanowires. Advanced Functional Materials 2007;17:43–53.
- Park et al. [2005] Park, H.S., Gall, K., Zimmerman, J.A.. Shape memory and pseudoelasticity in metal nanowires. Physical Review Letters 2005;95:255504.
- Liang et al. [2005] Liang, W., Zhou, M., Ke, F.. Shape memory effect in Cu nanowires. Nano Letters 2005;5(10):2039–2043.
- Zhu et al. [2012] Zhu, Y., Qin, Q., Xu, F., Ding, Y., Zhang, T., Wiley, B.J., et al. Size effects on elasticity, yielding, and fracture of silver nanowires: in situ experiments. Physical Review B 2012;85:045443.
- Seo et al. [2011] Seo, J.H., Yoo, Y., Park, N.Y., Yoon, S.W., Lee, H., Han, S., et al. Superplastic deformation of defect-free au nanowires by coherent twin propagation. Nano Letters 2011;11:3499–3502.
- Richter et al. [2009] Richter, G., Hillerich, K., Gianola, D.S., Monig, R., Kraft, O., Volkert, C.A.. Ultrahigh strength single crystalline nanowhiskers grown by physical vapor deposition. Nano Letters 2009;9(8):3048–3052.
- Dmitriev et al. [2005] Dmitriev, S.V., Kitamura, T., Li, J., Umeno, Y., Yashiro, K., Yoshikawa, N.. Near-surface lattice instability in 2D fiber and half-space. Acta Materialia 2005;53:1215–1224.
- Yun et al. [2011] Yun, G., Cao, P., Zimmerman, J.A., Delph, T.J., Park, H.S.. Nonlocal instability analysis of FCC bulk and (100) surfaces under uniaxial stretching. International Journal of Solids and Structures 2011;48:3406–3416.
- Zhu et al. [2008] Zhu, T., Li, J., Samanta, A., Leach, A., Gall, K.. Temperature and strain-rate dependence of surface dislocation nucleation. Physical Review Letters 2008;100:025502.
- Weinberger et al. [2012] Weinberger, C., Jennings, A.T., Kang, K., Greer, J.R.. Atomistic simulations and continuum modeling of dislocation nucleation and strength in gold nanowires. Journal of the Mechanics and Physics of Solids 2012;60:84–103.
- Ryu et al. [2011] Ryu, S., Kang, K., Cai, W.. Entropic effect on the rate of dislocation nucleation. Proceedings of the National Academy of Science 2011;108(13):5174–5178.
- Liang and Zhou [2006] Liang, W., Zhou, M.. Atomistic simulations reveal shape memory of fcc metal nanowires. Physical Review B 2006;73:115409.
- Leach [2007] Leach, A.M.. Atomistic simulations of the mechanical deformation and energetics of metal nanowires. PhD Thesis 2007;:Georgia Institute of Technology.
- Foiles et al. [1986] Foiles, S.M., Baskes, M.I., Daw, M.S.. Embedded-atom-method functions for the FCC metals Cu, Ag, Au, Ni, Pd, Pt, and their alloys. Physical Review B 1986;33(12):7983–7991.
- Mishin et al. [2001] Mishin, Y., Mehl, M.J., Papaconstantopoulos, D.A., Voter, A.F., Kress, J.D.. Structural stability and lattice defects in copper: ab initio, tight-binding, and embedded-atom calculations. Physical Review B 2001;63:224106.
- Plimpton [1995] Plimpton, S.J.. Fast parallel algorithms for short-range molecular dynamics. Journal of Computational Physics 1995;117:1–19.
- Lammps [2012] Lammps, . http://wwwcssandiagov/sjplimp/lammpshtml 2012;.
- Stukowski [2010] Stukowski, A.. Visualization and analysis of atomistic simulation data with ovito - the open visualization tool. Modelling Simul Mater Sci Eng 2010;18:015012.
- Nosé [1984] Nosé, S.. A unified formulation of the constant temperature molecular dynamics methods. Journal of Chemical Physics 1984;81:511–519.
- Hoover [1985] Hoover, W.G.. Canonical dynamics: Equilibrium phase-space distributions. Physical Review A 1985;31:1695–1697.
- Park and Zimmerman [2005] Park, H.S., Zimmerman, J.A.. Modeling inelasticity and failure in gold nanowires. Physical Review B 2005;72:054106.
- Hirthe and Lothe [1982] Hirthe, J.P., Lothe, J.. Theory of Dislocations - Second Edition. Krieger Publishing Company; 1982. ISBN 0-89464-617-6.
- Park and Ji [2006] Park, H.S., Ji, C.. On the thermomechanical deformation of silver shape memory nanowires. Acta Materialia 2006;54(10):2645–2654.
- Sedlmayr et al. [2012] Sedlmayr, A., Bitzek, E., Gianola, D.S., Richter, G., Monig, R., Kraft, O.. Existence of two twinning-mediated plastic deformation modes in Au nanowhiskers. Acta Materialia 2012;60:3985–3993.
- Filleter et al. [2012] Filleter, T., Ryu, S., Kang, K., Yin, J., Bernal, R.A., Sohn, K., et al. Nucleation-controlled distributed plasticity in penta-twinned silver nanowires. Small 2012;8:2986–2993.
- Mishin et al. [1999] Mishin, Y., Farkas, D., Mehl, M.J., Papaconstantopoulos, D.A., Kress, J.D.. Interatomic potentials for monoatomic metals from experimental data and ab initio calculations. Physical Review B 1999;59(5):3393–3407.