Thermal and non-thermal traces of AGN feedback: results from cosmological AMR simulations
Abstract
We investigate the observable effects of feedback from Active Galactic Nuclei (AGN) on non-thermal components of the intracluster medium (ICM). We have modelled feedback from AGN in cosmological simulations with the adaptive mesh refinement code ENZO, investigating three types of feedback that are sometimes called quasar, jet and radio mode. Using a small set of galaxy clusters simulated at high resolution, we model the injection and evolution of Cosmic Rays, as well as their effects on the thermal plasma. By comparing, both, the profiles of thermal gas to observed profiles from the ACCEPT sample, and the secondary -ray emission to the available upper limits from FERMI, we discuss how the combined analysis of these two observables can constrain the energetics and mechanisms of feedback models in clusters. Those modes of AGN feedback that provide a good match to X-ray observations, yield a -ray luminosity resulting from secondary cosmic rays that is about 10 times below the available upper limits from FERMI. Moreover, we investigate the injection of turbulent motions into the ICM from AGN, and the detectability of these motions via the analysis of line broadening of the Fe XXIII line. In the near future, deeper observations/upper-limits of non-thermal emissions from galaxy clusters will yield stringent constraints on the energetics and modes of AGN feedback, even at early cosmic epochs.
keywords:
galaxy: clusters, general – methods: numerical – intergalactic medium – large-scale structure of Universe1 Introduction
Radiative cooling of gas in galaxy clusters is so efficient that most of the hot gas phase in their core ought to be removed on a time scale smaller than the lifetime of the system, producing an inward motion of the cooling gas, a ”cooling flow” (e.g. Fabian et al., 1984). However, dramatic cooling flows are not observed in real clusters, and additional non-gravitational heating mechanisms are likely to keep gas on a higher adiabat (e.g. Kaiser, 1991; Ponman et al., 1999; Lloyd-Davies et al., 2000). It is largely agreed that active galactic nuclei (AGN) are a viable source of energy available for the self-regulation of galaxy clusters. Observations show that the energy associated with AGN in clusters is in most cases sufficient to balance radiative losses in the ICM (e.g. McNamara & Nulsen, 2007, and references therein). However, it is less clear how the energy is released from the compact (kpc) region surrounding the central super-massive BH, to the kpc cooling radius. Very similar problems are encountered in elliptical galaxies (e.g. Sarazin & White, 1987; Ciotti & Ostriker, 1997; Brighenti & Mathews, 2000; Ciotti & Ostriker, 2012). For clusters, an important issue is whether most of the energy input from AGN (or galactic winds) to the ICM has occurred much before the assembly of the clusters via ”pre-heating” (e.g. Bialek et al., 2001; Tozzi & Norman, 2001; Brighenti & Mathews, 2001; McCarthy et al., 2004), or at a low redshift within already formed clusters (e.g. Binney & Tabor, 1995; Churazov et al., 2001; Brüggen & Kaiser, 2002). The first mechanism requires a lower energy budget, with total energies (McCarthy et al., 2008), while the second possibility requires energies in excess of (Mathews & Guo, 2011b). However, there is ample evidence for strong AGN outflows in cool core clusters (e.g. McNamara & Nulsen, 2007, 2012).
Theoretical work suggests that the real evolution of heating in clusters might be a combination of both (Brighenti & Mathews, 2006; McCarthy et al., 2008; Vazza, 2011; Dubois et al., 2012; Short et al., 2012).
Quasar-induced outflows at high-redshift, possibly following mergers of gas rich galaxies, have been observed (e.g. Nesvadba et al., 2006; Dunn et al., 2010; Bhattacharya et al., 2008). At lower redshift, the mechanical work done by X-ray cavities on the surrounding ICM may represent another viable mechanism for heating and mixing the ICM (e.g. David et al., 2001; McNamara & Nulsen, 2007, 2012). Additional mechanisms can modify the energy requirements of AGN feedback, by providing complementary heating/mixing on various scales. The heating from Alfvén waves in cosmic rays (CR) enriched bubbles, and heating from Coulomb losses of CRs and the surrounding thermal ICM is an additional interesting topic of research (Loewenstein et al., 1991; Sijacki et al., 2008; Colafrancesco et al., 2004; Guo & Oh, 2008; Mathews & Guo, 2011a; Fujita & Ohira, 2011).
Thermal conduction can somewhat reduce the energy budget that central AGN have to provide in order to stem cooling flows (e.g. Bertschinger & Meiksin, 1986; Bregman & David, 1988; Narayan & Medvedev, 2001). Magneto-rotational instabilities and heat-flux driven instabilities in the weak and anisotropic cluster magnetic field have been proposed to reduce the cooling of gas (e.g. Quataert, 2008; McCourt et al., 2011). Finally, also major mergers have been suggested as a viable mechanisms to reduce the cooling catastrophe, even if the real efficiency of this mechanism is controversial (Poole et al., 2006; Burns et al., 2008).
Cosmological simulations with radiative cooling, star formation and galactic winds are unable to reproduce the observed profiles of gas temperature, metallicity and entropy in the ICM (e.g. Kravtsov & Borgani, 2012, for a recent review). The most powerful feedback from AGN has been studied with cosmological simulations in the recent past. Several groups successfully implemented a treatment of thermal AGN feedback in cosmological GADGET simulations (e.g. Dalla Vecchia et al., 2004; Sijacki & Springel, 2006; Sijacki et al., 2007; McCarthy et al., 2010; Fabjan et al., 2010). In the aforementioned papers, the growth of BHs at the centres of galaxies is followed using sink-particles, and the energy release from each BH follows from the Bondi-Hoyle accretion rate (”quasar” mode). The energy emitted by the AGN is released by heating up SPH particles surrounding the surrounding ICM. Similar methods have been implemented in AMR grid simulations by Cattaneo & Teyssier (2007) and Teyssier et al. (2011) in the RAMSES code. The creation of ”bubbles” inflated by AGN during their ”radio mode” was simulated by Dalla Vecchia et al. (2004) and Sijacki & Springel (2006) in GADGET. In this case, the energy released by the black hole (BH) is deposited within pairs of bubbles in the form of thermal energy or cosmic ray energy, and exerts mechanical work on the surrounding ICM while buoyantly rising in the cluster atmosphere. Other models of mechanical feedback from AGN have also been implemented, by assigning a ”wind” drift velocity to gas particles surrounding the BH, with velocities in the range km/s (Dalla Vecchia & Schaye, 2008; Fabjan et al., 2010). Dubois et al. (2010, 2011) implemented a scheme to follow bipolar kinetic outflows (”jet” mode) from simulated AGN in RAMSES, monitoring the growth of BHs using the same setup of Teyssier et al. (2011). In the framework of galaxy formation studies, run-time models of radiative and kinetic feedback from AGN in galaxy simulations have been developed by Kim et al. (2011) in ENZO simulations, and by Oppenheimer & Davé (2006) and Gabor et al. (2011) in GADGET simulations.
To date, however, little attention has been paid to the amount of non-thermal energy deposited in the ICM by the various feedback mechanisms. This is an important aspect, since non-thermal emission from galaxy clusters can offer a complementary way of testing and falsifying feedback models. Once accelerated, CR hadrons can accumulate in galaxy clusters (Berezinsky et al., 1997) and produce a non-thermal component that could be detected by -ray observations (e.g. Ackermann et al., 2010). Secondary particles are continuously injected into the ICM via proton–proton collisions, possibly leading to detectable synchrotron radiation (e.g Blasi & Colafrancesco, 1999; Dolag & Enßlin, 2000). The combined analysis of radio observations and -upper limits, however, presently suggests that most of the observed large-scale radio emission in clusters cannot be due to secondary electrons, based on theoretical estimates of the required total energy in CRs (Brunetti et al., 2007; Donnert et al., 2010b; Brunetti, 2009), and to the required values of the magnetic field in the ICM, in conflict with observations (Brunetti et al., 2009; Bonafede et al., 2010; Donnert et al., 2010a; Bonafede et al., 2011; Jeltema & Profumo, 2011).
Therefore, the detection or lack of non-thermal emission from cluster centres may inform us about the energy budget of non-thermal particles, and of the history and modality of previous heating episodes in the ICM. In addition, CR particles may have an important dynamical effect on the ICM (e.g. Ruszkowski & Oh, 2011; Brunetti & Lazarian, 2011b), and they can also affect the evolution of X-ray cavities powered by AGN jets (e.g. Mathews & Brighenti, 2007; Sijacki et al., 2008; Guo & Oh, 2008; Mathews & Guo, 2011a).
In this work we study the observable non-thermal features related to AGN feedback models in a cosmological framework. A few single-object simulations have been used to investigate the role of CR feedback in stopping cooling flows (Guo & Oh, 2008; Fujita & Ohira, 2011, 2012). However, the acceleration (and re-acceleration) of CRs at shocks triggered by AGN, as well as at merger and accretion shocks have been neglected in previous works.
To our knowledge, the present study is the first in which such detailed CR physics (e.g. particle acceleration, reduced thermalization at the sub-shock, pressure feedback of CRs, effective adiabatic index of the baryon gas) as well as variety of AGN feedback models (quasar, jet and bubble modes) have been applied to cosmological simulations.
2 Numerical methods
We have produced cosmological cluster simulations with the adaptive mesh refinement code ENZO. On the basis of the public 1.5 version of ENZO we have implemented our methods to model the evolution and feedback of CR particles injected at shock waves (Vazza et al., 2012), as well as our (simplified) implementations of energy release from AGN.
ENZO is a grid and adaptive mesh refinement (AMR) code using the Piecewise Parabolic Method (PPM) to solve the equations of hydrodynamics, originally written by Bryan et al. (1995) and developed by the Laboratory for Computational Astrophysics at the University of California in San Diego (Norman et al., 2007; Collins et al., 2010) 111http://lca.ucsd.edu.
The detailed description of our modules for CR-physics and AGN feedback are presented in Sec.2.1-2.1. In all runs in this paper, we adopted radiative cooling for a fully ionized H-He plasma with a constant metallicity of , and a cooling function with a cut-off at K (Sarazin & White, 1987), as in the public version of ENZO, while the re-ionization background due to the UV radiation from early stars and AGN is modelled by keeping a gas temperature floor ( K) in the redshift range (as in Vazza et al., 2010).
We did not include star formation and feedback through winds or supernovae in these runs, thereby reducing the complexity and memory usage of the code. Hydrodynamical simulations suggest that while supernovae are important to reproduce the observed metal distribution of the ICM, they do not have a significant impact on the thermal history of the ICM on large scales (e.g. Short et al., 2012).
For the simulations presented here, we assumed a “concordance” CDM cosmology with , , , , Hubble parameter and a normalization for the primordial density power spectrum .
2.1 Cosmic ray-physics
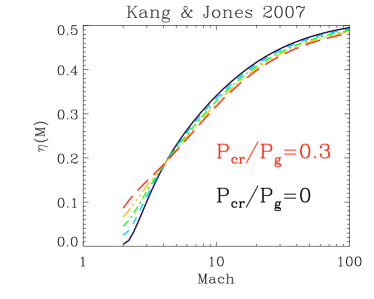
The basic methods to model the injection, advection and pressure feedback of CRs in our ENZO runs are explained in detail in Vazza et al. (2012). We assume that CRs are injected at shocks with an acceleration efficiency, , that only depends on the Mach number, , which is given by diffusive shock acceleration (e.g. Bell, 1978; Blandford & Ostriker, 1978; Drury & Voelk, 1981; Ellison et al., 1995; Kang & Jones, 1990; Malkov & O’C Drury, 2001; Kang & Jones, 2007; Caprioli, 2012). New CR energy is injected in the system by multiplying the energy flux through each shocked cell by the time step and the cell surface (at each AMR-level):
| (1) |
where is the pre-shock density, is the shock velocity, and are the time step and the spatial resolution at the AMR level-l, respectively. To ensure energy conservation the thermal energy in the post-shock region is reduced proportionally at run-time. The dynamics of the mixture of gas and CRs within each cell follows the total effective pressure of the two, , where , , is the gas energy density and is the CR-energy density. The dynamical feedback of CR pressure is treated in the Riemann solver by updating the gas matter fluxes in the in 1–D sweeps along the coordinate axes and using the effective gamma factor (), for the computation of the local sound speed in cells.
As in Vazza et al. (2012), we use the relativistic value of everywhere, which corresponds to the flattest possible momentum spectrum of CRs, through (with and for ). Fixing the value of within the simulated volume is an unvoidable assumption of the two-fluid model adopted here. However, once the CR-energy density is specified, the CR-pressure depends only weakly on the spectral shape of and on the cut-off of the spectrum (e.g. Jones & Kang, 1993; Jubelgas et al., 2008).
To model the injection of CRs at each shocked cell, we developed a run-time shock finder based on pressure jumps, similar to Ryu et al. (2003). At each time step, we flag cells with a negative 3–D divergence, , and with concordant local gradients of temperature and entropy, (e.g. Ryu et al., 2003). The local Mach number is computed by inverting standard Rankine-Hugoniot jump conditions for gas pressure. This method can run in either fixed grid resolution or adaptive mesh refinement mode in ENZO runs, and compares very well with the shock finding methods we develop elsewhere (Vazza et al., 2009). Compared to our first paper on this subject (Vazza et al., 2012), we add the treatment of several additional physical processes that are listed below.
2.1.1 Shock re-acceleration
We model at run-time the shock re-acceleration of CRs, by shocks running over a medium already enriched of CR energy by previous injections. This can be particularly relevant in the case of shocks caused by AGN feedback, where at late redshift the ICM is already enriched with CRs ( at ). According to the results in Kang & Jones (2007) the presence of CRs in the pre-shock region mimics an increased injection efficiency of CR-energy in the post-shock. This dynamic effect can be treated by using a different analytical function for , dependent on the ratio in the pre-shock. In our case, we calculate via a linear interpolation between the extreme cases of (in which case the efficiency is identical to the one of Vazza et al. 2012) and (both taken from Kang & Jones, 2007). Figure 1 shows the acceleration efficiency, based on the interpolation of Kang & Jones (2007), as a function
of the pressure ratio between CRs and thermal gas in the pre-shock region. The post-shock thermalization is then reduced at run-time accordingly, as in Vazza et al. (2012). Based on our tests in Vazza et al. (2012), the run-time modelling of shock re-acceleration of CRs does not have a dramatic impact on the final distribution of CR-energy, that is on average increased by percent inside the virial radius. This is because the pressure ratio between CRs and thermal gas in always tiny inside clusters (Sec. 3.2), and therefore the impact of re-accelerated CRs on the final budget of CR-energy of the ICM is small.
2.1.2 Hadronic and Coulomb losses
Cosmic rays can lose energy via binary interactions with thermal particles of the ICM. This channel of energy exchange between thermal and relativistic particles in the ICM is important for the high gas density () of cool cores. Relativistic protons transfer energy to the thermal gas via Coulomb collisions with the ionized gas. They can also interact hadronically with the ambient thermal gas and produce mainly , and , provided their kinetic energy exceeds the threshold of 282 MeV for the reaction. The neutral pions decay after a mean lifetime of s into -rays. To estimate the total energy transfer rate between CRs and thermal gas in both mechanisms, we need to determine the CR energy spectrum. Since this information is not readily available in the two-fluid model, we must assume an approximate steady-state spectrum for the CR energy distribution. We fixed a spectral index of for the particle energy222This choice of corresponds to a Mach number of at the particle injection. On average, this represents the typical injection spectra of particles accelerated at powerful merger shocks in cosmological simulations, which are dominant sources of thermalization and CR injection within clusters (e.g. Vazza et al., 2011b, and references therein). and computed the total Coulomb and hadronic loss rates as a function of the ICM density and of for each cell, as in Guo & Oh (2008):
| (2) |
where is the electron number density, and is the coefficient for all collisional energy loss terms. In hadronic collisions, only of the inelastic energy goes into secondary electrons (Colafrancesco et al., 2004; Guo & Oh, 2008). The energy-dominating region of CR electrons () will heat the ICM through Coulomb interactions, plasma oscillations and excitation of Alfvén waves (e.g. Guo & Oh, 2008). Therefore we can assume that these secondary electrons lose most of their energy through thermalization and thus heat the ICM. Similar to Eq.2, the heating rate of the ICM through Coulomb and hadronic collisions can be computed as:
| (3) |
where (Guo & Oh, 2008). In our simulations with radiative cooling and AGN feedback, the rate of energy loss due to these collisions is extremely small, typically of or during the time step at each AMR level. This allows us to use a simple first-order integration to compute the energy losses of CRs (and the corresponding gas heating rate) at run-time.
In our previous work (Vazza et al., 2012), we did not include hadronic and Coulomb losses. In general, modelling this process at run-time decreases the CR energy by a factor within cluster cores, while yielding identical results for the remaining cluster volume compared to runs that neglect losses.
2.2 Models of feedback from AGN
In Vazza (2011) we implemented a simple model of AGN feedback in ENZO, via injection of thermal energy at the opposite sides of the cooling region of galaxy clusters. Here, we explore more complex recipes of energy feedback between the cold gas and the surrounding ICM, allowing also for a direct input of CR energy from AGN.
At each time step, the identification of a suitable location of the central super-massive BH is based on the simple measure of local gas over-density. First, we flag cells hosting a gas density exceeding a given threshold, , and then we select as active ”AGN-cells” only the maxima within cubic regions of size Mpc/h. Based on more detailed modelling of BH growth using sink-particles (Sijacki et al., 2007; Teyssier et al., 2011; Martizzi et al., 2012), we tuned the threshold value to excite AGN feedback to . The use of this threshold is motivated by the fact that in our fiducial setup (peak resolution of per cell) the mass enclosed in a cell with is . This is the typical gas mass surrounding BHs of , which are commonly hosted inside the masses of galaxy clusters and groups (e.g. Sijacki et al., 2007; Teyssier et al., 2011; Martizzi et al., 2012)333The choice of relying only on the gas density as a proxy may trigger also feedback from cold filaments connecting galaxies, where AGN feedback of the type considered here is unlikely. However, our simulations have sufficient high resolution only in galaxy clusters. This seems to exclude any spurious release of feedback energy from cold filaments, as indeed we find. To fully avoid this possibility, one would have to resort to more complex models (e.g. sink particles)..
In the following, we will refer to the cells exceeding this density threshold and powering energy feedback as ”AGN-cells”.
We have implemented three modes of AGN feedback: a ”quasar” mode (i.e. thermal output of energy from AGN, Sec.2.2.1), a ”jet” mode (i.e. kinetic energy output from bipolar jets around AGN, Sec.2.2.2) and a ”radio” mode (i.e. creation of buoyant bubbles in pressure equilibrium with the ICM, Sec.2.2.3).
Once the feedback mode is specified, the only parameters that must be set are: a) the initial redshift for the start of AGN feedback () and b) the energy release of each single AGN-event, . In the case of ”quasar” and ”jet” modes this directly measures the energy we provide for each burst of either thermal or kinetic energy, while for the ”bubble” feedback this represents the estimated total energy released to the ICM by the creation of bubbles with internal pressure and volume , (e.g. Scannapieco & Brüggen, 2008).
Even if jets and radio bubbles are associated with the same type of AGN feedback (e.g. McNamara & Nulsen, 2007, 2012), in our study they are considered as alternative scenarios. This allows us to distinguish the CR-effects of buoyancy and impulsive kinetic feedback in a clearer way.
In a preliminary set of tests (see the Appendix) we explored various recipes for the implementation of feedback modes in one reference cluster, before varying the efficiencies in the whole set of clusters.
Here, however, we will discuss only the ”fiducial” subset of parameters for which each implementation of feedback modes showed the best performance. While the range of spatial resolution achieved in our runs is probably not sufficient to study specific small-scale features associated with each AGN mode (e.g. the morphology of jets or rising bubbles), our resolution and physical setup are suitable for studying the large-scale features of CRs in the ICM.
2.2.1 Thermal feedback from AGN
A significant fraction of the energy emitted from AGN can thermally couple to the surrounding gas. One can define efficiencies such that the energy added in time is
| (4) |
where is the bolometric radiative efficiency for a Schwarzschild BH (Shakura & Sunyaev, 1973), , and is the coupling efficiency with the thermal gas, which is usually assumed to be in the range in order to fit the observed vs relation (e.g. Di Matteo et al.2005; Booth & Schaye 2009). This thermal coupling between the AGN and the surrounding ICM is usually called ”quasar” feedback, which may be a mechanism for pre-heating of the ICM (Lapi et al., 2005; McCarthy et al., 2004, 2008; Sijacki et al., 2009; Lapi et al., 2010). In addition, quasar-induced outflows at high-redshift, possibly following mergers of gas rich galaxies, have been observed in many cases (e.g. Nesvadba et al., 2006; Bhattacharya et al., 2008; Dunn et al., 2010). Similar to McCarthy et al. (2010) and Teyssier et al. (2011), when we detect cells with , we release the thermal energy, , adding to the total and internal gas energy inside cells at the highest available AMR level.
This implementation of quasar feedback is only an approximation of the true physical processes at play, i.e. the launching of strong winds due to the radiation pressure of photons from the accretion disc. This is unavoidable, given that our best resolution is orders of magnitude larger than the theoretical accretion disc region, and also given the difficulty of modelling the radiative transfer of photons from the accretion region.
Our choice of a minimum gas density selects the typical environment of massive BHs within clusters and groups. Furthermore, we assume an energy output similar to most theoretical models, without actually measuring the accretion power of BHs at run-time. This is different from simulations where the mass growth of BHs is modelled using sink particles, which enables an accurate reconstruction of the BH matter accretion rate at run-time. This is not possible in our case. Our approach is only a first step to include the effects of AGN feedback in our version of the code, and it allows us a fast and efficient study of AGN modes.
2.2.2 Kinetic feedback from AGN
The innermost ICM can be affected by the injection of kinetic energy through bipolar jets originating from the AGN (e.g. Binney & Tabor, 1995; Ciotti & Ostriker, 2012). This energy can be thermalized by impacting on the ICM after a short distance from the cluster centre ( kpc, Pope 2009). Gaspari et al. (2011b, a) and Dubois et al. (2010, 2011) recently simulated the mechanical coupling between purely kinetic jets from the AGN and the surrounding ICM in the cooling region.
In this model each of the two jets is initialized as a pure input of kinetic energy density , with velocity, , pointing radially outwards from the cluster centre. Even if in our version of ENZO the launching direction of the jets is set by a random selection of coordinate axes, in this work we keep the jet axis fixed. In this way, velocity effects related to the direction of jet launching can easily be detected (Sec.3.4). Every time a jet is generated, we modify the gas velocity, the total and internal energy at the highest available AMR level in a pair of cells on opposite sides of the gas density peak. The width and the initial extension of the jet are set by the maximum resolution, which is times larger than the best resolution available in ”single-object” runs (Gaspari et al., 2011b). At our resolution, the equivalent opening angle of each jet is degrees with respect to the cluster centre. This is an unavoidable drawback of the fact that in such cosmological runs achieving a much larger resolution is computationally very expensive. However, for the dynamical feedback of jets the most important quantity is the injected kinetic energy, which is similar to simulations at higher resolution, once the different mass load of the jets and launching velocity are considered. Also the initial velocity of our jets (which depends on the typical density of AGN-cells, through the total kinetic energy released in the AGN-burst) is , about one order of magnitude lower than the typical velocity of jets in single-objects simulations at much higher resolution (Gaspari et al., 2011b, a).
2.2.3 Bubble feedback from AGN
The creation of buoyant bubbles in the ICM inflated by jets requires a spatial resolution ( kpc) beyond what can be achieved in our cosmological runs. For this reason, we created already formed evacuated bubbles around cells hosting an AGN, similar to Scannapieco & Brüggen (2008). The bubbles are created in (approximate) pressure equilibrium with the surrounding ICM, by decreasing the gas density inside the cells by , and correspondingly increasing the thermal energy in order to conserve the original gas pressure. During run-time, this modification is performed over a single time-step of the simulation, at the highest available AMR level. This obviously leads to a loss of gas mass in these cluster runs. The simulations show that on average this loss amounts to percent of the gas mass by the end of the simulation.
The initial under-density of the bubbles is set by energy conservation inside the bubbles, after that is added to the gas and CR energy within the same volume. For the range of and adopted in this work, the under-density inside the bubbles is typically . The bubbles are generated as a pair of cubic blocks of cells, at the distance of 2 cells from the cluster centre. This is a very crude approximation and is expected to lead to expedient numerically mixing of the thermal energy.
In principle, we can also allow for the presence of CRs injected by the AGN, parametrized by of the total injected energy, similar to Sijacki et al. (2008). In this case the energy of the bubbles is conserved also by modifying the effective adiabatic index of the mixture of gas+CRs (as in Vazza et al., 2012). However, in the main body of this paper we only refer to purely thermal bubbles. We present a few results with gas+CRs inflated bubbles in the Appendix (the results, however, are not significantly different).
| ID | cooling | [erg] | feedback mode |
|---|---|---|---|
| cooling | yes | 0 | no |
| quasars | yes | thermal, | |
| quasars2 | yes | thermal, | |
| jets | yes | kinetic, | |
| bubbles | yes | buoyant, |
| ID | dynamical state | ||
|---|---|---|---|
| E1 | 11.2 | 2.67 | post-merger |
| E5A | 8.2 | 2.39 | merging |
| H5 | 2.4 | 1.70 | post-merger |
| H10 | 1.2 | 1.20 | relaxed |
3 Results
The results discussed in the main part of this paper have been produced considering the following physical mechanisms: a) pure cooling; b) cooling and thermal feedback by AGN from , with a fixed energy release per event of (or also in the case of E1 and E5A) ; c) cooling and kinetic energy feedback by AGN from , with a fixed energy release per event of ; d) cooling and energy feedback from buoyant bubbles injected by AGN from , with an approximate energy per vent of . With the above implementations, we re-simulated four clusters in the masses range . The list of the most important parameters of all “fiducial” models investigated in the article is given in Tab. 1. The first model (pure cooling) obviously produces strong cooling flows in all systems. In this work, this model is therefore regarded only as a standard reference to assess the role of each feedback model.
In order to achieve the largest possible dynamical range inside the volume where each cluster forms, the four clusters were re-simulated at high spatial and DM mass resolution starting from parent simulations at lower resolution and adding nested initial conditions of increasing spatial and mass resolution (e.g. Abel et al., 1998). Two levels of nested initial conditions were placed in cubic regions centered on the cluster centers. The box at the first level had the size of (with and constant spatial resolution of ). The second box had a size of (with and constant spatial resolution of ). For every cluster run, we identified cubic regions with the size of (where is the virial radius of clusters at , calculated in lower resolution runs), and allowed for 3 additional levels of mesh refinement, achieving a peak spatial resolution of (in the following, we will refer to this sub-volume as to the “AMR region”). From (the initial redshift of the simulation) to , mesh refinement is triggered by gas or DM over-density. From an additional refinement criterion based on 1–D velocity jumps (Vazza et al., 2009) is switched on. This second AMR criterion is designed to capture shocks and intense turbulent motions in the ICM out to the clusters outskirts. Shocks and turbulence are analyzed in the next Sections (Sec.3.2-3.4). In addition, our test with ENZO have shown that this composite AMR criterion better capture physical mixing motions in the ICM, and reduces the amount of numerical mixing, with important consequences in the amount of cold gas within the cluster volume (Vazza, 2011). However, this method is computationally much more expensive with respect to the gas/DM overdensity criteria alone, and we could afford to run it only in the “fiducial” AGN models (Tab. 1).
In the Appendix we show the effects of different implementations and energies budget in AGN feedback in the smallest of these systems,using the standard AMR criterion which works on gas/DM overdensity. In the main paper we will study the observable thermal and non-thermal features of the ”fiducial” implementation of each feedback mode in our version of ENZO. The parameters of the small cluster sample resimulated with the different recipes of AGN feedback is given in Tab. 2.
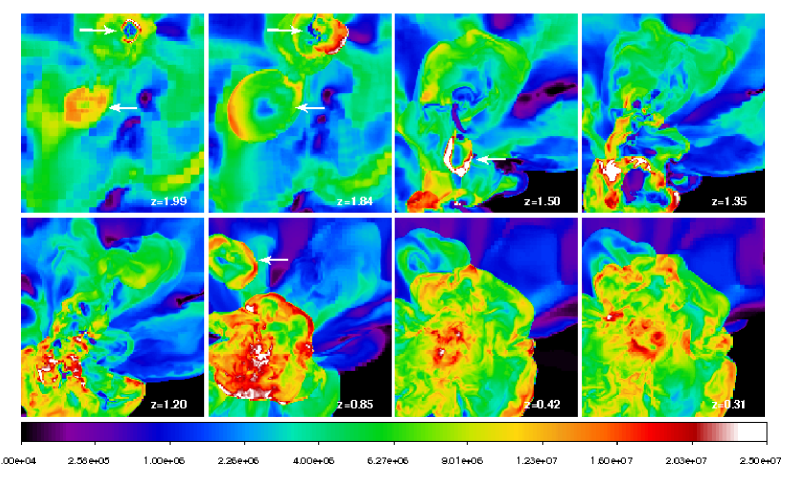
The evolution of gas temperature between and in cluster H5 (quasar-mode) is shown in the panels of Fig.2. Blast waves triggered by AGN feedback (highlighted by arrows) in the thermal mode drive powerful shocks through the intra cluster medium, adding to the pattern of merger and accretion shock waves. We observe that in general only AGN-cells are located inside forming clusters at a high redshift, while at a lower redshift only one AGN-cell is usually found inside the virial volume. The shocks triggered by AGN feedback are efficient in removing the cold gas phase at , while producing significant amounts of CRs in the forming cluster. Blast waves also cause the expulsion of a significant fraction of the hot gas from the cluster volume, in line with McCarthy et al. (2010).
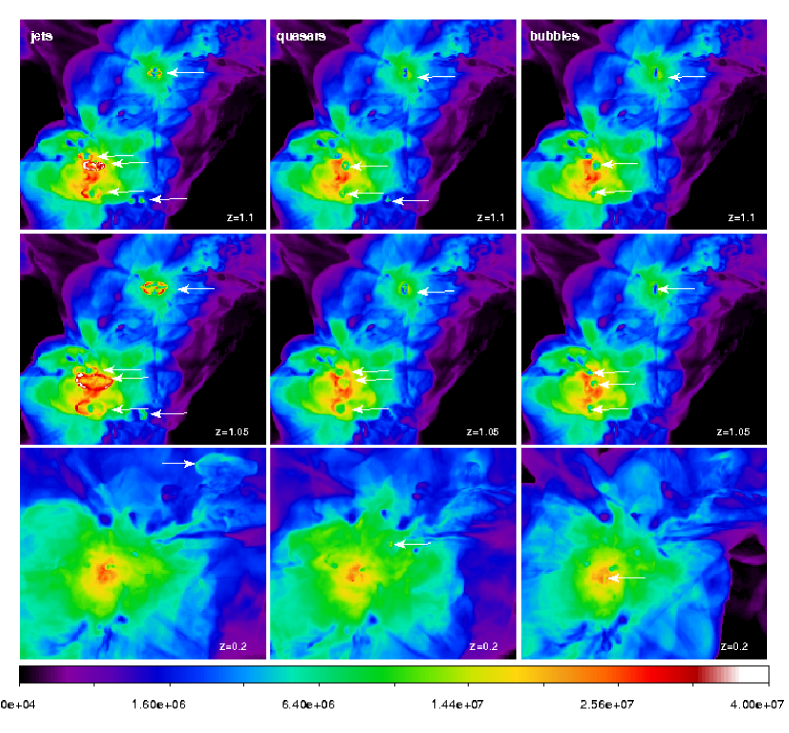
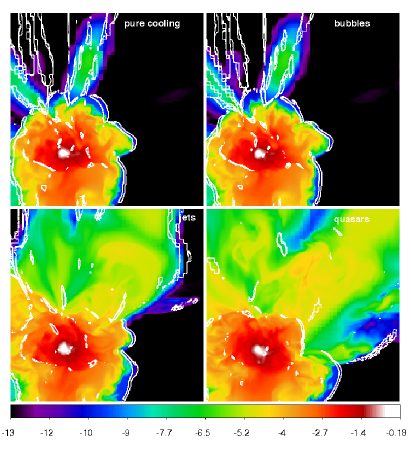
Figure 3 shows a comparison of projected gas temperature across the entire AMR region of the same cluster, at three different cosmic epochs. While the large-scale morphology of the cluster is similar in all runs towards the end of the simulation, each feedback mode locally perturbs the ICM in a different way, driving powerful outbursts (or buoyant bubbles) whenever strong cooling causes .
In the quasar-mode, the final large-scale morphology of the cluster is also affected by the overall action of powerful thermal bursts, and presents a large amount of ejected hot gas outside of the cluster volume. In the jet-mode, prominent jets are launched along the horizontal axis, driving powerful shocks () into the cooling gas as well as gas motions along their axis. The bubble-mode, on the other hand, has barely detectable effects on the large scale, and is globally similar to a simple pure-cooling run (not-shown).
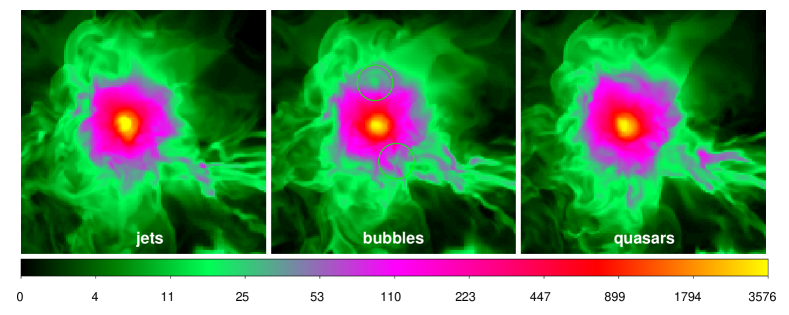
Fig. 4 presents a zoomed image of the gas density maps for a slice of and depth kpc for the final configuration of cluster E5A in runs employing AGN feedback. Jets and quasars are not active any more at in this run, and no clear features related to their activity can be seen in the innermost cluster region at this redshift. A pair of bubbles, on the other hand, has recently been injected and can be seen as a couple of under-dense blobs on opposite sides of the cluster centre (shown by green circles in the image). Other images of active jets and bubbles can be seen in Fig. A1 of the Appendix.
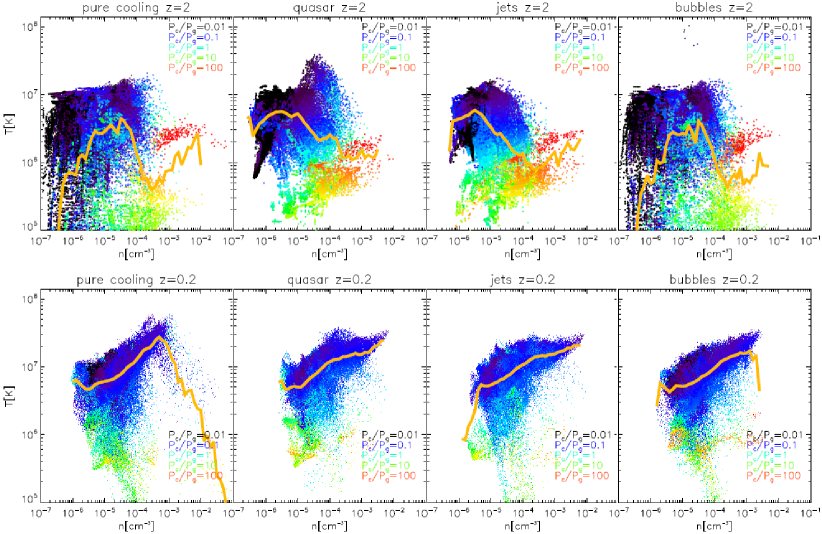
We use phase diagrams for the cells inside the virial volume in order to characterize relevant differences. In Fig.5 we show the example of phase diagrams for an early cosmic epoch before the cluster formation, (top panels), and after the formation of the cluster, (lower panels) for the four different feedback modes. The most evident difference between the runs is the absence of the ”cooling flow” phase on the lower right part of the diagram, in all runs employing AGN feedback. In the bubble-mode, the feedback from buoyant bubbles only affects the high-density regions around the cluster core. At high redshift, the phase diagram is very similar to the pure cooling run, with the exception of the selective removal of gas with cells, which are heated to high temperatures () by the injection of bubbles. On the other hand, in the quasar and jet mode the action of feedback drastically alters the phase diagrams with respect to the pure cooling run. This is particularly evident in the quasar mode at , where a ”cloud” of high temperature cells ( and ) is left after the passage of an AGN-driven blast wave. At , the ”cooling” phase has almost disappeared in jet and quasar feedback, due to the efficient and volume-filling nature of the heating events driven by such powerful mechanisms. In the bubble run the phase diagram is similar to the pure-cooling run, with the exception of the regime, where bubbles are injected almost continuously and over-cooling is balanced by mixing. This leaves a significant portion of ”cold” ( K) and dense cells in the simulated volume, characterized by large values of .
3.1 X-ray properties
We compare our simulations with the collection of CHANDRA cluster observations of Cavagnolo et al. (2009), publicly available via the ACCEPT catalogue (http://www.pa.msu.edu/astro/MC2/accept). The catalogue consists of 241 clusters mostly located in the redshift range and with average central temperatures in the range . For our comparison we selected a sub-sample of objects from the ACCEPT catalogue, with redshifts and average central temperatures compatible with our cluster dataset: and inside . For further details on the ACCEPT catalogue and set of observations, we refer the reader to Cavagnolo et al. (2009).
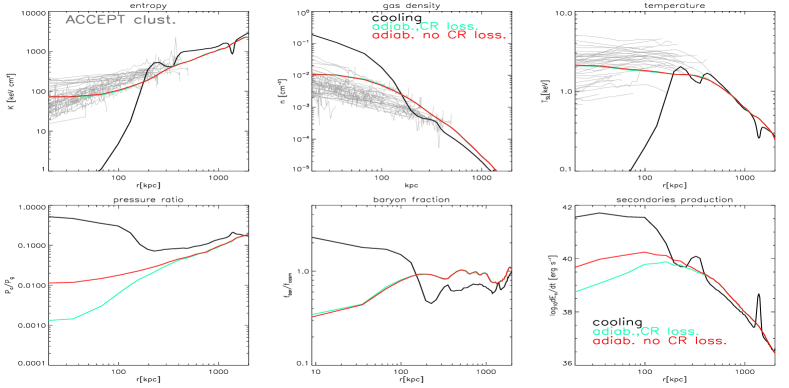
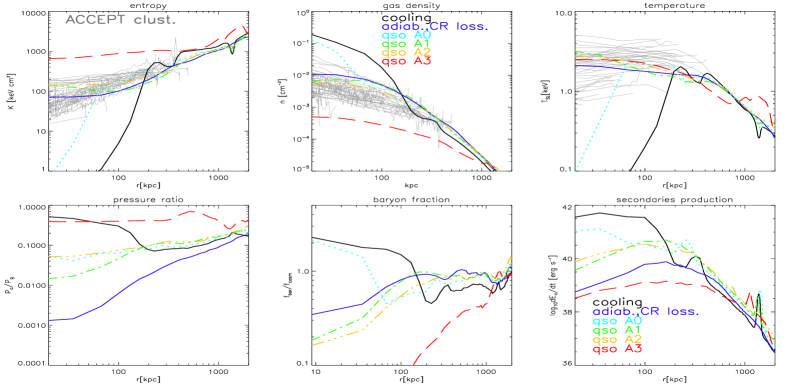
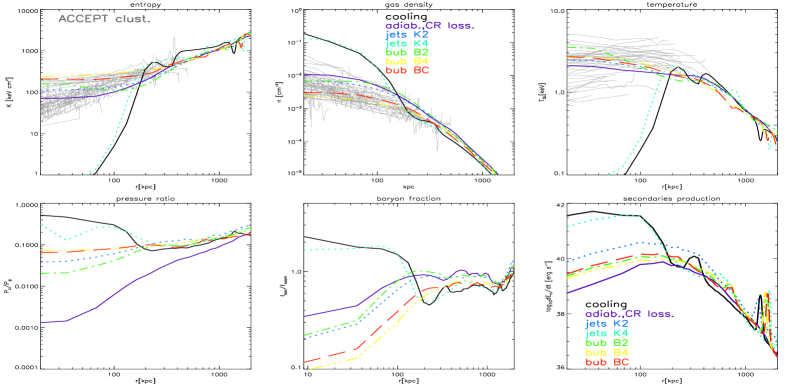
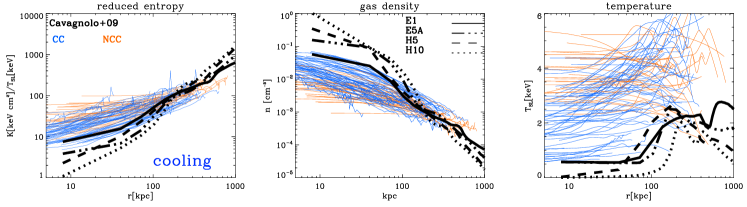
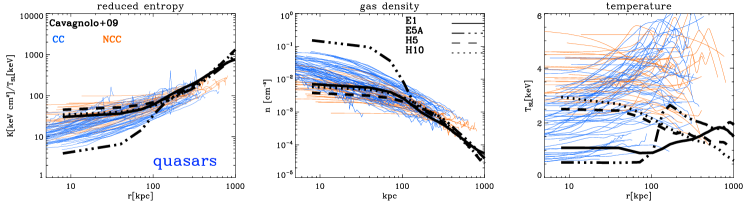
In Fig.6, we show the radial profile of reduced gas entropy 444We use the ”reduced” entropy, rather than the usual entropy, , since this removes the dependence on the host cluster mass, (Borgani et al., 2008).(, where and is the-spectroscopic like temperature, Rasia et al. 2005), gas number density, , and spectroscopic-like temperature for the different feedback modes. The simulated profiles are compared to the profiles of observed clusters, divided by the colour-coding into ”cool-core” systems if their central entropy is (in blue), or ”non-cool-core” systems otherwise (red).
As expected, none of the pure cooling runs can reproduce the observed profiles. In these runs, steep gas density profiles with central values of and reduced central entropy below are found, at odds with observations and in agreement with standard radiative runs (e.g. Li & Bryan, 2012, for a recent review). Only cluster E1 is marginally within the range allowed by observations for density and entropy. However, considering that this system has just gone through a strong major merger at (), it cannot be classified as a classical cool-core cluster, as suggested by its gas density and temperature profile. On the other hand, all runs employing AGN feedback yield a much better comparison with observations. Jet and bubble feedback modes produce roughly similar profiles for all clusters: a rather flat entropy profile within cluster cores (compatible with the high entropy floor of non-cool-core clusters in Cavagnolo et al. 2009), a shallow density profile and an almost isothermal temperature profile inside the central from the centre. Less clear results are found in the case of quasar-feedback. While in clusters E1, H5 and H10 a reasonable match with observations is found with the ”fiducial” energy budget of per event, this is insufficient to quench the cooling catastrophe in cluster E5A, where a rather standard cooling flow takes place by the end of the simulation. By increasing the available energy per event by one order of magnitude, , the cooling flow is stopped also in cluster E5A (lower row of Fig.6). Interestingly, the same is true for a re-simulation of cluster E1 using the same higher energy budget. However, in the case of the other smaller clusters the higher energy budget is too large and the thermal structure of both is destroyed, leading to a gas-poor cluster (see Appendix).
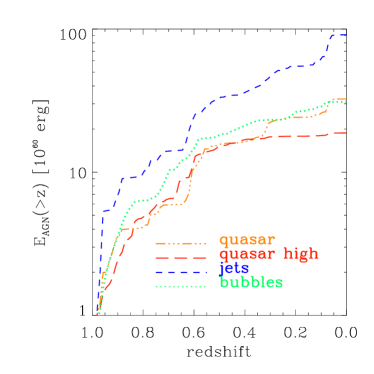
This may simply suggest that different cluster masses must be characterized by different typical powers per event, mirroring the fact that a larger power per event is needed to balance the gravity and the pressure of the cooling gaseous atmosphere (e.g. Pope, 2009). However, it is interesting to notice that the self-regulating nature of AGN feedback (even with this simple implementation) yields very similar final profiles in the most massive object of our sample, even if the power per event is 10 times larger. In Fig.7 we show the total energy released by AGN in the formation region of cluster E1, in the redshift range . By the end of the simulation, all feedback modes used a total amount of energy in the range , corresponding to of the total thermal energy of the cluster at .
Interestingly, by the end of the simulation the higher power AGN mode () used about percent less energy than the lower power run (), which is of the total energy used in the kinetic feedback mode at a lower power. The total energy budget used in the bubble mode is similar to the quasar mode at the same power per event. We note that in this system the use of AGN-feedback is significantly reduced for , due to the onset of large-scale mergers and powerful shock heating within the cluster volume. However, episodes of AGN-feedback are present even at later epochs. Overall, a smaller amount of energy from AGN feedback is necessary to balance the catastrophic cooling with purely thermal feedback, or bubbles, compared to kinetic feedback. This is consistent with analytical results of Pope (2009, Fig.1), where it is shown that a higher injection rate of kinetic energy, with respect to thermal energy, is necessary to balance the cooling flow for cluster masses . This is because in a massive cluster the critical momentum injection rate needed to overcome the pull of gravity and the surrounding gas pressure in the cluster core is more difficult to reach than the critical injection rate of thermal energy required to overcome the cooling flow via thermal feedback. In addition, the energy release from jets close to the cluster core is very anisotropic, and it becomes more isotropic (due to the driving of shocks) only at a distance of from the core.
Overall, the X-ray properties of our clusters seem consistent with observed low-temperature non-cool-core clusters since the typical internal drop in temperature of cool-core clusters is not observed. On the other hand, in the epoch in which the AGN feedback is triggered in our simulations, the thermal structure of the innermost cluster regions is not compatible with the appearance of typical cool-cores either, because the internal drop in temperature is typically much stronger than what is observed. A lack of resolution compared to observations could be responsible for that.
However, we find no evidence of bimodality in the distribution of clusters entropy or gas density in our re-simulations, at odds with observations (Cavagnolo et al., 2009; Pratt et al., 2010; Eckert et al., 2011). This might be connected to our coarse sampling of the parameters space of AGN feedback, or may instead call for the implementation of more complex physics in our simulations. However, the investigated sample is too small to address this important issue in detail, and we will leave this for future work.
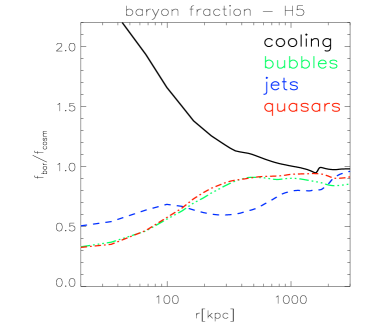
We illustrate the effects of AGN feedback on the radial distribution of baryon fraction by referring to the relevant example of cluster H5 at , shown in Fig.8. As expected, the onset of the cooling flow causes too strong a concentration of baryons inside the cooling radius, clearly at odds with observation (e.g. Ettori et al., 2009; Sun, 2012, and references therein). On the other hand, all feedback runs produce a final distribution of gas mass which is more in agreement with observations, showing increasing profiles towards the cluster outer regions (e.g. Ettori et al., 2009; Sun, 2012). Approaching the enclosed gas mass fraction is percent of the cosmological baryon fraction. However, the different implementations of feedback produce significantly different and time-dependent features in the profile. In particular, the mechanical action of jets changes the shape of the enclosed baryon fraction in this low-mass system, due to a more recent feedback episode. Similar trends are found in the other systems, provided that the time-dependent action of jets of this power has a decreasing impact on the shape of the baryon fraction profile moving to larger masses. In the case of bubble-feedback, the artificial removal of gas when bubbles are created causes a small deficit of baryons inside the radius. Since the enclosed baryon fraction is very similar (within a few percent at all radii) to the one obtained with thermal feedback, where the gas mass is conserved instead, we conclude that the loss of baryon mass due to our procedure of generating bubbles is not the leading mechanism of the observed trend.


3.2 Shocks and cosmic rays
Blast waves triggered by explosive AGN feedback (in the quasar or jet mode) inject CRs at shock waves in the ICM. This can happen before and after the formation of the cluster, as already shown in Fig.2. These shocks add to the underlying pattern of cosmological shock waves driven by matter accretion, and to the budget of shock-accelerated CRs that are continuously injected into the ICM (Ryu et al., 2003; Pfrommer et al., 2006; Skillman et al., 2008; Vazza et al., 2012).
Figure 9 gives an example of the different patterns of shock waves and CR-energy in the re-simulations of one simulated cluster (we chose here the epoch of , when AGN feedback is still very active). The pure cooling run and the run employing bubble feedback show a pattern of shocks similar to non-radiative runs (Vazza et al., 2012), with strong accretion shocks enveloping the cluster and a few weaker substructure shocks inside the cluster. The CR-energy in these runs is concentrated within the cluster and the filaments of matter being accreted onto it. The re-simulations with jets and quasars present a much wider distribution of CR-energy, as a result of previous episodes of gas and CR expulsion from the proto-cluster. In this case, shocks launched by mergers and accretions add to those previously driven by AGN bursts. In general, along the directions of powerful outflows of gas and CRs the location of accretion shock from smooth material is shifted up to several from the cluster center. This happens because the release of non-gravitational energy heats the ICM along the outflows, and increases the sound speed there. Very similar trends are found also in the other clusters. This implies that, in general, the impact of feedback on the distribution and amount of CR energy can be significant not only inside clusters, but also in large-scale filaments associated with the cluster.
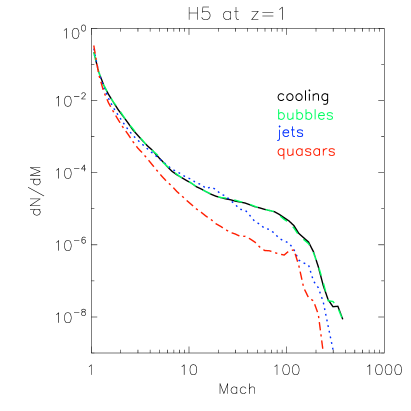
The differential volume distribution of shock Mach number (measured as explained in Sec.2.1) for the same volume of of Fig.9 is shown in Fig.10, for all feedback modes. At the epoch of this output (), we find a systematic deficit of shocks in runs with quasar feedback, simply because shocks have travelled out of the reference volume, and the ICM is overall much hotter with respect to pure-cooling or bubbles feedback. The run with jets displays a distribution of Mach numbers closer to the pure-cooling case, but it shows a similar deficit of strong shocks inside the reference volume.
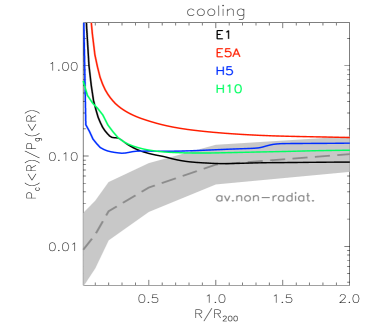
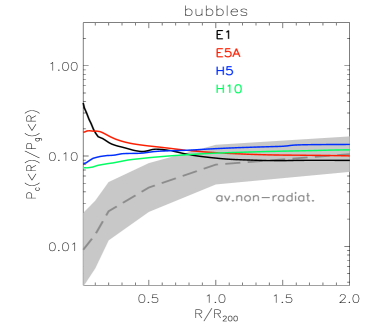
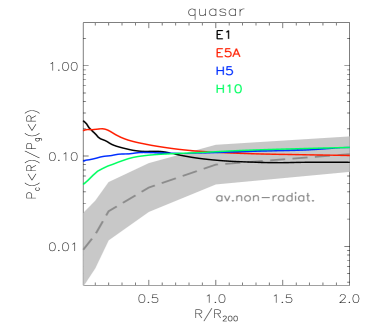
In Figure 11 we show the profiles of the pressure ratio for all clusters of the sample. As a reference, we also plot the average pressure ratio obtained with the sample of 7 non-radiative cluster runs presented in (Vazza et al., 2012).
In all feedback modes we measure a ratio inside , within the range of what we already reported for non-radiative runs employing only CR injection at cosmological shocks (Vazza et al., 2012). However, large variations are found by comparing pure-cooling or feedback runs.
Cooling acts to increase this ratio by removing gas from its hottest phase at all radii. In addition, pure-cooling is also found to dramatically increase the loss-rate of secondary particles in the centre, up to (as shown in Fig. A2 of the Appendix). The heating term from CRs is, however, not sufficient to balance the radiative losses in the innermost ICM, which are usually times larger. Approaching the cluster core we measure in the smallest objects, and in the most massive ones. Unfortunately, our sample of clusters is too small to allow us to infer a trend with the cluster mass. One possible reason for this trend can be, however, numerical: if the maximum spatial resolution is fixed (as in this case) the cooling region of largest structures is better resolved, usually producing a slightly larger gas density peak and a significantly higher cooling rate. This trend in the cooling rate has been reported in a number of works investigating SPH (e.g. Valdarnini, 2002; Tornatore et al., 2003) or Eulerian simulations (e.g. Bryan & Norman, 1998; Li & Bryan, 2012). This trend with radius of the pressure ratio is also similar to what is found also with SPH codes (Pinzke & Pfrommer, 2010a; Aleksić et al., 2012).
We find that feedback acts to reduce the pressure ratio at all radii, this effect being larger inside . This suggests that, although AGN feedback on average triggers the injection of additional CR-energy in the cluster core compared to simple radiative runs, its effect is that of reducing the dynamical role of CRs, because the same process also increases the thermal gas pressure. Although AGN feedback has the effect of changing the innermost shape of the profiles of pressure ratio in clusters H5 and H10 (producing a profile more similar to the non-radiative case, with inside ), the profiles of the pressure ratio in clusters E1 and E5A still show a maximum within the cluster core, with .
This internal shape is opposite to the case of the pure-radiative runs, and seems to be the “imprint” of the early cooling stage of both systems. We verified that indeed this profile is already in place at earliest epochs of cluster formation () for both systems. It seems that once that the “cooling” profile had enough time to form, its imprint can hardly be erased by AGN feedback, especially in high-mass systems where, for a given AGN-power, it is more difficult to produce an efficient outflow of the CRs previously accumulated. Similar profiles of the CRs to gas pressure ratio have been reported for single-object simulations of AGN feedback in cooling flow clusters (Guo & Oh, 2008; Fujita & Ohira, 2011, 2012), suggesting that this may be a stable feature of such physical models. In order to study in detail the mass-dependence of in cosmology, a much larger cluster sample is required.
In general, it is not straightforward to immediately relate the power released by feedback (as in Fig.7) to the injected CR-energy within the cluster volume. Shocks which follow the most recent event of jet or quasar feedback are surely responsible for the injection of new CR-energy inside the cluster, as shown in Fig.9. This can be seen also in the close correlation between the power per event of AGN feedback and the resulting pressure ratio inside clusters in the tests shown in Appendix (Fig. A3-A4). However, the long-term evolution of the simulated ICM and of its balance between CRs and gas energy depends also on other factors, such as the density-dependent secondary losses (Sec. 2.1.2) and the further evolution of matter accretion from the outer cluster region. Indeed, cooling and feedback do not only affect the cluster core, but also the density distribution in the accreted substructures, causing the release of different pattern of shock waves (e.g. Kang et al., 2007; Pfrommer et al., 2007) and turbulent motions (e.g. Valdarnini, 2011). For this reason, it seems not possible to derive a simple prescription to relate the relase of feedback energy to the budget of CR-energy within clusters at low redshift, once that that all competing mechanisms are fully taken into account.
We can compare these values to the available constraints from observations (see also next Sec.3.3 for a close comparison with -ray observations). The present upper limits for a large sample of nearby galaxy clusters observed with FERMI imply (e.g. Ackermann et al., 2010; Jeltema & Profumo, 2011), with a poor dependence on the assumed spectra of CR. Also the limits on the presence of diffuse Mpc-scale radio emission in clusters can be used to constrain secondary electrons and thus the energy density of the primary CR protons (Brunetti et al., 2007; Brown et al., 2011). In this case, the limits depend also on the cluster magnetic field strength and are complementary to those obtained from -rays. In the relevant case of an average magnetic field in clusters of a (Bonafede et al., 2010), radio observations of clusters with no Mpc-scale radio emission suggest that () in the case of a spectrum with an index (), while the limits are less stringent for smaller average magnetic fields (Brunetti et al., 2007; Jeltema & Profumo, 2011). These limits usually refer to innermost Mpc regions of clusters, where both the number density of thermal protons and the magnetic field are larger. At present no tight constraints are available for the clusters outskirts where the CR contribution might be larger.
According to Fig. 11, it seems that all runs with un-balanced cooling produce a ratio that is incompatible with radio/-ray observations. In runs with AGN feedback, we find a consistency with the above upper-limits in the two smallest size clusters, and a significantly larger pressure ratio in the two largest systems (factor in the center). However, when the -emission of our clusters is directly compared to the available data from FERMI, the results of AGN feedback are below the upper limits. This is because the -emission is more sensitive to the density () than to the pressure ratio between CRs and gas (), and therefore the net effect of AGN in our simulations is that of producing a lower -flux compared to upper limits, although producing a large in the center. In the case of radio upper-limits, the values of in our runs can be better reconciled with radio data if the average spectrum of CRs is (or steeper). As we will discuss in Sec.3.3, this is actually the case of most of the CR-energy found in our cluster runs.

3.3 -ray flux
CR-protons colliding with thermal protons of the ICM produce secondary -ray emission (Dennison, 1980). Since once accelerated CR hadrons can accumulate in galaxy clusters (Berezinsky et al., 1997) and produce a long-lived -flux signature (Pfrommer & Enßlin, 2004; Miniati, 2003; Ando & Nagai, 2008; Donnert et al., 2010b; Pinzke & Pfrommer, 2010b), observations in this energy range can provide an important test-bed for feedback models. Indeed, feedback episodes producing similar X-ray features at might still contribute a different enrichment of CRs across a whole cluster lifetime, and therefore a different -flux from our simulated objects. In this Section we investigate the level of secondary emission resulting from the acceleration of CRs in the different modes of AGN feedback.
In the two-fluid model used here, we cannot follow the spectral evolution of the CR population. Hence in order to compute the -ray flux from hadronic collisions we must assume a spectrum for the CRs at the time of observation. Shocks which developed in the already formed dense and hot ICM (), largely dominate the energy budget of shock acceleration in clusters, compared to earlier times (). It is therefore reasonable that the resulting population of CRs at later epochs has a spectral index that is associated with these Mach numbers. Using SPH simulations modelling the injection and energy evolution of CRs at cosmological shocks, Pinzke & Pfrommer (2010b) recently derived an average injection spectrum for their sample of simulated clusters (for protons in the range ). In our case, based on previous work with ENZO, we know that shocks that are mainly responsible for the injection of CRs for are in the range (e.g. Vazza et al., 2011b, and references therein), corresponding to a particle injection spectrum of . This follows from the basic relation
| (5) |
that applies to the case of non-radiative shocks.
In the following we will base our computation of the -flux on the limiting cases of () and ().
Within the virial volume of clusters, the decay is expected to dominate the cluster emission above with respect to other radiative mechanism (e.g. Inverse Compton of secondary electrons, non-thermal bremsstrahlung, Miniati 2003; Ando & Nagai 2008). We also neglect turbulent re-acceleration of CRs (e.g. Brunetti et al., 2007; Brunetti & Lazarian, 2011a). 555We notice that in principle also the signal from Dark Matter annihilation can contribute to the same energy range (e.g. Pinzke et al., 2011). However, this has not been observed yet (e.g. Ackermann et al., 2012), and the effect obviously strongly depends on the assumed cross-section of DM, a still open topic, and we do not model this contribution in any way. Indeed, our simulations can be helpful in assessing the statistical emission floor of -emission expected from structure formation processes and AGN feedback. Following the formalism of Pfrommer & Enßlin (2004) (see also Donnert et al. 2010b), we compute the emission from an asymptotic spectrum of particle, with a spectral index . The threshold proton energy is set to .
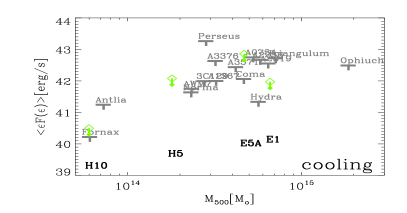
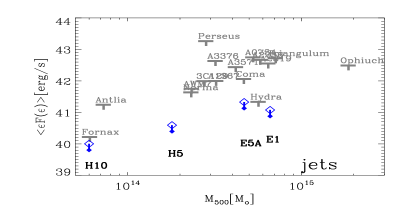
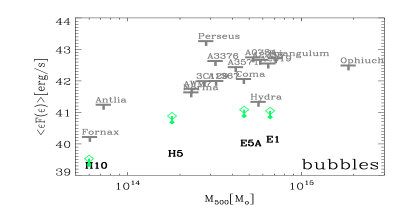
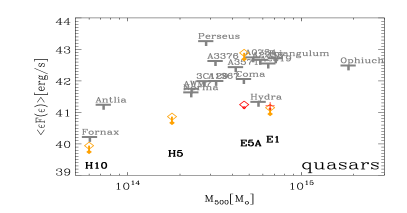
Our results for each implementation of AGN are shown in Fig.12, where we show the absolute luminosity of simulated clusters in the energy range, (typically the most sensitive in terms of average differential energy flux) and the upper limits from FERMI observations of Ackermann et al. (2010), as a function of the total cluster mass within . The results in this energy range do not depend much on the assumed spectrum of particles, and the difference between and is only percent in -flux (shown by different symbols).
All pure cooling runs produce an excess of -emission compared to FERMI upper-limits, up to a factor . This is mainly due to the large density of thermal targets for the proton-proton collision within the cooling radius.
Runs with AGN feedback, on the other hand, are below present-day FERMI upper limits (with the exception of the quasar run of E5A, with per event). The bubble-feedback seems to provide the lowest amount of -emission across the sample, with -ray flux about times below the FERMI upper limits within each mass bin. Jet and quasar feedback also produce -emission below the upper limits, but by a smaller factor.
Based on current upper-limits from FERMI (Ackermann et al., 2010) and the rather small sample of simulated clusters, it is not possible to reject any of the feedback models based on the predicted -ray luminosity. However, this approach can put robust constraints on feedback models and energetics, complementary to the analysis of X-ray profiles. Indeed, while the radial profiles of gas entropy, temperature and density studied in Sec.3.1 cannot alone lead to a clear assessment of which feedback mode is more suitable to explain observations, a times lower limit on -emission could already rule out the jet/quasar modes.
Fujita & Ohira (2012) recently simulated the effects of injection, streaming and heating of CRs from the central AGN in the Perseus clusters, producing estimates of non-thermal radiation from secondary particles at several wavelengths. The -ray luminosities produced by our AGN runs for cluster H5 (which has a mass close to Perseus) are of the same order of magnitude as in the fiducial model in Fujita & Ohira (2012), . This is orders of magnitude below the FERMI upper limit at . Our AGN runs are similar to other cosmological simulations that estimate the -ray power from secondary particles in clusters (Donnert et al., 2010b; Pinzke & Pfrommer, 2010a), our results. Contrary to Pinzke & Pfrommer (2010a), we do not excise dense overcooled clumps from the simulated volume and the contribution of shocks related to AGN activity is added to the contribution of CRs from cosmological shocks. While a part of the gas mass locked into these dense clump would eventually lead to star formation and produce cluster galaxies, these structures are the same that are responsible for the production of the un-realistic X-ray properties (Sec.3.1) and therefore their excision would just “mask” a dramatic problem of the simulation. In addition, without the inclusion of star-formation processes in our simulation, it is difficult to establish which part of these cold clumps would turn into galaxies, and therefore removing their contribution in -emission would be arbitrary. The -ray power from the CRs accelerated at cosmological shocks only is slightly smaller than in Pinzke & Pfrommer (2010a). The fact that the total -ray power from our clusters is lower than in SPH calculations stems from the typicall lower innermost gas density resulting in Eulerian simulations, and also in the the different way in which SPH and grid methods model the accretion of gas matter within cluster cores, as already investigated in Vazza et al. (2011b). For the numerical reasons for that, we refer the reader to Agertz et al. (2007); Wadsley et al. (2008); Mitchell et al. (2009).
3.4 Turbulent motions
Feedback from AGN may add turbulent energy to the already turbulent state of the ICM. Unlike in our previous work (Vazza et al., 2012), with this set of simulations we can study turbulent motions from, both, the accretion of matter and AGN feedback (in its different modes).
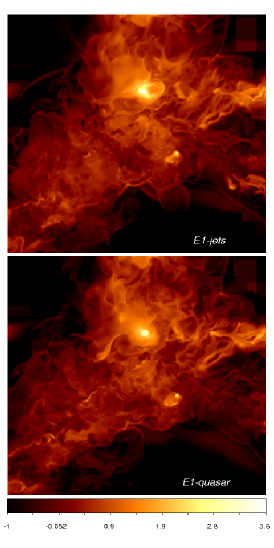
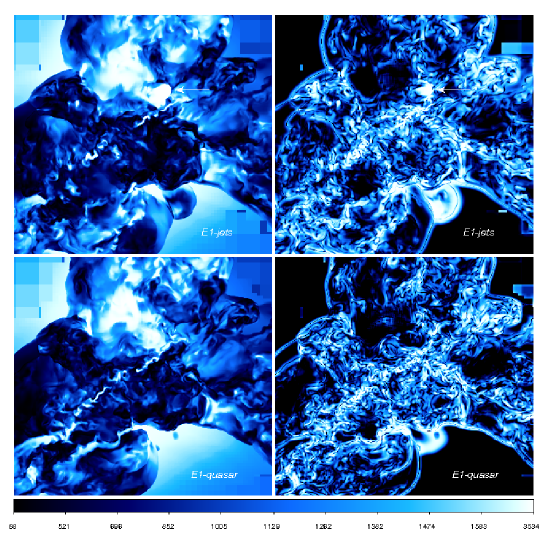
In Figure 13, we show a map of turbulence reconstructed with the same multi-scale filtering technique of Vazza et al. (2012), considering one run with jet-feedback (top panels) and in one with quasar-feedback (bottom panels). From left to right, the maps of gas density, total velocity and turbulent for a thin slice () through the cluster centre are shown. This system has an ongoing merger at this redshift, plus large-scale accretion of gas/DM matter along at least three filaments. These processes drive motions with bulk velocities of on scales, and turbulent velocities of on scales of . In the run with jets an additional horizontal velocity pattern of is present (indicated by an arrow within the panels). This is the outcome of a recent jet burst, launched ago. Even if the jet output dominates the velocity and the turbulent velocity field in the surroundings of the cluster core (), making it anisotropic, the overall velocity and turbulence within the cluster volume are dominated by the large merger, with a pattern similar to the quasar-mode.
In general, we find that feedback affect the turbulent velocity field in our simulations in two ways. First, by driving turbulence locally to the AGN (e.g. along the jets or behind the wake of bubbles), in addition to the overall cluster velocity field. This is a general findings in simulations (e.g. Scannapieco & Brüggen, 2008; Heinz et al., 2010; Gaspari et al., 2011a; Dubois et al., 2011).
Second, by affecting the compactness of accreted substructures and cluster satellites, thus affecting their ram-pressure-stripping and their efficiency in stirring the ICM. Overall, this makes the trend of turbulence in the different feedback modes non-trivial to identify, and close to the AGN highly time-dependent.
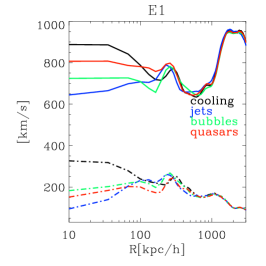
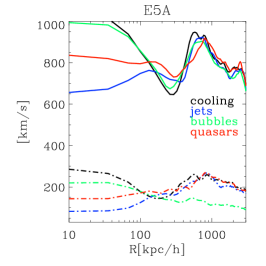
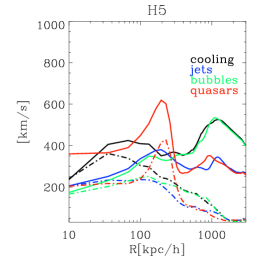
This is confirmed also by the radial profiles of velocity and turbulence for the three most massive clusters (Fig.14). While the velocity profiles at are quite similar (except that for the cluster core) in E1, increasingly larger variations between modes are found in E5A and in H5. In all cases, the pure cooling run produces the highest total and turbulent velocity field. This is typical of pure-cooling runs (e.g. Dubois et al., 2011; Li & Bryan, 2012), and a result of the transonic cooling flow. In addition, overcooling leads to more compact substructures, that are more efficient drivers of turbulent motions during their orbits (e.g. Valdarnini, 2011).
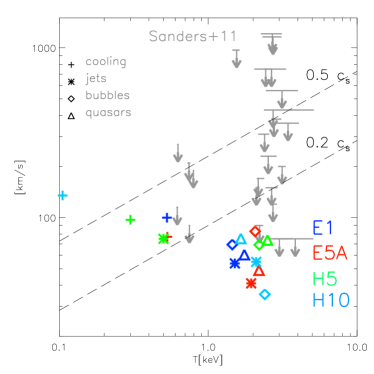
Sanders et al. (2011) recently computed upper limits from the maximally allowed amount of turbulence for a collection of 28 nearby (mostly cool-core) galaxy clusters, by fitting a thermal multi-temperature spectrum to observed XMM-Newton spectra. Following the same procedure as in Vazza et al. (2011a), we computed the turbulent velocity field on kpc scales (which roughly corresponds to the projected volume available to the observations of Sanders et al. 2011) for our cluster runs. Since the turbulent energy spectrum on the smallest spatial scales may be affected by numerical effects on the smallest scale (e.g. Porter & Woodward, 1994), the energy of the turbulent motions on scales kpc was calculated analytically from the measured total power spectrum on larger scales assuming Kolmogorov scaling 666In this case the Kolmogorov slope maximises the possible contribution of unresolved structures of the velocity field, since in general a slightly steeper power-spectrum is measured in these simulations at the smallest scale (Vazza et al., 2009, 2011a). Numerical dissipation makes it difficult to constrain the slope at the smallest scale with precision, and therefore our choice here already provides the most robust possible test against observed upper-limits of turbulence.
In Fig.15 we show the comparison between the simulated points at and the XMM-Newton limits for the galaxy clusters of the sample. As in Vazza et al. (2011a), the values for the cores of simulated clusters are generally below the observed upper limits. However, the pure-cooling runs show a velocity slightly in excess of some observed objects. AGN feedback generally reduces turbulent velocities within the core (as shown above) and pushes the observed temperature from the core to higher values. Basically all observable turbulent velocities on the kpc scale are below upper limits (with the exception of the re-simulation of E5A using bubbles, in which the turbulent velocity is of the order of the 2 lowest available upper limits within the same temperature range). This statistics is much more time-dependent than the -ray fluxes, given the very small time scale associated with a change of the average innermost temperature and small-scale gas velocity, in response to AGN feedback events. In these runs, we verified that variations of factors in the average temperature, and of factors in small-scale turbulence can easily be found by comparing epochs separated by Myr. Radiative cooling and dissipation of turbulent motions on the one hand, and violent heating and driving of outflows from the AGN on the other can cause such negative and positive fluctuations of the measured temperatures and velocities inside . Taking this into account, we suggest that by using this technique it may be less straightforward to unveil the presence of specific AGN modes in the real observation. Nevertheless, this approach appears still useful to limit the available energy budget of AGN feedback.
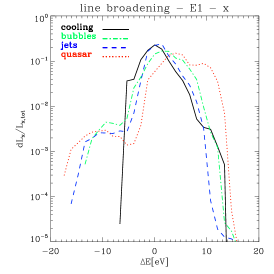
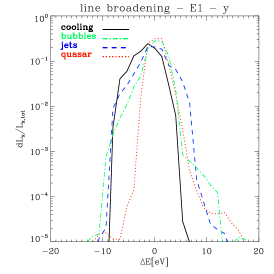
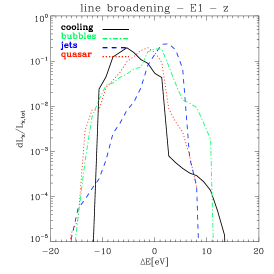
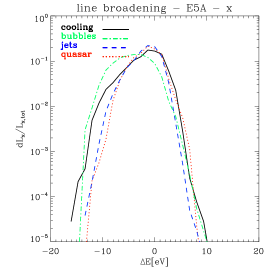
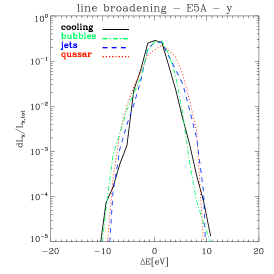
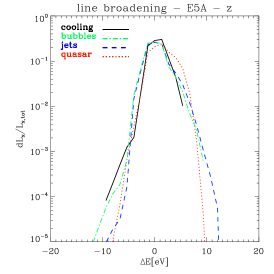
A complementary viable option in the near future is represented by X-ray spectroscopy of Doppler-broadened iron lines in the ICM, such as the Fe XXIII line at . Several theoretical works already tested the impact of mergers (e.g. Sunyaev et al., 2003; Dolag et al., 2005; Brüggen et al., 2005; Vazza et al., 2010; Zhuravleva et al., 2012). or AGN-feedback (e.g. Brüggen et al., 2005; Heinz et al., 2010) in shaping the Fe XXIII line with numerical simulations. In this case we can provide an overall view of the impact of various AGN modes on the shape of the Fe XXIII line in our simulated clusters.
In Fig.16 we show the simulated broadening of the iron line from a region of centred on clusters E1 and E5A, considering the three lines of sights. We also included the effect of thermal broadening since feedback can simultaneously change the temperature of emitting gas along the line of sight. To normalize the effect of very bright emission in the cooling run, we normalize all lines to their integrated luminosity within the field of view. The general effect of AGN feedback is to broaden the emission line, compared to the pure-cooling run, producing additional structures of high velocity tails (even if with very low associated luminosity) with a FWHM . The different feedback modes present the largest difference along the z-direction (which is the direction of the jets). Run E1 presents the largest difference, since jets were active more recently in this system. However, we find that in general disentangling the role of gravity-induced motions and of non-gravitational processes is a very difficult task. Another problem is that the high-velocity material must entrain enough high-emissivity material to be detectable (Brüggen et al., 2005; Heinz et al., 2010). In order to efficiently deal with ”width-driven” or ”separation-driven” features of the broadened emission, and to disentangle the different sources of them, sophisticated techniques are being developed (e.g. Shang & Oh, 2012, and references therein).
4 Discussion
In this work we simulated the evolution of thermal and non-thermal properties of a small sample of galaxy clusters with a customized version of the AMR code ENZO (Norman et al., 2007; Collins et al., 2010). The basic features of our two-fluid model have been presented in Vazza et al. (2012), while the implementation of shock-re-acceleration of CRs, Coulomb and secondary losses and different modes of AGN feedback have been introduced in this work (Sec.2.1-2.2). To our knowledge, this is the first time that non-thermal effects connected to cosmological shock waves and AGN feedback are studied with cosmological simulations. We tested the performance of a subset of recipes for AGN feedback (see, however, the Appendix for a larger survey of models) against available observations of thermal profiles derived from CHANDRA X-ray observations (Sec.3.1), upper-limits of secondary -emission from FERMI observations (Sec.3.3) and upper-limits of turbulent motions from XMM-Newton observations (Sec.3.4). Our main result is that non-thermal observables allow us to assess the reliability of each feedback mode against available upper-limits, and is thus complementary to X-ray observations. For a more detailed discussion of the possible consequences of this method we refer the reader to Sec.5.
Here we list the main limitations of our current numerical method, and the way in which our results can be affected or biased.
Firstly, our recipe to identify AGN-like cells in the simulated cluster volume (Sec.2.2) relies on the heuristic choice of a threshold in gas density (). This choice is based on a comparison with the typical gas density of environments hosting super-massive BHs, reported in numerical work by other groups (e.g. Sijacki et al., 2007; Teyssier et al., 2011). The lack of the more consistent use of sink-particles to model at run-time the growth and accretion rate of BHs can be addressed with future developments in ENZO 2.0 (Collins et al., 2010).
Secondly, we re-simulated a few clusters with several implementations of AGN feedback in order to compute the final budget of CR energy and their related -flux. These simulations are fairly expensive, and an extended survey of a large sample of clusters re-simulated with all variations of AGN feedback is currently beyond our means. For this reason, an investigation of the presence of a bimodality in the distribution of cool-core and non-cool-core clusters in our dataset was not possible. This is left to future work.
The recipe for radiative cooling is fairly idealized, and relies on the public implementation of equilibrium cooling in a fully-ionized H-He plasma with constant metallicity. Even though a more self-consistent inclusion of metal ejection from supernovae and galactic winds and line cooling can exacerbate the cooling catastrophe in radiative simulations (Dubois et al., 2011), the overall energy budget required from AGN feedback in our simulations (and its influence on the CR energy budget) should not be significantly affected. However, the inclusion of metals in our description of the ICM can provide an additional way of studying turbulent motions in the ICM, since successful implementations of feedback must yield the bimodality of metallicity profiles observed in cool-core and non-cool-core clusters (e.g. Leccardi & Molendi, 2008).
The neglect of star formation may artificially increase (by a per cent, Smith et al. e.g. 2011, and references therein; Cen & Chisari e.g. 2011, and references therein) the mass of the hot gas phase in our runs here. At the same time, the inclusion of feedback from star formation and supernovae might somewhat reduce the energy budget required from AGN (e.g. Tornatore et al., 2003; Valdarnini, 2003; Nagai et al., 2007; Short et al., 2012). We will investigate this topic in the near future, using simulations with the effect of star formation included.
The inclusion of magnetic fields in these simulations is not expected to change the overall thermal structure of the ICM (Dolag et al., 1999; Xu et al., 2009; Collins et al., 2010). It can, however, affect the mixing of jets and bubbles with the ICM (O’Neill & Jones, 2010; Mendygral et al., 2012).
A final important caveat concerns the spatial resolution of our runs. The minimum cell size of (almost uniform within the AMR region) is sufficient to capture shock waves and turbulent features related to cluster mergers (as in Vazza et al., 2011a). However, it is barely enough to capture the interplay between the AGN region and the cluster core. Modelling the accretion rate on the central galaxy at the centre of the cooling radius (Li & Bryan, 2012), the small-scale interaction between jets (e.g. Heinz et al., 2006; Morsony et al., 2010; Gaspari et al., 2012) or inflated bubbles (e.g. Scannapieco & Brüggen, 2008; Sijacki et al., 2008), requires a resolution of the order of . Moreover, to resolve the turbulence excited by cluster mergers, sloshing and AGN-jets in the same simulation, one would need to cover scales ranging from down to the presumed scale of physical dissipation at kpc, in a rather uniform way, for a range of scales of .
5 Conclusions
What can be learned from this exercise of comparing thermal and non-thermal observables of simulated and observed clusters? We argue that the approach outlined here can put robust constraints on the energetics, duty cycle, mechanism and epochs of feedback from AGN. Even if with present data it is not yet possible to reject specific implementations of feedback, it can be a powerful approach in the near future. The amount of CR injection after each AGN burst is assumed to be given by the shock acceleration efficiency of diffusive shock acceleration in (Kang & Jones, 2007; Caprioli, 2012). The other mechanisms of dynamical (e.g. advection with the fluid) or energy (e.g. secondary losses) evolution of CRs depend the dynamics of the simulated ICM. All additional mechanisms of CR injection that we neglected here (e.g. direct injection from supernovae, galactic winds, magnetic reconnection) cannot but increase the budget of CRs in the ICM, even if not substantially. Therefore, it is likely that our limits of -emission from CRs are slightly low. We also remark that other mechanisms of CRs, such has CRs diffusion (e.g. Hanasz & Lesch, 2000; Jubelgas et al., 2008), should be negligible for the scales of interest here (e.g. Blasi et al., 2007, and references therein)777In Enßlin et al. (2011) it is argued that if CR can stream along a quasi radial magnetic field much faster than the Alfvén speed, the CR-energy density in radio-quiet clusters would be greatly reduced. However, it seems that such an hypothesis can be excluded on theoretical grounds (Achterberg, 1981; Schlickeiser, 1989, 1994; Farmer & Goldreich, 2004), and also based on a large number of Faraday Rotation (Enßlin & Vogt, 2003; Murgia et al., 2004; Clarke, 2004; Guidetti et al., 2008; Bonafede et al., 2010; Vacca et al., 2010) and polarization (Bonafede et al., 2011) data from nearby clusters, that seem to exclude a systematic difference in the topology of the ICM magnetic fields between clusters with and without large-scale emission. .
Therefore, in the near future a set of -observation significantly below these numerical estimates for jets/AGN feedback may imply one of the following possibilities:
- •
-
•
the acceleration efficiency of CRs at shocks (which are typical in AGN bursts and cluster mergers) is lower than what we assumed here. Indeed, the details of particle acceleration for are not yet robustly constrained by theory due to the difficulty of modelling the large range of spatial and temporal scales involved in the diffusive acceleration at such shocks (e.g. Kang & Ryu, 2010). More recently, several groups employing particle-in-cells methods investigated additional acceleration mechanisms for particles at shocks (e.g. shock drift acceleration), suggesting the possibilities of a different dependence on Mach number (Gargaté & Spitkovsky, 2011). In addition, there is now growing evidence that the non-linear diffusive shock acceleration model has to be slightly revised to fully explain recent data from supernovae (Caprioli, 2012).
-
•
the actual quenching of catastrophic cooling in real clusters can happen over time through a mixture of ”violent” (jets, quasar) and more ”quiet” (e.g. bubbles) episodes. A physically motivated mixture of these different violent and quiet phases may in principle quench the cooling catastrophe without injecting too large CR-energy in the ICM. Theoretical work, indeed, suggests that this is a viable possibility (e.g. Sijacki et al., 2007; McCarthy et al., 2008; Short et al., 2012).
Based on the results presented in this paper, we argue that in the future a careful modelling of non-thermal observables will be important to improve our understanding of AGN feedback. Despite the energy that is theoretically available for AGN feedback, the AGN cannot be arbitrarily impulsive or continuous because in both cases this will affect observable non-thermal phenomena (such as turbulence and the injection of CR-energy). In particular, given the extremely long time for Coulomb and hadronic losses of CR-protons in the ICM, the investigation of (lack of) -emission or radio-emission from secondary particles is a powerful tool to unravel feedback during the earliest phases of structure formation.
acknowledgements
We thank the referee for the very helpful comments, which improved the final quality of the paper. F.V. and M.B. acknowledge support from the grant FOR1254 from the Deutsche Forschungsgemeinschaft. F.V. acknowledges the usage of computational resources under the CINECA-INAF 2008-2010 agreement, and at the at the John-Neumann Institut at the Forschungszentrum Jülich. We thank J. Donnert, D. Collins, M. Gaspari, F. Brighenti & K. Dolag and G. Brunetti for very useful scientific discussions, and J. Sanders for kindly providing the observed data-points of Fig.15. We gratefully acknowledge the ENZO development group for providing extremely helpful and well-maintained on-line documentation and tutorials (http://lca.ucsd.edu/software/enzo/).
References
- Abel et al. (1998) Abel T., Anninos P., Norman M. L., Zhang Y., 1998, ApJ, 508, 518
- Achterberg (1981) Achterberg A., 1981, A & A, 98, 161
- Ackermann et al. (2010) Ackermann M. et al., 2010, ApJL, 717, L71
- Ackermann et al. (2012) Ackermann M. et al., 2012, ApJ, 747, 121
- Agertz et al. (2007) Agertz O. et al., 2007, MNRAS, 380, 963
- Aleksić et al. (2012) Aleksić J. et al., 2012, A & A, 541, A99
- Ando & Nagai (2008) Ando S., Nagai D., 2008, MNRAS, 385, 2243
- Bell (1978) Bell A. R., 1978, MNRAS, 182, 147
- Berezinsky et al. (1997) Berezinsky V. S., Blasi P., Ptuskin V. S., 1997, ApJ, 487, 529
- Bertschinger & Meiksin (1986) Bertschinger E., Meiksin A., 1986, ApJL, 306, L1
- Bhattacharya et al. (2008) Bhattacharya S., Di Matteo T., Kosowsky A., 2008, MNRAS, 389, 34
- Bialek et al. (2001) Bialek J. J., Evrard A. E., Mohr J. J., 2001, ApJ, 555, 597
- Binney & Tabor (1995) Binney J., Tabor G., 1995, MNRAS, 276, 663
- Blandford & Ostriker (1978) Blandford R. D., Ostriker J. P., 1978, ApJL, 221, L29
- Blasi & Colafrancesco (1999) Blasi P., Colafrancesco S., 1999, Astropart. Phys., 122, 169
- Blasi et al. (2007) Blasi P., Gabici S., Brunetti G., 2007, International Journal of Modern Physics A, 22, 681
- Bonafede et al. (2010) Bonafede A., Feretti L., Murgia M., Govoni F., Giovannini G., Dallacasa D., Dolag K., Taylor G. B., 2010, A & A, 513, A30
- Bonafede et al. (2011) Bonafede A., Govoni F., Feretti L., Murgia M., Giovannini G., Brüggen M., 2011, A & A, 530, A24
- Borgani et al. (2008) Borgani S., Diaferio A., Dolag K., Schindler S., 2008, Science & Space Review, 134, 269
- Bregman & David (1988) Bregman J. N., David L. P., 1988, ApJ, 326, 639
- Brighenti & Mathews (2000) Brighenti F., Mathews W. G., 2000, ApJ, 535, 650
- Brighenti & Mathews (2001) Brighenti F., Mathews W. G., 2001, ApJ, 553, 103
- Brighenti & Mathews (2006) Brighenti F., Mathews W. G., 2006, ApJ, 643, 120
- Brown et al. (2011) Brown S., Emerick A., Rudnick L., Brunetti G., 2011, ApJL, 740, L28
- Brüggen et al. (2005) Brüggen M., Hoeft M., Ruszkowski M., 2005, ApJ, 628, 153
- Brüggen & Kaiser (2002) Brüggen M., Kaiser C. R., 2002, Nature, 418, 301
- Brunetti (2009) Brunetti G., 2009, A & A, 508, 599
- Brunetti et al. (2009) Brunetti G., Cassano R., Dolag K., Setti G., 2009, A & A, 507, 661
- Brunetti & Lazarian (2011a) Brunetti G., Lazarian A., 2011a, MNRAS, 410, 127
- Brunetti & Lazarian (2011b) Brunetti G., Lazarian A., 2011b, MNRAS, 412, 817
- Brunetti et al. (2007) Brunetti G., Venturi T., Dallacasa D., Cassano R., Dolag K., Giacintucci S., Setti G., 2007, ApJL, 670, L5
- Bryan & Norman (1998) Bryan G. L., Norman M. L., 1998, ApJ, 495, 80
- Bryan et al. (1995) Bryan G. L., Norman M. L., Stone J. M., Cen R., Ostriker J. P., 1995, Computer Physics Communications, 89, 149
- Burns et al. (2008) Burns J. O., Hallman E. J., Gantner B., Motl P. M., Norman M. L., 2008, ApJ, 675, 1125
- Caprioli (2012) Caprioli D., 2012, ArXiv e-prints 1206.1360
- Cattaneo & Teyssier (2007) Cattaneo A., Teyssier R., 2007, MNRAS, 376, 1547
- Cavagnolo et al. (2009) Cavagnolo K. W., Donahue M., Voit G. M., Sun M., 2009, ApJS, 182, 12
- Cen & Chisari (2011) Cen R., Chisari N. E., 2011, ApJ, 731, 11
- Churazov et al. (2001) Churazov E., Brüggen M., Kaiser C. R., Böhringer H., Forman W., 2001, ApJ, 554, 261
- Ciotti & Ostriker (1997) Ciotti L., Ostriker J. P., 1997, ApJL, 487, L105
- Ciotti & Ostriker (2012) Ciotti L., Ostriker J. P., 2012, in Astrophysics and Space Science Library, Vol. 378, Kim D.-W., Pellegrini S., ed, Astrophysics and Space Science Library, p. 83
- Clarke (2004) Clarke T. E., 2004, Journal of Korean Astronomical Society, 37, 337
- Colafrancesco et al. (2004) Colafrancesco S., Dar A., De Rújula A., 2004, A & A, 413, 441
- Collins et al. (2010) Collins D. C., Xu H., Norman M. L., Li H., Li S., 2010, ApJS, 186, 308
- Dalla Vecchia et al. (2004) Dalla Vecchia C., Bower R. G., Theuns T., Balogh M. L., Mazzotta P., Frenk C. S., 2004, MNRAS, 355, 995
- Dalla Vecchia & Schaye (2008) Dalla Vecchia C., Schaye J., 2008, MNRAS, 387, 1431
- David et al. (2001) David L. P., Nulsen P. E. J., McNamara B. R., Forman W., Jones C., Ponman T., Robertson B., Wise M., 2001, ApJ, 557, 546
- Dennison (1980) Dennison B., 1980, ApJL, 239, L93
- Dolag et al. (1999) Dolag K., Bartelmann M., Lesch H., 1999, A & A, 348, 351
- Dolag & Enßlin (2000) Dolag K., Enßlin T. A., 2000, A & A, 362, 151
- Dolag et al. (2005) Dolag K., Vazza F., Brunetti G., Tormen G., 2005, MNRAS, 364, 753
- Donnert et al. (2010a) Donnert J., Dolag K., Brunetti G., Cassano R., Bonafede A., 2010a, MNRAS, 401, 47
- Donnert et al. (2010b) Donnert J., Dolag K., Cassano R., Brunetti G., 2010b, MNRAS, 407, 1565
- Drury & Voelk (1981) Drury L. O., Voelk J. H., 1981, ApJ, 248, 344
- Dubois et al. (2010) Dubois Y., Devriendt J., Slyz A., Teyssier R., 2010, MNRAS, 409, 985
- Dubois et al. (2012) Dubois Y., Devriendt J., Slyz A., Teyssier R., 2012, MNRAS, 420, 2662
- Dubois et al. (2011) Dubois Y., Devriendt J., Teyssier R., Slyz A., 2011, MNRAS, 417, 1853
- Dunn et al. (2010) Dunn J. P. et al., 2010, ApJ, 709, 611
- Eckert et al. (2011) Eckert D. et al., 2011, ArXiv e-prints
- Ellison et al. (1995) Ellison D. C., Baring M. G., Jones F. C., 1995, ApJ, 453, 873
- Enßlin et al. (2011) Enßlin T., Pfrommer C., Miniati F., Subramanian K., 2011, A & A, 527, A99
- Enßlin & Vogt (2003) Enßlin T. A., Vogt C., 2003, A & A, 401, 835
- Ettori et al. (2009) Ettori S., Morandi A., Tozzi P., Balestra I., Borgani S., Rosati P., Lovisari L., Terenziani F., 2009, A & A, 501, 61
- Fabian et al. (1984) Fabian A. C., Nulsen P. E. J., Canizares C. R., 1984, Nature, 310, 733
- Fabjan et al. (2010) Fabjan D., Borgani S., Tornatore L., Saro A., Murante G., Dolag K., 2010, MNRAS, 401, 1670
- Farmer & Goldreich (2004) Farmer A. J., Goldreich P., 2004, ApJ, 604, 671
- Fujita & Ohira (2011) Fujita Y., Ohira Y., 2011, ApJ, 738, 182
- Fujita & Ohira (2012) Fujita Y., Ohira Y., 2012, ApJ, 746, 53
- Gabor et al. (2011) Gabor J. M., Davé R., Oppenheimer B. D., Finlator K., 2011, MNRAS, 417, 2676
- Gargaté & Spitkovsky (2011) Gargaté L., Spitkovsky A., 2011, ArXiv e-prints
- Gaspari et al. (2011a) Gaspari M., Brighenti F., D’Ercole A., Melioli C., 2011a, MNRAS, 415, 1549
- Gaspari et al. (2011b) Gaspari M., Melioli C., Brighenti F., D’Ercole A., 2011b, MNRAS, 411, 349
- Gaspari et al. (2012) Gaspari M., Ruszkowski M., Sharma P., 2012, ApJ, 746, 94
- Guidetti et al. (2008) Guidetti D., Murgia M., Govoni F., Parma P., Gregorini L., de Ruiter H. R., Cameron R. A., Fanti R., 2008, A & A, 483, 699
- Guo & Oh (2008) Guo F., Oh S. P., 2008, MNRAS, 384, 251
- Hanasz & Lesch (2000) Hanasz M., Lesch H., 2000, ApJ, 543, 235
- Heinz et al. (2010) Heinz S., Brüggen M., Morsony B., 2010, ApJ, 708, 462
- Heinz et al. (2006) Heinz S., Brüggen M., Young A., Levesque E., 2006, MNRAS, 373, L65
- Jeltema & Profumo (2011) Jeltema T. E., Profumo S., 2011, ApJ, 728, 53
- Jones & Kang (1993) Jones T. W., Kang H., 1993, ApJ, 402, 560
- Jubelgas et al. (2008) Jubelgas M., Springel V., Enßlin T., Pfrommer C., 2008, A & A, 481, 33
- Kaiser (1991) Kaiser N., 1991, ApJ, 383, 104
- Kang & Jones (1990) Kang H., Jones T. W., 1990, ApJ, 353, 149
- Kang & Jones (2007) Kang H., Jones T. W., 2007, Astroparticle Physics, 28, 232
- Kang & Ryu (2010) Kang H., Ryu D., 2010, ApJ, 721, 886
- Kang et al. (2007) Kang H., Ryu D., Cen R., Ostriker J. P., 2007, ApJ, 669, 729
- Kim et al. (2011) Kim J.-h., Wise J. H., Alvarez M. A., Abel T., 2011, ApJ, 738, 54
- Kravtsov & Borgani (2012) Kravtsov A., Borgani S., 2012, ArXiv e-prints 1205.5556
- Lapi et al. (2005) Lapi A., Cavaliere A., Menci N., 2005, ApJ, 619, 60
- Lapi et al. (2010) Lapi A., Fusco-Femiano R., Cavaliere A., 2010, A & A, 516, A34
- Leccardi & Molendi (2008) Leccardi A., Molendi S., 2008, A & A, 487, 461
- Li & Bryan (2012) Li Y., Bryan G. L., 2012, ApJ, 747, 26
- Lloyd-Davies et al. (2000) Lloyd-Davies E. J., Ponman T. J., Cannon D. B., 2000, MNRAS, 315, 689
- Loewenstein et al. (1991) Loewenstein M., Zweibel E. G., Begelman M. C., 1991, ApJ, 377, 392
- Malkov & O’C Drury (2001) Malkov M. A., O’C Drury L., 2001, Reports on Progress in Physics, 64, 429
- Martizzi et al. (2012) Martizzi D., Teyssier R., Moore B., Wentz T., 2012, MNRAS, 422, 3081
- Mathews & Brighenti (2007) Mathews W. G., Brighenti F., 2007, ApJ, 660, 1137
- Mathews & Guo (2011a) Mathews W. G., Guo F., 2011a, ApJ, 736, 6
- Mathews & Guo (2011b) Mathews W. G., Guo F., 2011b, ApJ, 738, 155
- McCarthy et al. (2008) McCarthy I. G., Babul A., Bower R. G., Balogh M. L., 2008, MNRAS, 386, 1309
- McCarthy et al. (2004) McCarthy I. G., Balogh M. L., Babul A., Poole G. B., Horner D. J., 2004, ApJ, 613, 811
- McCarthy et al. (2010) McCarthy I. G. et al., 2010, MNRAS, 406, 822
- McCourt et al. (2011) McCourt M., Parrish I. J., Sharma P., Quataert E., 2011, MNRAS, 413, 1295
- McNamara & Nulsen (2007) McNamara B. R., Nulsen P. E. J., 2007, ARAA, 45, 117
- McNamara & Nulsen (2012) McNamara B. R., Nulsen P. E. J., 2012, New Journal of Physics, 14, 055023
- Mendygral et al. (2012) Mendygral P. J., Jones T. W., Dolag K., 2012, ApJ, 750, 166
- Miniati (2003) Miniati F., 2003, MNRAS, 342, 1009
- Mitchell et al. (2009) Mitchell N. L., McCarthy I. G., Bower R. G., Theuns T., Crain R. A., 2009, MNRAS, 395, 180
- Morsony et al. (2010) Morsony B. J., Heinz S., Brüggen M., Ruszkowski M., 2010, MNRAS, 407, 1277
- Murgia et al. (2004) Murgia M., Govoni F., Feretti L., Giovannini G., Dallacasa D., Fanti R., Taylor G. B., Dolag K., 2004, A & A, 424, 429
- Nagai et al. (2007) Nagai D., Kravtsov A. V., Vikhlinin A., 2007, ApJ, 668, 1
- Narayan & Medvedev (2001) Narayan R., Medvedev M. V., 2001, ApJL, 562, L129
- Nesvadba et al. (2006) Nesvadba N. P. H., Lehnert M. D., Eisenhauer F., Gilbert A., Tecza M., Abuter R., 2006, ApJ, 650, 693
- Norman et al. (2007) Norman M. L., Bryan G. L., Harkness R., Bordner J. a., 2007, ArXiv e-prints, 705
- O’Neill & Jones (2010) O’Neill S. M., Jones T. W., 2010, ApJ, 710, 180
- Oppenheimer & Davé (2006) Oppenheimer B. D., Davé R., 2006, MNRAS, 373, 1265
- Pfrommer & Enßlin (2004) Pfrommer C., Enßlin T. A., 2004, Journal of Korean Astronomical Society, 37, 455
- Pfrommer et al. (2007) Pfrommer C., Enßlin T. A., Springel V., Jubelgas M., Dolag K., 2007, MNRAS, 378, 385
- Pfrommer et al. (2006) Pfrommer C., Springel V., Enßlin T. A., Jubelgas M., 2006, MNRAS, 367, 113
- Pinzke & Pfrommer (2010a) Pinzke A., Pfrommer C., 2010a, MNRAS, 409, 449
- Pinzke & Pfrommer (2010b) Pinzke A., Pfrommer C., 2010b, MNRAS, 409, 449
- Pinzke et al. (2011) Pinzke A., Pfrommer C., Bergström L., 2011, Physical Review Letters, 84, 123509
- Ponman et al. (1999) Ponman T. J., Cannon D. B., Navarro J. F., 1999, Nature, 397, 135
- Poole et al. (2006) Poole G. B., Fardal M. A., Babul A., McCarthy I. G., Quinn T., Wadsley J., 2006, MNRAS, 373, 881
- Pope (2009) Pope E. C. D., 2009, MNRAS, 395, 2317
- Porter & Woodward (1994) Porter D. H., Woodward P. R., 1994, ApJS, 93, 309
- Pratt et al. (2010) Pratt G. W. et al., 2010, A & A, 511, A85
- Quataert (2008) Quataert E., 2008, ApJ, 673, 758
- Rasia et al. (2005) Rasia E., Mazzotta P., Borgani S., Moscardini L., Dolag K., Tormen G., Diaferio A., Murante G., 2005, ApJL, 618, L1
- Ruszkowski & Oh (2011) Ruszkowski M., Oh S. P., 2011, MNRAS, 414, 1493
- Ryu et al. (2003) Ryu D., Kang H., Hallman E., Jones T. W., 2003, ApJ, 593, 599
- Sanders et al. (2011) Sanders J. S., Fabian A. C., Smith R. K., 2011, MNRAS, 410, 1797
- Sarazin & White (1987) Sarazin C. L., White R. E., III, 1987, ApJ, 320, 32
- Scannapieco & Brüggen (2008) Scannapieco E., Brüggen M., 2008, ApJ, 686, 927
- Schlickeiser (1989) Schlickeiser R., 1989, ApJ, 336, 243
- Schlickeiser (1994) Schlickeiser R., 1994, ApJS, 90, 929
- Shakura & Sunyaev (1973) Shakura N. I., Sunyaev R. A., 1973, A & A, 24, 337
- Shang & Oh (2012) Shang C., Oh S. P., 2012, eprint arXiv:1204.6058
- Short et al. (2012) Short C. J., Thomas P. A., Young O. E., 2012, ArXiv e-prints 1201.1104
- Sijacki et al. (2008) Sijacki D., Pfrommer C., Springel V., Enßlin T. A., 2008, MNRAS, 387, 1403
- Sijacki & Springel (2006) Sijacki D., Springel V., 2006, MNRAS, 366, 397
- Sijacki et al. (2007) Sijacki D., Springel V., Di Matteo T., Hernquist L., 2007, MNRAS, 380, 877
- Sijacki et al. (2009) Sijacki D., Springel V., Haehnelt M. G., 2009, MNRAS, 400, 100
- Skillman et al. (2008) Skillman S. W., O’Shea B. W., Hallman E. J., Burns J. O., Norman M. L., 2008, ApJ, 689, 1063
- Smith et al. (2011) Smith B. D., Hallman E. J., Shull J. M., O’Shea B. W., 2011, ApJ, 731, 6
- Stott et al. (2012) Stott J. P. et al., 2012, MNRAS, 422, 2213
- Sun (2012) Sun M., 2012, New Journal of Physics, 14, 045004
- Sunyaev et al. (2003) Sunyaev R. A., Norman M. L., Bryan G. L., 2003, Astronomy Letters, 29, 783
- Teyssier et al. (2011) Teyssier R., Moore B., Martizzi D., Dubois Y., Mayer L., 2011, MNRAS, 414, 195
- Tornatore et al. (2003) Tornatore L., Borgani S., Springel V., Matteucci F., Menci N., Murante G., 2003, MNRAS, 342, 1025
- Tozzi & Norman (2001) Tozzi P., Norman C., 2001, ApJ, 546, 63
- Vacca et al. (2010) Vacca V., Murgia M., Govoni F., Feretti L., Giovannini G., Orrú E., Bonafede A., 2010, A & A, 514, A71
- Valdarnini (2002) Valdarnini R., 2002, ApJ, 567, 741
- Valdarnini (2003) Valdarnini R., 2003, MNRAS, 339, 1117
- Valdarnini (2011) Valdarnini R., 2011, A & A, 526, A158
- Vazza (2011) Vazza F., 2011, MNRAS, 410, 461
- Vazza et al. (2012) Vazza F., Brüggen M., Gheller C., Brunetti G., 2012, MNRAS, 2518
- Vazza et al. (2009) Vazza F., Brunetti G., Gheller C., 2009, MNRAS, 395, 1333
- Vazza et al. (2010) Vazza F., Brunetti G., Gheller C., Brunino R., 2010, New Astronomy, 15, 695
- Vazza et al. (2011a) Vazza F., Brunetti G., Gheller C., Brunino R., Brüggen M., 2011a, A & A, 529, A17
- Vazza et al. (2009) Vazza F., Brunetti G., Kritsuk A., Wagner R., Gheller C., Norman M., 2009, A & A, 504, 33
- Vazza et al. (2011b) Vazza F., Dolag K., Ryu D., Brunetti G., Gheller C., Kang H., Pfrommer C., 2011b, MNRAS, 418, 960
- Vazza et al. (2010) Vazza F., Gheller C., Brunetti G., 2010, A & A, 513, A32
- Vazza et al. (2012) Vazza F., Roediger E., Brueggen M., 2012, ArXiv e-prints 1202.5882
- Wadsley et al. (2008) Wadsley J. W., Veeravalli G., Couchman H. M. P., 2008, MNRAS, 387, 427
- Xu et al. (2009) Xu H., Li H., Collins D. C., Li S., Norman M. L., 2009, ApJL, 698, L14
- Zhuravleva et al. (2012) Zhuravleva I., Churazov E., Kravtsov A., Sunyaev R., 2012, MNRAS, 422, 2712
Appendix A Tests with varying parameters
In this Appendix we show results of a more extended study of the variation of thermal and CR properties of one cluster run (H10), with a more systematic exploration of the parameter space of our implementation of AGN feedback. To save computational time, all tests in this case have been performed using the standard mesh refinement strategy, where the grid is refined in regions where the gas/DM over-density is larger than 3 times the overdensity of the parent cell (the differences in the thermal properties inside are very small compared to the AMR criteria used in the main article, while in general the properties of accretion shocks and turbulent motions tend to be significantly affected by resolution issues and numerical dissipation, as discussed in Vazza et al. (2009) and Vazza (2011)).
Figure 17 shows the projected gas density and a temperature cut for four re-simulations of this cluster for the pure cooling case (C) and for 3 feedback models with similar feedback energy budget (A2, K2 and B2). Despite the fact that the outer accretion shocks are poorly described because of the AMR strategy employed here, the innermost region where the AGN feedback plays a role are resolved similarly to the runs studied in the main article.
Table A1 lists all re-simulations of H10 performed, with details on the adopted feedback model. In the ensemble of profiles shown in Fig.18-20 we show all profiles of thermal and CRs related properties for all re-simulations.
We compared one standard non-radiative run with CR feedback only from cosmological shock acceleration (as in Vazza et al. 2012, run NR0), one run where also the Coulomb and secondary losses are modelled (NR1) and the pure cooling case with losses for CRs (C).
Some results can be derived from this preliminary comparison of feedback modes, in additon to those already discussed in the main article. a) The adoption of a more standard AMR criterion still gives internal profiles and trends with AGN feedback very similar to the more expensive resimulations with AMR based also on velocity jumps. b) The thermal properties of the cluster are unchanged by the adoption of CR losses at run time (Fig A2). The amount of CR-energy within the innermost and the production rate of secondary particles (Eq.1) are however reduced by a factor due to CR losses. However, the inclusion of CR-losses is expected to reduce the cooling rate in radiative simulations, owing to the larger gas density attained there. However, CR-losses are not able to stem the cooling flow, unless other heating mechanisms by CRs (e.g. heating from Alfvén waves excited by the streaming of CRs in a magnetic field Fujita & Ohira, 2011) are at work. c) In the case of quasar feedback, an energy per event of (i.e. 10 times larger than the fiducial model for H10 discussed in the main paper) in a cluster of this mass creates a baryon poor system, and a unrealistically large ratio of CR to gas energy ( percent within the virial radius). d) For the quasar mode (Fig. A3), an energy per event of (i.e. 10 times smaller than the fiducial model for H10 discussed in the main paper) can produce an acceptable match to the observed X-ray profiles, similar to what we reported for the two largest cluster masses (Sec. 3.1). If AGN feedback is switched off too early (), a cooling catastrophe develops only for a small region, . e) In the jet mode (Fig.A4), too slow jets () are unable to quench the cooling flow. f) At this rather poor resolution, the investigated differences in the initial density contrast of bubbles (Fig.A4), or in their initial energy composition (i.e. thermal energy or CR-energy dominated) produce extremely similar result on the thermal and CR properties of the cluster at .
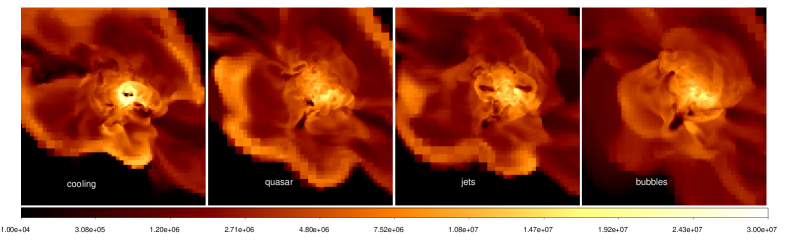
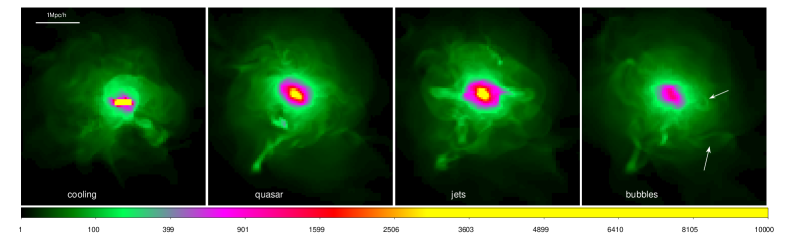
| ID | cooling | feedback mode | mnemonic |
| NR0 | no | no | no cooling,no.CR losses |
| NR1 | no | no | no cooling.,CR losses |
| C | yes | no | cooling |
| A1 | yes | thermal, | quasar low |
| A2 | yes | thermal, | quasar med. |
| A3 | yes | thermal, | quasar high. |
| A0 | yes | thermal, | early quasar |
| K2 | yes | kinetic, | jets high |
| K4 | yes | kinetic, | jets low |
| B2 | yes | buoyant, | bubbles |
| B4 | yes | buoyant, | bubbles |
| BC | yes | buoyant, , | bubbles |