The Protocluster G18.67+0.03: A Test Case for Class I CH3OH Masers as Evolutionary Indicators for Massive Star Formation
Abstract
We present high angular resolution Submillimeter Array (SMA) and Karl G. Jansky Very Large Array (VLA) observations of the massive protocluster G18.67+0.03. Previously targeted in maser surveys of GLIMPSE Extended Green Objects (EGOs), this cluster contains three Class I CH3OH maser sources, providing a unique opportunity to test the proposed role of Class I masers as evolutionary indicators for massive star formation. The millimeter observations reveal bipolar molecular outflows, traced by 13CO(2-1) emission, associated with all three Class I maser sources. Two of these sources (including the EGO) are also associated with 6.7 GHz Class II CH3OH masers; the Class II masers are coincident with millimeter continuum cores that exhibit hot core line emission and drive active outflows, as indicated by the detection of SiO(5-4). In these cases, the Class I masers are coincident with outflow lobes, and appear as clear cases of excitation by active outflows. In contrast, the third Class I source is associated with an ultracompact HII region, and not with Class II masers. The lack of SiO emission suggests the 13CO outflow is a relic, consistent with its longer dynamical timescale. Our data show that massive young stellar objects associated only with Class I masers are not necessarily young, and provide the first unambiguous evidence that Class I masers may be excited by both young (hot core) and older (UC HII) MYSOs within the same protocluster.
Subject headings:
ISM: individual objects (G18.67+0.03) — ISM: jets and outflows — ISM: molecules — masers — stars: formation — techniques: interferometric1. Introduction
The lack of a detailed, observationally based evolutionary sequence for massive young stellar objects (MYSOs) limits our understanding of the early stages of high mass (M8 M⊙) star formation. Massive stars form in (proto)clusters, with younger sources (such as hot cores) often found in close proximity to ultracompact (UC) HII regions (e.g. Hunter et al., 2006; Cyganowski et al., 2007, and references therein). Because massive protoclusters are generally distant (D1 kpc) and deeply embedded, most efforts to develop evolutionary sequences have focused on cm-wavelength maser transitions, which are amenable to high resolution study and unaffected by extinction. Four types of masers are ubiquitous: Class I and II CH3OH, H2O, and OH. Class I CH3OH and H2O masers are collisionally pumped in shocked gas, while Class II CH3OH and OH masers are radiatively pumped by infrared emission from warm dust (e.g. Elitzur et al., 1989; Cragg et al., 2002; Voronkov et al., 2006). CH3OH masers are key to proposed evolutionary sequences of masers in MYSOs, which posit that Class I CH3OH masers appear first (e.g. Ellingsen et al., 2007; Breen et al., 2010a), based in part on their observed association with outflows (e.g. Plambeck & Menten, 1990; Kurtz et al., 2004; Cyganowski et al., 2009). Class I-only sources have thus generally been interpreted as tracing the earliest stages of massive star formation (Ellingsen, 2006). Recent work, however, suggests that Class I CH3OH masers may also be excited in shocks driven by expanding HII regions (Voronkov et al., 2010), raising the possibility of multiple distinct epochs of Class I maser activity during MYSO evolution (Chen et al., 2011; Voronkov et al., 2012). The prevalence of Class I-only sources is currently unknown, primarily due to the lack of substantial untargeted searches in Class I maser transitions (see also Voronkov et al., 2010).
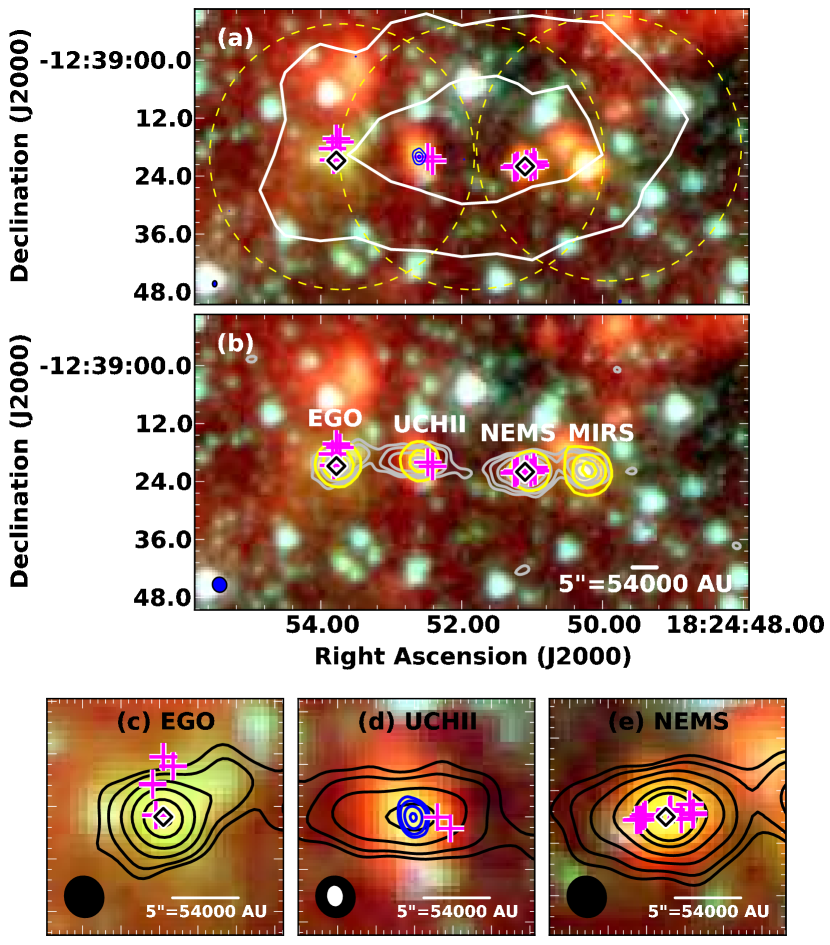
Our studies of a new sample of MYSO outflow candidates (Extended Green Objects (EGOs), selected based on extended 4.5 m emission in GLIMPSE images; Cyganowski et al., 2008) have identified a massive protocluster (M3510 M⊙; Schuller et al., 2009) that provides a unique opportunity to understand the evolution of Class I CH3OH masers: G18.67+0.03. Cyganowski et al. (2009) detected 44 GHz Class I CH3OH masers towards three mid-infrared (MIR) sources in this region: two (including the EGO) are also associated with 6.7 GHz Class II CH3OH masers (Fig. 1). The third–the only source in the region with a cm-wavelength continuum counterpart in deep Very Large Array (VLA) images (Cyganowski et al., 2011b)–has no Class II masers. Green & McClure-Griffiths (2011) assign both 6.7 GHz masers in G18.67+0.03 the far distance in their HI self-absorption study of Class II masers. Using the revised kinematic distance prescription of Reid et al. (2009) and thermal NH3 data, Cyganowski et al. (2012) find a similar far distance of 10.8 kpc, which we adopt here.
In this Letter, we present a high-resolution Submillimeter Array (SMA)111The Submillimeter Array is a joint project between the Smithsonian Astrophysical Observatory and the Academia Sinica Institute of Astronomy and Astrophysics and is funded by the Smithsonian Institution and the Academia Sinica. study of the mm-wavelength dust continuum and molecular line emission toward G18.67+0.03, to constrain the evolutionary states of the maser sources and the presence/absence of active outflows. The SMA is well-suited for deciphering MYSO relative evolutionary states (Beuther et al., 2009; Zhang et al., 2009; Wang et al., 2012). To provide kinematic information for the ionized gas, we include complementary 1.3 cm Karl G. Jansky Very Large Array (VLA) hydrogen recombination line and cm continuum observations.
2. Observations
SMA observations at 1.3mm were obtained on 18 June 2010 with 7 antennas in compact configuration, in good weather (0.07). A three-pointing mosaic was used to cover the extent of the (sub)mm clump (Fig. 1). The primary beam (FWHP) at 1.3 mm is 55″. The largest angular scale recoverable from these data is 20″. We observed 216.8-220.8 GHz in the lower sideband (LSB) and 228.8-232.8 GHz in the upper sideband (USB), each divided into 22 GHz IFs, with a uniform channel width of 0.8125 MHz. The calibrators were J1733-130 and J1911-201 (complex gain), 3C454.3 (bandpass), and Neptune (absolute flux density). The LSB was flux-calibrated using a model of Neptune’s brightness distribution and the MIRIAD task smaflux. This direct approach cannot be used for the USB because of strong 12CO in Neptune’s atmosphere. Instead, the USB flux density calibration was bootstrapped from the LSB assuming a spectral index 0.85 for 3C454.3 (based on SMA monitoring). Comparison of derived quasar flux densities with SMA monitoring suggests the absolute flux density calibration is accurate to better than 15%.
| Observed Properties | Derived Properties | |||||||||
|---|---|---|---|---|---|---|---|---|---|---|
| SourceaaAs designated in §3.1. | J2000 CoordinatesbbCoordinates of 1.3 mm continuum peak. The number of significant figures reflects a one-pixel uncertainty. | Peak Intensity | Integ. Flux DensityccIntegrated flux density within 3 contour, measured using the CASAVIEWER program. Following the approach developed for the CORNISH survey (Purcell et al., 2008), we estimate uncertainties as , where Nsr is the number of pixels in the source aperture, Nsky is the number of pixels in an off-source “sky” aperture, and is the standard deviation over the “sky” aperture. The quoted uncertainties are averages for 3 choices of “sky” apertures. | Tdust | Mgas | NddBeam-averaged | nddBeam-averaged | vLSReeDetermined from compact molecular line emission, §3.1. | ||
| Name | () | () | (mJy beam-1) | (mJy) | (K) | (M⊙) | (1023 cm-2) | (105 cm-3) | km s-1 | |
| EGO | 18 24 53.77 | -12 39 20.8 | 96 | 153(36) | 175 | 0.003 | 30 | 0.7 | 2.8 | 79 |
| CM1-UCHIIffPhysical properties calculated using the 1.3 mm flux density less the estimated free-free contribution of 5 mJy. | 18 24 52.59 | -12 39 20.0 | 36 | 126(41) | 50 | 0.008 | 100 | 2.1 | 8.6 | 80 |
| NEMS | 18 24 51.09 | -12 39 22.0 | 187 | 347(44) | 185 | 0.006 | 70 | 1.5 | 6.1 | 82 |
| MIRS | 18 24 50.27 | -12 39 22.0 | 44 | 92(32) | 81 | |||||
| Total | 718 | |||||||||
Initial calibration was performed in MIRIAD; the data were then exported to CASA for further processing. Each IF was processed independently, with the continuum estimated using line-free channels in the uv-plane, and separated from the line emission. The continuum was self-calibrated and the resulting solutions applied to the line data. The data were imaged using Briggs weighting and a robust parameter of 0.5. The final combined continuum image has a synthesized beamsize of 316295 (P.A.21∘) and a 1 rms of 1.5 mJy beam-1. The line data were resampled to v=1.2 km s-1, then Hanning-smoothed; the typical rms per channel is 40 mJy beam-1. All measurements were made from images corrected for the primary beam response.
The NRAO222The National Radio Astronomy Observatory is a facility of the National Science Foundation operated under agreement by the Associated Universities, Inc. VLA observations of G18.67+0.03 were obtained in the C configuration on 7 January 2011 as part of a 1.3 cm line and continuum survey of massive protostellar objects (program AB1346; Brogan et al., 2011). The calibrators were J1832-1035 (complex gain), J1924-2914 (bandpass), and 3C286 (absolute flux density). A single pointing was observed (18h24m53s.700, 12∘39′200); the primary beam (FWHP) is 2′. The data were calibrated and imaged in CASA. The full VLA dataset will be described in a future publication; here we consider only the 24.50878 GHz H64, 25.68788 GHz H63, and 24.64 GHz (1.2 cm) continuum data. The self-calibrated continuum image has a synthesized beamsize of 146108 (P.A.174∘) and a 1 rms of 74 Jy beam-1. To improve S/N, we smoothed the H63 and H64 data (to v4.8 km s-1, 2″), then averaged to obtain a final radio recombination line (RRL) image cube with 0.29 mJy beam-1. All measurements were made from images corrected for the primary beam response.
3. Results
3.1. Millimeter Continuum and Line Emission
As shown in Figure 1, we resolve four compact 1.3 mm continuum sources, arranged in a line of 50″ (2.6 pc) extent along the clump. All have 24 m counterparts. For ease of reference, we designate them (from E to W): EGO, CM1-UCHII, Non-EGO maser source (NEMS), and mid-infrared source (MIRS). CM1-UCHII refers to the mm counterpart of the cm-wavelength continuum source designated F G18.67+0.03-CM1 by Cyganowski et al. (2011b). Observed millimeter continuum properties are summarized in Table 1. The SMA image recovers 196% of the 1.1 mm BGPS flux density (3.8 Jy; Rosolowsky et al. 2010, corrected as per Aguirre et al. 2011). The westernmost source (MIRS) falls outside the area searched for 44 GHz CH3OH masers by Cyganowski et al. (2009), so we do not discuss it further in this Letter.
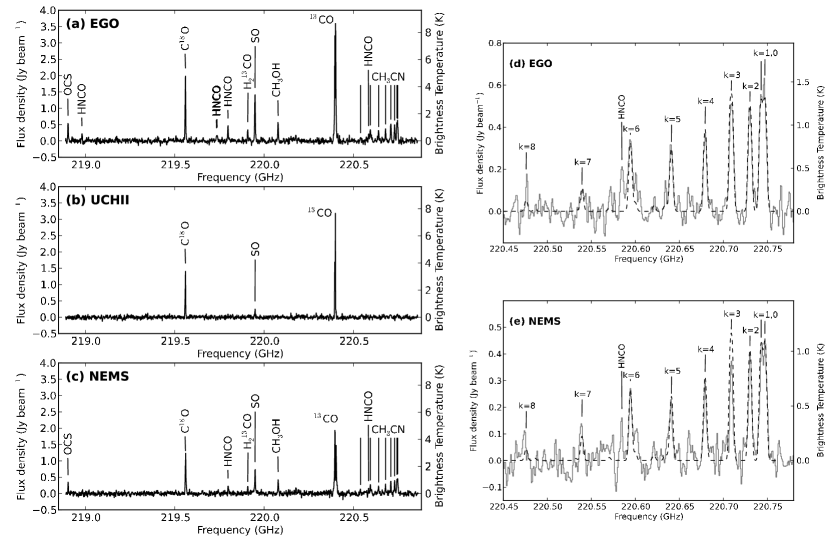
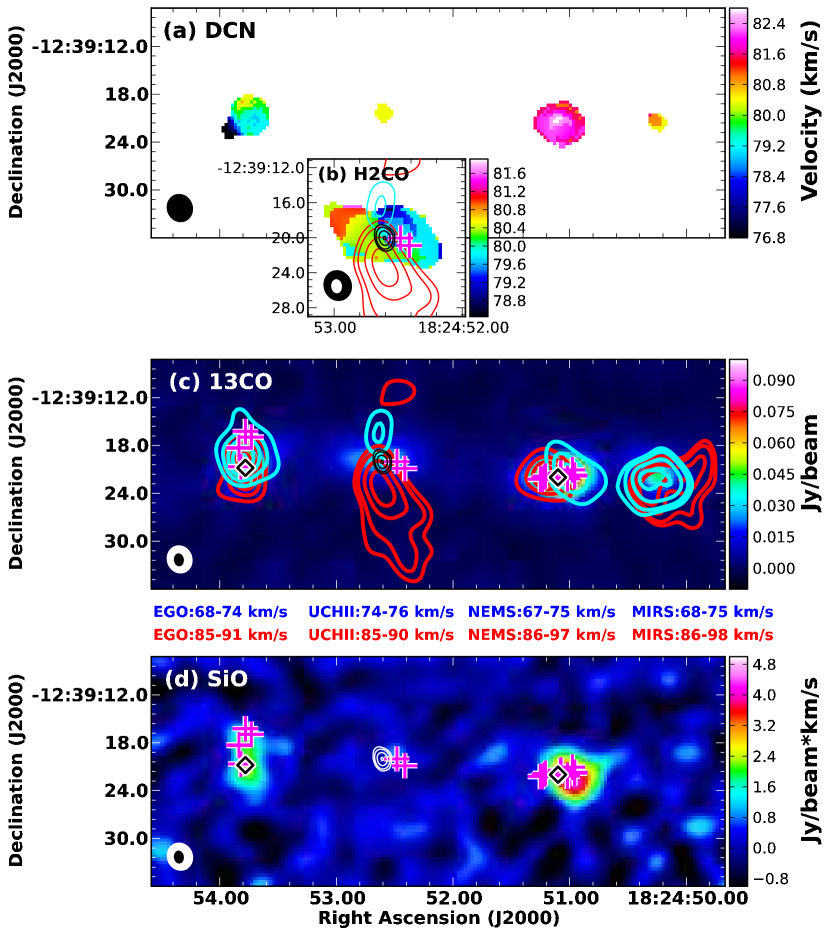
Only a few species (including CO isotopes, SO, DCN, and low-excitation lines of H2CO and CH3OH) are detected towards all three maser sources. The LSR velocities of the sources, determined from compact molecular line emission, are within 3 km s-1 of each other (Fig. 3a, Table 1). Figure 2a-c presents a comparison of the spectra at the EGO, CM1-UCHII, and NEMS 1.3 mm continuum peaks across 2 GHz of the SMA band. The EGO and NEMS both exhibit copious molecular line emission from classic hot core tracers, such as CH3CN, OCS, and high-excitation CH3OH. In contrast, CM1-UCHII is line-poor: none of these tracers are detected.
All three Class I CH3OH maser sources are associated with both redshifted and blueshifted 13CO(2-1) emission, with velocity extents of 23, 16, and 30 km s-1 for the EGO, CM1-UCHII, and NEMS, respectively (Fig. 3c). In all cases, there is a clear spatial offset between the red and blue lobes, which are centered on a compact source. These characteristics indicate that the high-velocity 13CO(2-1) emission traces bipolar molecular outflows. The 44 GHz masers associated with the EGO and NEMS are coincident with outflow lobes. The CM1-UCHII 44 GHz masers are located, in projection, near the edge of its redshifted lobe. In addition to the N-S outflow, there is evidence for an E-W gradient in low-velocity molecular gas near the UCHII region (vv1.5 km s-1; Fig. 3b). This E-W velocity gradient could indicate a second, slower outflow, and/or large-scale rotation or infall. Importantly, the outflows associated with the EGO and NEMS are detected in SiO(5-4) emission, while the outflow(s) associated with CM1-UCHII is not (Fig. 3d).
3.2. Temperatures and Dust Masses
We estimate gas temperatures for the EGO and NEMS by fitting the J=12-11 CH3CN ladder using the method described in Cyganowski et al. (2011a). In brief, the model accounts for optical depth effects and emission from the CHCN isotope: the temperature, source size(diameter), and CH3CN column density and linewidth are free parameters. Figure 2d-e show the best-fit models, overlaid on the observed spectra. The best-fit temperatures, source sizes, and CH3CN column densities are quite similar for the two sources: T=175K and 185K, log[N(cm-2)]=16.66 and 16.58, and dsource=045 (4900 AU) and 039 (4200 AU) for the EGO and NEMS, respectively.
Gas masses and (beam-averaged) column and number densities estimated from the 1.3 mm thermal dust emission, using the methodology of Cyganowski et al. (2011a), are presented in Table 1. The mass estimates for the EGO and NEMS assuming Tdust=T (30 and 70 M⊙, respectively) are likely lower limits; the CH3CN-emitting regions are unresolved at the scale of our SMA observations (33,000 AU), while the 1.3 mm continuum emission appears somewhat more extended. For comparison, the gas masses of the CH3CN-emitting regions, estimated from the best-fit source sizes and column densities, are 40 and 30 M⊙ for the EGO and NEMS, for CH3CN/H10-8. Since the CH3CN/H2 abundance in hot cores is uncertain, and values an order of magnitude higher/lower are plausible (see Cyganowski et al., 2011a), this is reasonable agreement.
Constraining the gas temperature of CM1-UCHII is more difficult because of the paucity of associated line emission: no CH3CN is detected, and only one CH3OH line. Most lines detected have E50 K; the highest-excitation transitions have E68 K (H2CO). In addition, while the ionized gas is unresolved (§3.3), the mm-wavelength continuum emission is extended E-W, with scale 0.5 pc. For the estimates in Table 1, we adopt a temperature of 50 K, and subtract the free-free contribution to the 1.3 mm flux density (extrapolated from the 1.2 cm integrated flux density assuming optically thin emission, S).
3.3. Ionized Gas Properties
We detect the H63 and H64 recombination lines towards G18.67+0.03-CM1 (Cyganowski et al., 2011b). The fitted RRL velocity (77.30.9 km s-1) is consistent with the molecular-gas velocity. From the line-to-continuum ratio of 0.48, the fitted FWHM linewidth of 27.0 km s-1, and the fitted source size of 063 (from the continuum image), we derive an electron temperature of 5100 K and density of 1.9104 cm-3 (following the method of e.g. Garay et al., 1986; Sewiło et al., 2011). If bulk motions (e.g. expansion) dominate the linewidth, this could explain the low derived Te; however, the RRL emission is too weak to investigate this possibility. The cm-wavelength spectral index is consistent with optically thin free-free emission, and the ionizing photon flux (11047 s-1, calculated as in Cyganowski et al., 2011b) corresponds to a single ionizing star of spectral type B0.5V (Smith et al., 2002).
4. Discussion
4.1. Evolutionary States of Class I Maser Driving Sources
All three maser sources in G18.67+0.03 are associated with massive (30 M⊙), dense (n105 cm-3) millimeter continuum cores, and with 13CO outflows. CO (and HCO+) may trace relic outflows from MYSOs (e.g. Klaassen et al., 2006; Klaassen & Wilson, 2007; Hunter et al., 2008). SiO emission, however, specifically indicates recent shocks and active outflows, since the gas-phase SiO abundance is enhanced by shocks and remains so for only 104 years (e.g. Pineau des Forets et al., 1997). The EGO and NEMS, which have both Class I and II CH3OH masers, thus share two other key characteristics: (1) their outflows are active, as evidenced by SiO(5-4) emission; and (2) the driving sources exhibit hot core line emission (e.g. CH3CN, CH3OH, OCS). In summary, the Class I masers in these sources appear as clear cases of excitation by outflows.
In contrast, the Class I-only maser source lacks indicators of youth: neither SiO nor hot core line emission is detected in our observations. The 44 GHz masers lie near a cm continuum source, detected in RRLs; its derived ionized gas properties are consistent with a UCHII region. Two mechanisms have been posited that could explain Class I maser emission associated with such a comparatively evolved source. Voronkov et al. (2006) suggested that Class I masers might be long-lived, persisting after the exciting shock had dissipated. More recently, Voronkov et al. (2010) noted the proximity of cm continuum emission to three of the four known examples of 9.9 GHz Class I CH3OH masers. They suggested that shocks driven into the surrounding cloud by expanding HII regions were responsible for these masers, and that this mechanism should also apply to other Class I transitions. These two scenarios have somewhat different implications for maser evolutionary sequences: the first implies that Class I masers outlast the Class II phase; the second, that Class I masers may appear more than once, excited by young or evolved MYSOs (see also Voronkov et al., 2012).
In G18.67+0.03, the lack of associated SiO emission suggests that the CM1-UCHII 13CO outflow is a relic. It also has a smaller velocity extent than the EGO and NEMS 13CO outflows, despite being more spatially extended: additional evidence that the CM1-UCHII outflow is older (t 19000, 26000, and 66000 for the NEMS, EGO, and CM1-UCHII respectively). In this picture, the CM1-UCHII 13CO outflow would have been driven by the now-ionizing source, prior to the creation of the UCHII region (analogous to the E-W outflow in G5.89-0.39; Hunter et al., 2008). The Class I masers are near the edge of the redshifted lobe, consistent with an association with the relic(?) flow, and so supporting the scenario in which long-lasting Class I maser activity extends beyond the Class II maser lifetime. This interpretation, however, is not conclusive; the Class I masers are also near the UCHII region, and we cannot rule out their being excited by HII region-driven shocks. In either case, these Class I masers are clearly associated with a more evolved MYSO.
4.2. Class I Maser Excitation as a Key?
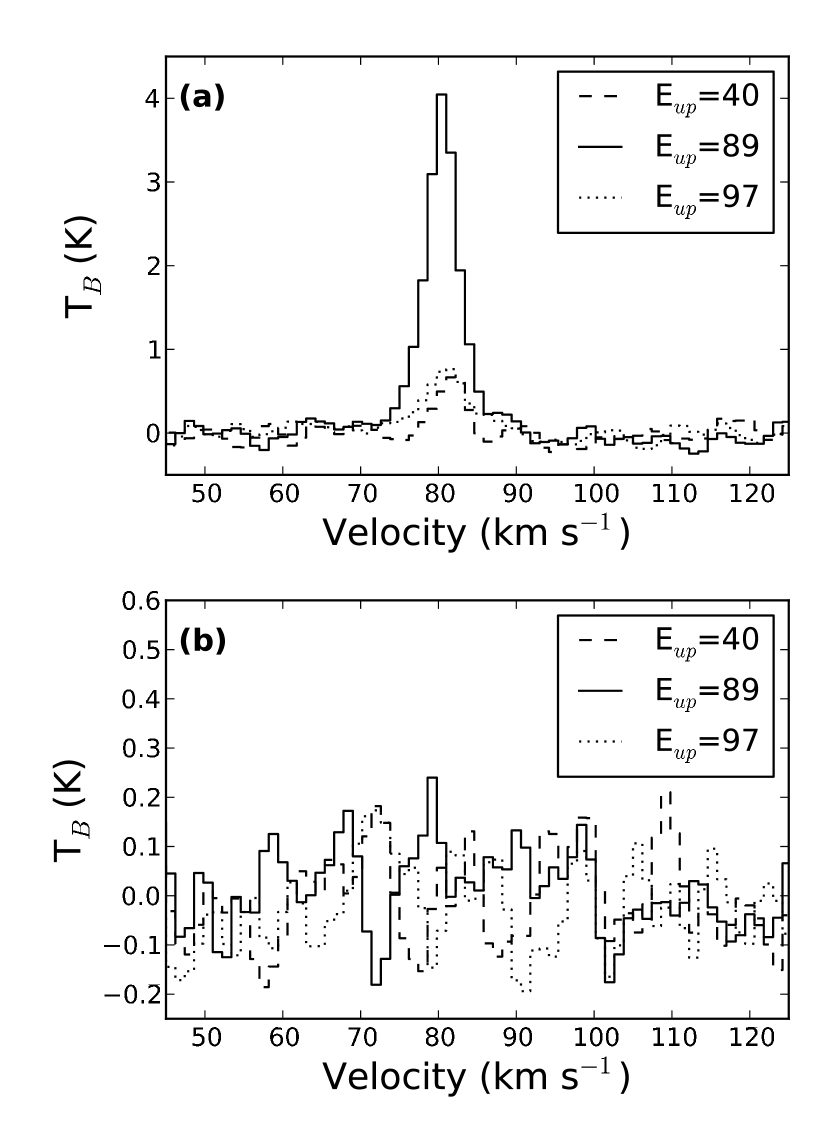
Probable maser emission in the Class I 229.759 GHz CH3OH(8-1,8-70,7)E transition is a conspicuous feature of recent SMA observations of MYSO outflows (e.g. Cyganowski et al., 2011a, and references therein). In these outflows, 229 GHz emission is generally colocated (spatially and spectrally) with lower frequency Class I masers, and the brightest features in all transitions coincide (see also Fish et al., 2011). In G18.67+0.03, we detect strong 229.759 GHz emission coincident with the brightest NEMS 44 GHz masers (Fig. 4)–those associated with the blueshifted, SiO-rich western outflow lobe. Like many previous 229 GHz studies, our beam is too large to establish masing based on brightness temperature. Slysh et al. (2002) proposed the 229.759/230.027 ratio as a diagnostic, with values 3 indicating nonthermal 229 GHz emission: the ratio for the NEMS position shown in Figure 4 is 5.5. This NEMS 44 GHz maser is the second-brightest detected by Cyganowski et al. (2009) in G18.67+0.03; the brightest is the western of the two associated with CM1-UCHII (Fig. 1d; I2 Jy beam-1). No 229.759 GHz emission is detected at this position (Fig. 4). The 44 GHz masers associated with the EGO are weak ( 0.5 Jy beam-1), and the mm line ratios are ambiguous.
These results suggest that excitation conditions may differ in older and younger Class I maser sources in a manner that produces observable differences in the relative strengths of various Class I maser transitions. Detailed comparisons of the 44 and 229 GHz maser spots are, however, limited by the relatively coarse spatial and spectral resolution of the current SMA data. In general, additional modeling and observations are needed to understand what information about physical conditions and evolutionary state can be extracted from the presence/absence of different Class I CH3OH masers, particularly for mm-wavelength transitions (see also discussion in Fish et al., 2011). For G18.67+0.03, higher angular resolution observations are needed to confirm the maser nature of the 229 GHz emission, and to spatially resolve the potential mm masers from the hot cores in the EGO and NEMS; high resolution 36 GHz observations may also be helpful (e.g. Voronkov et al., 2012).
5. Summary
Our high resolution SMA and VLA observations provide the first unambiguous evidence of Class I CH3OH masers being excited by both young and more evolved MYSOs within the same protocluster. The two hot cores, also associated with Class II CH3OH masers, drive active outflows traced by SiO(5-4) emission and Class I masers. In contrast, the UCHII region is associated only with Class I CH3OH masers and with an older (possibly relic) 13CO outflow; the UCHII shows neither SiO nor hot core line emission. These results further demonstrate the limitations of current evolutionary sequences for maser emission (see also Voronkov et al., 2010; Chen et al., 2011). In particular, our data show that MYSOs associated only with Class I CH3OH masers (no Class II) are not necessarily young, in contrast to published sequences. This work highlights the importance of high angular resolution multiwavelength observations for constraining MYSO evolutionary states, and disentangling an observation-based MYSO evolutionary sequence.
References
- Aguirre et al. (2011) Aguirre, J. E., Ginsburg, A. G., Dunham, M. K., et al. 2011, ApJS, 192, 4
- Beuther et al. (2009) Beuther, H., Zhang, Q., Bergin, E. A., & Sridharan, T. K. 2009, AJ, 137, 406
- Breen et al. (2010a) Breen, S. L., Ellingsen, S. P., Caswell, J. L., & Lewis, B. E. 2010, MNRAS, 401, 2219
- Brogan et al. (2011) Brogan, C. L., Hunter, T. R., Cyganowski, C. J., et al. 2011, ApJ, 739, L16
- Chen et al. (2011) Chen, X., Ellingsen, S. P., Shen, Z.-Q., Titmarsh, A., & Gan, C.-G. 2011, ApJS, 196, 9
- Cragg et al. (2002) Cragg, D. M., Sobolev, A. M., & Godfrey, P. D. 2002, MNRAS, 331, 521
- Cyganowski et al. (2007) Cyganowski, C. J., Brogan, C. L., & Hunter, T. R. 2007, AJ, 134, 346
- Cyganowski et al. (2008) Cyganowski, C. J., Whitney, B.A., Holden, E., Braden, E., Brogan, C.L., Churchwell, E., Indebetouw, R., Watson, D.F., Babler, B.L., Benjamin, R., Gomez, M., Meade, M.R., Povich, M.S. Robitaille, T.P., & Watson, C. 2008, AJ, 136, 2391
- Cyganowski et al. (2009) Cyganowski, C. J., Brogan, C. L., Hunter, T. R., & Churchwell, E. 2009, ApJ, 702, 1615
- Cyganowski et al. (2011a) Cyganowski, C. J., Brogan, C. L., Hunter, T. R., Churchwell, E., & Zhang, Q. 2011, ApJ, 729, 124
- Cyganowski et al. (2011b) Cyganowski, C. J., Brogan, C. L., Hunter, T. R., & Churchwell, E. 2011, ApJ, 743, 56
- Cyganowski et al. (2012) Cyganowski, C. J., et al., ApJ, submitted.
- Elitzur et al. (1989) Elitzur, M., Hollenbach, D. J., & McKee, C. F. 1989, ApJ, 346, 983
- Ellingsen et al. (2007) Ellingsen, S. P., Voronkov, M. A., Cragg, D. M., Sobolev, A. M., Breen, S. L., & Godfrey, P. D. 2007, IAU Symposium, 242, 213
- Ellingsen (2006) Ellingsen, S. P. 2006, ApJ, 638, 241
- Fish et al. (2011) Fish, V. L., Muehlbrad, T. C., Pratap, P., et al. 2011, ApJ, 729, 14
- Garay et al. (1986) Garay, G., Rodriguez, L. F., & van Gorkom, J. H. 1986, ApJ, 309, 553
- Green & McClure-Griffiths (2011) Green, J. A., & McClure-Griffiths, N. M. 2011, MNRAS, 417, 2500
- Hunter et al. (2008) Hunter, T. R., Brogan, C. L., Indebetouw, R., & Cyganowski, C. J. 2008, ApJ, 680, 1271
- Hunter et al. (2006) Hunter, T. R., Brogan, C. L., Megeath, S. T., Menten, K. M., Beuther, H., & Thorwirth, S. 2006, ApJ, 649, 888
- Klaassen & Wilson (2007) Klaassen, P. D., & Wilson, C. D. 2007, ApJ, 663, 1092
- Klaassen et al. (2006) Klaassen, P. D., Plume, R., Ouyed, R., von Benda-Beckmann, A. M., & Di Francesco, J. 2006, ApJ, 648, 1079
- Kurtz et al. (2004) Kurtz, S., Hofner, P., & Álvarez, C. V. 2004, ApJS, 155, 149
- Pineau des Forets et al. (1997) Pineau des Forets, G., Flower, D. R., & Chieze, J.-P. 1997, Herbig-Haro Flows and the Birth of Stars, 182, 199
- Plambeck & Menten (1990) Plambeck, R. L., & Menten, K. M. 1990, ApJ, 364, 555
- Purcell et al. (2008) Purcell, C. R., Hoare, M. G., & Diamond, P. 2008, Massive Star Formation: Observations Confront Theory, 387, 389
- Reid et al. (2009) Reid, M. J., et al. 2009, ApJ, 700, 137
- Rosolowsky et al. (2010) Rosolowsky, E., et al. 2010, ApJS, 188, 123
- Schuller et al. (2009) Schuller, F., et al. 2009, A&A, 504, 415
- Sewiło et al. (2011) Sewiło, M., Churchwell, E., Kurtz, S., Goss, W. M., & Hofner, P. 2011, ApJS, 194, 44
- Slysh et al. (2002) Slysh, V. I., Kalenskiĭ, S. V., & Val’tts, I. E. 2002, Astronomy Reports, 46, 49
- Smith et al. (2002) Smith, L. J., Norris, R. P. F., & Crowther, P. A. 2002, MNRAS, 337, 1309
- Voronkov et al. (2006) Voronkov, M. A., Brooks, K. J., Sobolev, A. M., et al. 2006, MNRAS, 373, 411
- Voronkov et al. (2010) Voronkov, M. A., Caswell, J. L., Ellingsen, S. P., & Sobolev, A. M. 2010, MNRAS, 405, 2471
- Voronkov et al. (2012) Voronkov, M. A., Caswell, J. L., Ellingsen, S. P., et al. 2012, arXiv:1203.5492
- Wang et al. (2012) Wang, Y., Beuther, H., Zhang, Q., et al. 2012, ApJ, 754, 87
- Zhang et al. (2009) Zhang, Q., Wang, Y., Pillai, T., & Rathborne, J. 2009, ApJ, 696, 268