Institute of Technical Physics and Materials Science, Research Centre for Natural Sciences, Hungarian Academy of Sciences, P.O. Box 49, H-1525 Budapest, Hungary
Faculty of Natural Sciences and Mathematics, University of Maribor, Koroška cesta 160, SI-2000 Maribor, Slovenia
Dynamics of evolution Population dynamics and ecological pattern formation Social and economic systems
Averting group failures in collective-risk social dilemmas
Abstract
Free-riding on a joint venture bears the risk of losing personal endowment as the group may fail to reach the collective target due to insufficient contributions. A collective-risk social dilemma emerges, which we here study in the realm of the spatial public goods game with group-performance-dependent risk levels. Instead of using an overall fixed value, we update the risk level in each group based on the difference between the actual contributions and the declared target. A single parameter interpolates between a step-like risk function and virtual irrelevance of the group’s performance in averting the failure, thus bridging the two extremes constituting maximal and minimal feedback. We show that stronger feedback between group performance and risk level is in general more favorable for the successful evolution of public cooperation, yet only if the collective target to be reached is moderate. Paradoxically, if the goals are overambitious, intermediate feedback strengths yield optimal conditions for cooperation. This can be explained by the propagation of players that employ identical strategies but experience different individual success while trying to cope with the collective-risk social dilemma.
pacs:
87.23.Kgpacs:
87.23.Ccpacs:
89.65.-s1 Introduction
Many of today’s most pressing global challenges can be described as “problems of the commons” [1]. Be it the preservation of natural resources for future generations, the provisioning of health and social care, or the supply of energy to meet our constantly increasing demand. All these challenges require that we abandon some luxury on the personal level for the greater good. The call goes out to all of us to intensify the level of public cooperation across human societies [2]. However, the temptations to free-ride on the efforts of others are strong, especially since by nature we are hardwired to maximize our own fitness regardless of the consequences this has for the public good. Accordingly, the “tragedy of the commons” [1] looms upon us, although we, the humans, are known for our highly developed other-regarding abilities.
The public goods game is traditionally employed to study problems that arise due to the dissonance between individual and societal interests. During the game, all players that are members of a given group have to decide simultaneously whether they wish to contribute to the common pool or not. Regardless of their decision, each player receives an equal share of the public good after the initial contributions are multiplied by a synergy factor that is larger than one. Evidently, individuals are best off by not contributing anything, while the group is most successful if everybody contributes. The competition between defection and cooperation has received ample attention in the recent past, and several mechanisms have been identified that promote prosocial outcomes. Examples include voluntary participation [3, 5, 4], inhomogeneous player activities [6, 7], social diversity [8, 9, 10], appropriate partner selection [11, 12], aspiration-driven mobility [13, 14, 15, 16, 17], the introduction of punishment [18, 19, 20, 21, 22, 23, 24] and reward [25, 26], coordinated investments [27], the Matthew [28] and joker effect [29], complex interaction networks [30, 31, 32, 33, 34, 35, 36], conditional strategies [37], and nonlinear benefit functions [38, 39, 40], to name but a few examples.
The public goods game in its classical form, however, fails to capture some important features of social dilemmas that arise frequently in realistic situations. A good example is the climate change dilemma, where regions or nations may opt not to reduce their carbon emissions in order to harvest short-term economic benefits. Yet this is not the end of the story since failure to meet the emission targets may have dire consequences in the future. The so-called collective-risk social dilemma is more appropriate for such a scenario [41]. There all players are considered to have an initial endowment, and cooperation means contributing a fraction of it to the common pool. Defectors do not contribute. The risk level is determined by a collective target that should be reached with individual investments. If a group fails to reach this target, all members of the group loose their remaining endowments with a certain probability. Otherwise, everyone retains its current endowment. Experimental and theoretical studies have shown that high risks of collective failures raise the chances for coordinated actions [41, 42, 43, 44], and that this outcome is robust against variations of the interaction network and the size of the population [45].
In the pioneering works, the probability that endowments will be lost or kept was most frequently considered to be a step-like function of the gathered collective investments [41, 42, 45, 43]. Hence, if the investments did not reach a certain fixed threshold the probability to loose endowments was independent of the actual contributions. Such a consideration, however, is not necessarily accurate. It is intuitively easy to imagine cases where the probability of a collective failure is much higher if the group members are far from reaching the collective target, and vice versa if the target is nearly yet not quite reached. Staying with the climate change dilemma, it is reasonable to assume that the escalation of problems is much more likely if the carbon emissions are far in excess of the allowable quota than if they are just above it [44].
Given these facts, we here propose that the risk level ought to decreases continuously with increasing group investments, and we investigate what are the consequences of the details of such an upgrade on the evolution of cooperation in the public goods game that is staged on a square lattice. In particular, we introduce a function where a single parameter defines the feedback strength between the actual performance of each group in relation to the declared collective target and the risk level constituting the probability that investments will be lost. While the larger the difference between the target and the actual contributions the higher the probability that all group members will loose their investments, this dependence can be made more or less severe depending on the feedback strength. By varying the latter and the value of the collective target, we find that high targets require an intermediate feedback strength for public cooperation to thrive, while for moderate targets the higher the feedback strength the better.
2 Model
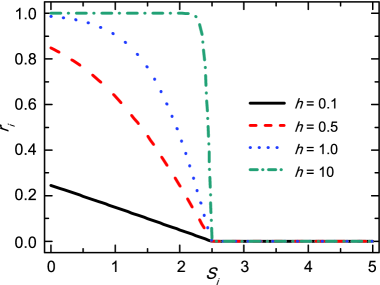
As the interaction network, we consider a square lattice of size with periodic boundary conditions. Each player on site has an initial endowment and is designated as a cooperator () or defector () with equal probability. Cooperators contribute an amount to the common pool while defector contribute nothing. Moreover, there is a collective target to be reached with the contributions in each group. If in group the target is reached or surpassed, each member can keep its remaining endowment. If not, all members loose their endowments with a probability , which is determined by a Fermi-type function
| (1) |
where is the key parameter controlling the feedback strength of failing to reach the target (see Fig. 1), and represents the total amount of collected contributions in group . Accordingly, player obtains its payoff from group . Since players are connected to their four nearest neighbors, each group has size , and each player is member in five overlapping groups, thus reaching a total payoff .
After playing the game, each player is allowed to learn a potentially better strategy from one of its randomly chosen neighbors in agreement with the probability
| (2) |
where denotes the amplitude of noise [46]. Without loss of generality we use , implying that better performing player are readily adopted, but it is not impossible to adopt the strategy of a player performing worse. The evolutionary process is implemented with synchronous updating, where all players first collect their payoffs and then alter their strategies simultaneously. Notably, before each round all the players obtain the endowment . To test the robustness of our findings, we have verified that similar results are obtained by using asynchronous updating.
Presented results were obtained on sized lattices, but remain intact also if a larger system size is used. The cooperation level was determined as a key quantity according to , where denotes the strategy of player in the stationary state where the average cooperation level becomes time-independent.
3 Results
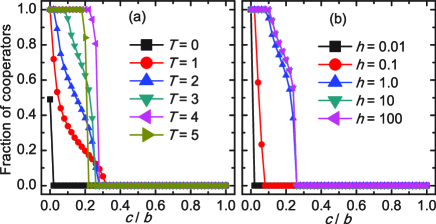
First, we show in Fig. 2(a) the cooperation level as a function of the donation ratio for five different values of at a fixed intermediate feedback strength . It can be observed that the cooperation level decreases with increasing for all . For our model behaves similarly to the traditional public goods game in an unstructured population [39]. In this situation, the cooperation level is zero for any , while for it converges to . When is sufficiently high, full cooperation can be observed for sufficiently small donation ratios. Interestingly however, for the performance is worse than for ; a detail that we will elaborate on in what follows. Figure 2(b) features qualitatively similar results, only that the focus is on the impact of at a fixed target . It can be observed that larger feedback strengths can sustain cooperation at larger , although the positive effect begins saturating for .
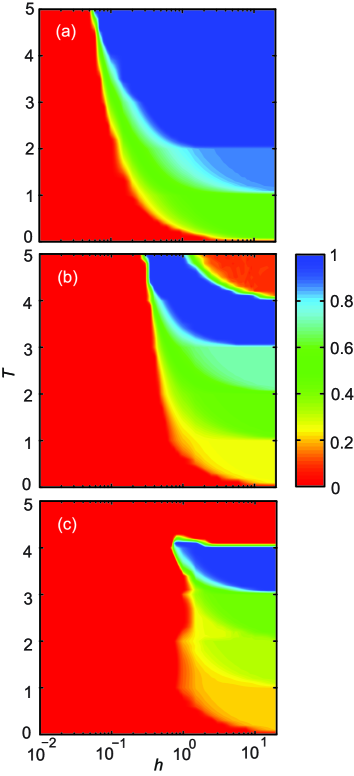
In order to explore these effects more precisely, we present the cooperation level in dependence on and together for three representative values of in Fig. 3. We find that small values of (weak feedback) result in full defection for each considered value and regardless of . For intermediate , the cooperation level increases from zero to one upon increasing . For large (strong feedback), however, the cooperation level first increases until a certain maximum is reached, but then starts falling as increases further. If we compare the cooperation level at a fixed target value, we find that, in general, stronger feedbacks (higher ) yield better results. Yet this is certainly not valid for high target values, where an intermediate value of ensures much better conditions for the evolution of public cooperation.
This unexpected outcome is demonstrated separately in Fig. 4, where we plot the cooperation level as a function of at two different values of . As the figure shows, stronger feedback generally results in a higher frequency of cooperators, but this relation reverses at high values of . The difference between final states can be so large that applying intermediate yields a full state, while for large the system arrives to a defector dominated state.
To get an understanding of this rather paradoxical behavior, we compare the time evolution of strategies at two representative values of using the same donation ratio for three different values of . When plotting the spatial distribution of strategies, it is useful to use different colors not just for different strategies but also for the different levels of individual success in terms of dealing with the collective-risk social dilemma. More precisely, we distinguish players based on their ability to collect payoffs from the majority of their groups or not. Accordingly, a “successful defector” (, denoted yellow) is a defector that can gather payoffs in at least three of the five groups where it is involved. In the opposite case, the player is marked as a “failed defector” (, denoted red). Identically, we distinguish between “successful cooperators” (, denoted blue) and “failed cooperators” (, denoted green).
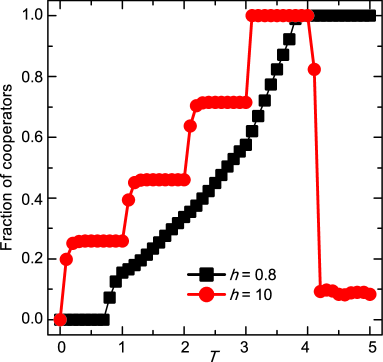
Figure 5 shows the evolution from left to right at for (top row), (middle row), and (bottom row). When the feedback is weak (top row) almost every player can collect payoffs from the majority of the five groups where it is member [ (yellow) and (blue) players dominate in Fig. 5(a)]. Since the collective risk fails to avert from antisocial behavior defectors can keep their benefit with a high probability and cooperators therefore have no chance to survive. As a result, the system terminates into a full state where there is a dynamical balance between and players. Their spatial distribution is uncorrelated, as shown in Fig. 5(c), and their density is directly related with the risk function, defined by Eq. 1. Namely, the density of players is proportional to
| (3) |
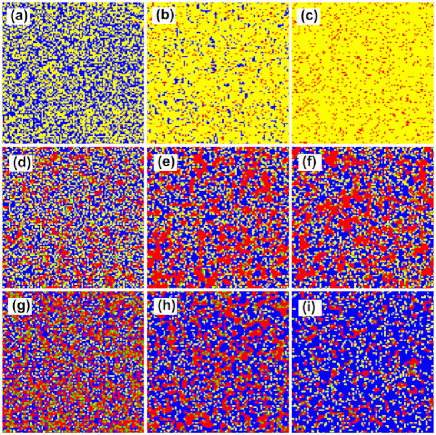
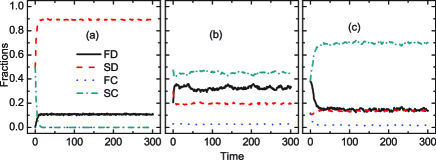
At larger , shown in the middle row of Fig. 5, the impact of a higher collective risk becomes visible. Accordingly, the number of players decreases significantly and they can only survive in the vicinity of cooperators. Because of notable collective risks they cannot aggregate but need a spare distribution to survive. The other type of defectors (, who failed to gather payoffs in more than two groups) may form clusters, as can be observed in Figs. 5(e) and (f), because their state cannot change rapidly. More precisely, while the transition from state may occur anywhere, even in the bulk of a defector island the transition from or from state can only happen via an imitation process at the interface of domains. This dynamical difference of transitions explains why players (red) are aggregated while players (yellow) are distributed homogeneously but close to players (blue). It is also worth mentioning that players (green) occur rarely, typically in the sea of failed defectors where the low density of cooperators cannot warrant them to avoid the consequences of notable risk.
If using even larger values, as in the bottom row of Fig. 5, the above described mechanisms become even more pronounced. Successful defectors are still able to utilize the vicinity of cooperators to avoid the risk-dilemma, and hence their density remains almost the same if compared to the smaller cases. This can be observed best from the bottom-most plots, which depict the time evolution of the four sub-strategies [note that the stationary fraction of does not change significantly between (b) and (c) panels]. The relevant change that lifts the fraction of , and hence the cooperation level, is the shrinkage of (red) islands. It is because the sharper risk probability makes the invasion of cooperators from the interface of islands more vigorous. According to this argument, it is generally clear why increasing (stronger feedback) enhances the overall cooperation level.
The above described mechanism is valid for almost all target values. An important exception, however, are very high values of , where significantly different conclusion must be drawn. The unexpected behavior is demonstrated in Fig. 6 where the same ratio and values were used as in Fig. 5, but at . At small (top row of Fig. 6), the players are initially unsuccessful almost independently of their strategies. This is because every group fails to fulfill the ambitious collective target, which is simply too high. The success of one or the other strategy is just the result of stochastic events driven by the functions. In the later stages of the game defectors eventually invade cooperators because the latter have to bare the additional costs. Notably, cooperators cannot utilize the advantage of clustering because of the smoothed function and the high value of . The final full state, plotted in Fig. 6(c), is similar to the one obtained for the smaller value in Fig. 5(c). The only difference is the higher density of players, which is due to the higher target and hence the higher risk probability, which can again be estimated from Eq. 3.
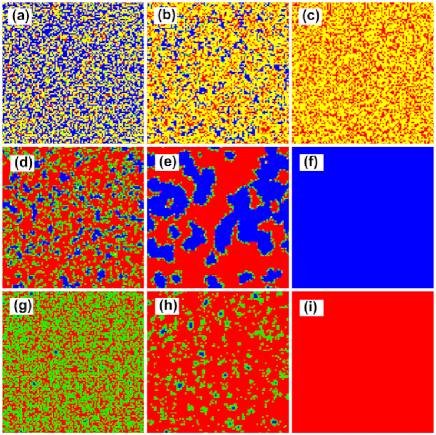
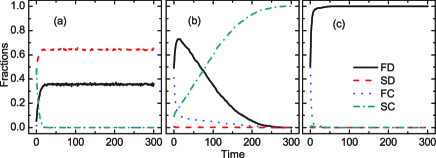
At the intermediate value, as demonstrated in the middle row of Fig. 6, the significant change is that players disappear very soon, which is because the sharper outlay of the function makes it unlikely for such defectors to avoid the consequences of the now higher collective risk. players can spread temporarily because they avoid paying the cost, but later they fail too, as illustrated by the black continuous curve in the lowermost middle panel of Fig. 6. Note that this is a typical pattern that can be observed in spatial evolutionary games. Because of the relatively unambiguous function, the support, or lack thereof, of a group is clear. Hence, the islands of cooperators become victorious. It is because they can always keep their payoffs while defectors cannot. There are some failed cooperators remaining, but they are predominantly restricted to the frontiers of domains. They are unlucky indeed, since of their vicinity to defectors they have to share the sad consequences of membership in a poorly (or at least insufficiently) productive group. Paradoxically, they are the pioneers who begin invading defective domains because they still have larger payoffs than defectors. When a neighboring defector becomes cooperator the mentioned player may also transform to the state with a higher payoff. As a result, blue domains invade red islands and dominate the whole population. This invasion process and the special role of players is very similar to that of conditional cooperators in a structured population, as shown very recently in [37].
Even stronger feedbacks revert the described positive effect in the opposite direction, as demonstrated in the bottom row of snapshots in Fig. 6. Here even an aggregation of cooperators is mostly unable to fulfill the strict condition of reaching the high collective target. Note that 12 cooperators should be accumulated around the focal player for the latter to avoid the collective risk. Even if this condition is met, there will be unsuccessful cooperators (FC) at the edges of such domains that will be vulnerable due to their inability to collect a similarly high payoff and avoid the looming collective risk. Importantly, if using such a sharp function it is irrelevant how close the group investment is to the collective target: if the threshold is not met, the “punishment” will be the same as in a fully defective group. Consequently, unlike in the intermediate case, unsuccessful cooperators cannot invade defectors, which ultimately results in complete defector dominance, as depicted in Fig. 6(i).
4 Summary
We have studied the collective-risk social dilemma in a structured population, focusing on the emergence of public cooperation under the influence of differently shaped risk functions. Most importantly, we have considered the risk level to decreases continuously with increasing group investments, with a single parameter enabling us to interpolate between different feedback strengths of the difference with regards to the declared collective target. In agreement with previous observations, we have shown that sharper risk functions, corresponding to a stronger feedback, in general promote the evolution of public cooperation and may thus help to prevent the tragedy of the commons. Yet we have found this to hold only if the collective targets are sufficiently moderate. If the goals in terms of the production of public goods are too high, intermediate feedback strengths can yield much higher levels of public cooperation than strong feedbacks. This goes against preliminary expectations, signaling that the expectation for most of the group members to contribute maximally to the common pool is a difficult proposition that requires a special approach. It is certainly not impossible to achieve, but requires a certain degree of lenience towards all that are involved. An overall high risk of collective failure is then certainly not advisable, but rather one should consider diverse and fine-grained risk intervals that are able to take into account how far away the production of any given group is from the declared target. We have revealed key mechanisms that are responsible for these observations by introducing sub-strategies that further divide the traditional cooperators and defectors based on their individual success in groups they are involved with, thus complementing previous studies [42, 45] and hopefully promoting our understanding of the evolution of public cooperation in the collective-risk social dilemma.
Acknowledgements.
Financial support from the Hungarian National Research Fund (grant K-101490) and the Slovenian Research Agency (grant J1-4055) is gratefully acknowledged.References
- [1] \NameHardin G. \REVIEWScience16219681243.
- [2] \NameOstrom E \BookGovering the commons: The Evolution of Institutions for Collective Action \PublCambridge University Press, Cambridge, UK \Year1990.
- [3] \NameHauert C., De Monte S., Hofbauer J., Sigmund K. \REVIEWJ. Theor. Biol.2182002187.
- [4] \NameSzabó G. and Hauert C. \REVIEWPhys. Rev. Lett.892002118101.
- [5] \NameHauert C., De Monte S., Hofbauer J., Sigmund K. \REVIEWScience29620021129.
- [6] \NameSzolnoki A. Szabó G. \REVIEWEPL77200730004
- [7] \NameGuan J.-Y., Wu Z.-X., Wang Y.-H. \REVIEWPhys. Rev. E762007056101
- [8] \NamePerc M. Szolnoki A. \REVIEWPhys. Rev. E772008011904.
- [9] \NameSantos F.C., Santos M.D., Pacheco J.M. \REVIEWNature4542008213.
- [10] \NameSantos F.C., Pinheiro F.L., Lenaerts T., Pacheco J.M. \REVIEWJ. Theor. Biol.299201288.
- [11] \NameWu T., Fu F., Wang L. \REVIEWEPL90200920001.
- [12] \NameZhang H.-F., Liu R.-R., Wang Z., Yang H.-X., Wang B.-H. \REVIEWEPL94201118006.
- [13] \NameHelbing D. Yu W. \REVIEWProc. Natl. Acad. Sci. USA10620093680.
- [14] \NameLin Y.-T., Yang H.-X., Wu Z.-X., B-H. Wang \REVIEWPhysica A390201177.
- [15] \NameZhang J., Wang W.-Y., Du W.-B., Cao X.-B. \REVIEWPhysica A39020112251.
- [16] \NameCardillo A., Meloni S., Gómez-Gardeñes J., Moreno Y. \REVIEWarXiv20121203.1768v1.
- [17] \NameYang H.-X., Rong Z., Lu P.-M., Zeng Y.-Z. \REVIEWPhysica A39120124043.
- [18] \NameHelbing D., Szolnoki A., Perc M., Szabó G. \REVIEWPLoS Comput. Biol.62010e1000758.
- [19] \NameSigmund K., De Silva H., Traulsen A., Hauert C. \REVIEWNature4662010861.
- [20] \NameHelbing D., Szolnoki A., Perc M., Szabó G. \REVIEWNew J. Phys.122010083005.
- [21] \NameRand D.G., Ohtsuki H., Nowak M.A. \REVIEWJ. Theor. Biol.256200945.
- [22] \NameSzolnoki A., Szabó G., Czakó L. \REVIEWPhys. Rev. E842011046106.
- [23] \NameIsakov A. Rand D.G \REVIEWDyn. Games Appl.2201297.
- [24] \NameSasaki T., Brännström Å., Dieckmann U., Sigmund K. \REVIEWProc. Natl. Acad. Sci. USA10920121165.
- [25] \NameSzolnoki A. Perc M. \REVIEWEPL92201038003.
- [26] \NameHauert C. \REVIEWJ. Theor. Biol.267201022.
- [27] \NameVukov J., Santos F.C., Pacheco J.M. \REVIEWJ. Theor. Biol.287201137.
- [28] \NamePerc M. \REVIEWPhys. Rev. E842011037102.
- [29] \NameRequejo R.J., Camacho J., Cuesta J.A., Arenas A. \REVIEWPhys. Rev. E862012026105
- [30] \NamePoncela J., Gómez-Gardeñes J., Floría L.M., Moreno Y. \REVIEWNew J. Phys.92007184.
- [31] \NameWang Z., Szolnoki A., Perc M. \REVIEWEPL97201248001.
- [32] \NamePoncela J., Gómez-Gardeñes J., Traulsen A., Moreno Y. \REVIEWNew J. Phys.112009083031.
- [33] \NameTanimoto J., Brede M., Yamauchi A. \REVIEWPhys. Rev. E852012032101.
- [34] \NameVukov J., Santos F.C., Pacheco J.M. \REVIEWPLoS ONE62011e17939.
- [35] \NamePoncela J., Gómez-Gardeñes J., Moreno Y. \REVIEWPhys. Rev. E832011057101.
- [36] \NameDu F. Fu F. \REVIEWDyn. Games Appl.12011354.
- [37] \NameSzolnoki A. Perc M. \REVIEWPhys. Rev. E852012026104.
- [38] \NameBoza G. Számadó S. \REVIEWBMC Evol. Biol.102010336.
- [39] \NameArchetti M. Scheuring I. \REVIEWEvolution6520111140.
- [40] \NameDeng K. Chu T. \REVIEWPLoS ONE62011e25496.
- [41] \NameMilinski M., Sommerfel R. D., Krambeck H.-J., Reed F. A., Marotzke J. \REVIEWProc. Natl. Acad. Sci. USA10520082291.
- [42] \NameWang J., Fu F., Wu T., Wang L. \REVIEWPhys. Rev. E802009016101.
- [43] \NameGreenwood G. \REVIEWEPL95201140006.
- [44] \NameRaihani N. Aitken D. \REVIEWClim. Change108201147.
- [45] \NameSantos F.C. Pacheco J.M. \REVIEWProc. Natl. Acad. Sci. USA108201110421.
- [46] \NameSzabó G. Fáth G. \REVIEWPhys. Rep.446200797.