Integrative modeling of eQTLs and cis-regulatory elements suggest mechanisms underlying cell type specificity of eQTLs
Christopher D Brown1,2∗, Lara M Mangravite3, Barbara E Engelhardt1,4∗
1 Department of Human Genetics, University of Chicago, Chicago, IL, USA
2 Institute for Genomic and Systems Biology, University of Chicago, Chicago, IL, USA
3 Sage Bionetworks, Seattle, WA, USA
4 Currently at: Biostatistics & Bioinformatics Department and Institute for Genome Sciences & Policy, Duke University, Durham, NC, USA
E-mail: caseybrown@uchicago.edu, barbara.engelhardt@duke.edu
Abstract
Genetic variants in cis-regulatory elements or trans-acting regulators commonly influence the quantity and spatiotemporal distribution of gene transcription. Recent interest in expression quantitative trait locus (eQTL) mapping has paralleled the adoption of genome-wide association studies (GWAS) for the analysis of complex traits and disease in humans. Under the hypothesis that many GWAS associations tag non-coding SNPs with small effects, and that these SNPs exert phenotypic control by modifying gene expression, it has become common to interpret GWAS associations using eQTL data. To fully exploit the mechanistic interpretability of eQTL-GWAS comparisons, an improved understanding of the genetic architecture and cell type specificity of eQTLs is required. We address this need by performing an eQTL analysis in four parts: first we identified eQTLs from eleven studies on seven cell types; next we quantified cell type specific eQTLs across the studies; then we integrated eQTL data with cis-regulatory element (CRE) data sets from the ENCODE project; finally we built a classifier to predict cell type specific eQTLs. Consistent with prior studies, we demonstrate that allelic heterogeneity is pervasive at cis-eQTLs and that cis-eQTLs are often cell type specific. Within and between cell type eQTL replication is associated with eQTL SNP overlap with hundreds of cell type specific CRE element classes, including enhancer, promoter, and repressive chromatin marks, regions of open chromatin, and many classes of DNA binding proteins. These associations provide insight into the molecular mechanisms generating the cell type specificity of eQTLs and the mode of regulation of corresponding eQTLs. Using a random forest classifier including CRE data sets as features, we successfully predict the cell type specificity of eQTL SNPs in the absence of gene expression data from the cell type of interest. We anticipate that such integrative, predictive modeling will improve our ability to understand the mechanistic basis of human complex phenotypic variation.
Introduction
The precise spatial and temporal control of gene transcription is critical for biological processes, as evidenced by the causal role of gene expression perturbation in many human diseases [1, 2, 3]. Gene expression is controlled by regulatory proteins, RNAs, and the cis-regulatory elements with which they interact. Genetic variation within cis-regulatory elements (CREs, e.g., transcription promoters, enhancers, or insulators) can affect gene expression in a cell type specific manner. An extensive body of work, performed in a variety of cell types in both humans and model organisms, has demonstrated that genetic variants that impact gene expression, or expression quantitative trait loci (eQTLs), are common and exist in both cis (local) and trans (over long genetic distances) [3, 4, 5, 6]. Over of genotype-phenotype associations identified in genome-wide association studies (GWAS) are with non-coding single nucleotide polymorphisms (SNPs), making their mechanistic interpretation more challenging. It is possible that these associated SNPs tag for coding SNPs; however, numerous compelling lines of evidence [7, 8, 2, 9, 10, 11] demonstrate that regulatory SNPs have causal roles in many complex human phenotypes. This is further supported by the finding that GWAS associations are enriched within DNase hypersensitivity (DHS) sites [12] and eQTL SNPs [13, 14], and by several elegant GWAS follow up studies that have mechanistically tied disease associations with SNPs that cause the misregulation of gene expression [15, 16].
Although eQTLs are increasingly used to provide mechanistic interpretations for human disease associations, the cell type specificity of eQTLs presents a problem. Because the cell type from which a given physiological phenotype arises may not be known, and because eQTL data exist for a limited number of cell types, it is critical to quantify and understand the mechanisms generating cell type specific eQTLs. For example, if a GWAS identifies a set of SNPs associated with risk of type II diabeties, the researcher must choose a target cell type to develop a mechanistic model of the molecular phenotype that causes the gross physiological change. One can imagine that the relevant cell type might be adipose tissue, liver, pancreas, or another hormone-regulating tissue. Furthermore, if the GWAS SNP produces a molecular phenotype (i.e., is an eQTL) in lymphoblastoid cell lines (LCLs), it is not necessarily the case that the SNP will generate a similar molecular phenotype in the cell type of interest. Furthermore, there are many examples of cell types with particular relevance to common diseases, for example dopaminergic neurons and Parkinson’s disease, that lack comprehensive eQTL data or catalogs of CREs. The utility of eQTLs for complex trait interpretation will therefore be improved by a more thorough annotation of their cell type specificity. While several studies have quantified the reproducibility of eQTLs within or between cell types derived from the same or different individuals [17, 18, 19, 20, 21, 22, 23, 24, 25, 26, 27] the determinants of eQTL cell specificity are still largely unknown.
In this study, we analyzed eQTL data collected from eleven studies performed in seven different cell types. We used Bayesian regression models to identify all cis-linked SNPs that are independently associated with each gene expression trait in each study. We find that accurately evaluating the frequency of overlap between eQTLs in distinct cell types is heavily dependent on confounding factors intrinsic to all eQTL studies. The typical eQTL overlap frequency between independent studies of the same cell type reaches , and thus, assuming that true eQTLs within a cell type should always replicate across studies, eQTLs that do not replicate between cell types will show up as drops from this lower bound rather than from an idealized . Moreover, eQTL replication frequencies are not uniformly distributed but are instead sensitive to numerous technical and biological covariates. For example, given that within cell type eQTL replication is dependent on the distance between the SNP and the TSS [26], simultaneous analysis of within and between cell type eQTL replication is necessary to characterize the relationship between eQTL cell type specificity and SNP location. Therefore, a biologically meaningful definition of eQTL cell type specificity requires us to identify, quantify, and properly control for factors that influence replication within cell types.
In an effort to functionally interpret the associations tagged by eQTL SNPs, we quantified the interactions between eQTL SNPs and CRE data sets, many of which were derived from the cell types used in eQTL discovery and are known to function in a cell type specific manner (e.g., transcription factor binding sites (TFBSs), open chromatin regions (OCRs)). We further considered the relationship between eQTL SNP-CRE overlap and the cell type specificity of eQTL replication. Lastly, we built a random forest classifier to predict the cell type specificity of eQTLs in the absence of additional gene expression data. We believe this predictive model will facilitate more substantial functional analyses of GWAS results by enabling the integration of disease genetics with the thousands of genomic data sets that have been produced by projects like ENCODE [28, 29].
Results
A uniform analysis of cis-eQTLs across seven cell types
In an effort to comprehensively characterize eQTL reproducibility within and between different cell types, we gathered publicly available data sets that included both gene expression and genotype data. This collection included eleven studies from seven unique cell types (Table 1) [30, 26, 17, 31, 32]. To ensure the data from each eQTL study were comparable, we uniformly processed all raw data by developing a standardized analysis pipeline that was designed to marginalize the effect of study design differences on the identified eQTLs (see Methods). Genotype data, regardless of array type, were subjected to standard quality control filters. Missing and unobserved genotypes were subsequently imputed to the SNPs in the HapMap phase 2 CEPH panel ( SNPs) using BIMBAM [33, 34]. Each gene expression array was uniformly re-annotated; probe sequences were aligned to the human reference genome (hg18) and to RefSeq gene models. Within each array platform, multiple probes mapping to a single gene were clustered as in previous work [26]. Only uniquely aligned probes that did not overlap known, common polymorphisms were included in our analysis.
| Study label | TLA | Tissue | genes | PMID | Accession | Platform | Genotype | |
| CAP_LCL | CPL | LCLs | GSE36868 | GPL6883-5509 | ILMN 310K & ILMN QUAD | |||
| Stranger_LCL | STL | LCLs | GSE6536 | GPL2507 | NA | |||
| Harvard_cerebellum | HCE | Cerebellum | NA | syn4505 | GPL4372 | GPL14932 | ||
| Harvard_prefrontal_cortex | HPC | Prefrontal cortex | NA | syn4505 | GPL4372 | GPL14932 | ||
| Harvard_visual_cortex | HVC | Visual cortex | NA | syn4505 | GPL4372 | GPL14932 | ||
| GenCord_fibroblast | GCF | blood fibroblasts | 19644074 | GSE17080 | GPL6884 | GPL6982 | ||
| GenCord_LCL | GCL | LCLs | 19644074 | GSE17080 | GPL6884 | GPL6982 | ||
| GenCord_tcell | GCT | blood t cells | 19644074 | GSE17080 | GPL6884 | GPL6982 | ||
| UChicago_liver | CLI | Liver | GSE26106 | GPL4133 | GPL8887 | |||
| Merck_liver | MLI | Liver | GSE9588 | GPL4372 | GPL3720&GPL3718&GPL6987 | |||
| Myers_brain | MBR | Brain | GSE8919 | GPL2700 | GPL3720&GPL3718 |
Given the non-uniform collection and availability of covariate information across studies (e.g., sample age, sex, array batch), we chose to control for the confounding effects of both known covariates and unknown factors by removing the effects of principal components (PCs; Table S1) [37, 38]. We projected residual expression variation to the quantiles of a standard normal distribution to control for outliers, and used these projected values as the quantitative traits for association mapping, which was performed in each study set using the same HapMap phase 2 CEPH SNP panel. We evaluated evidence for gene expression-genotype associations in terms of Bayes factors (BFs) using BIMBAM [33, 39], as BFs have been shown to be more robust to SNPs with small minor allele frequencies (MAF) than p-values [40, 33]. Although we computed a BF for every SNP-gene pair, we limit our subsequent analysis to cis-linked SNPs, or SNPs within Mb of the transcription start site (TSS) or transcription end site (TES) of a gene. False discovery rates (FDRs) for each study were empirically estimated by permutation. All comparisons between studies were performed on expressed gene-SNP pairs common to both studies. See Methods for complete details on the data preparation and association mapping.
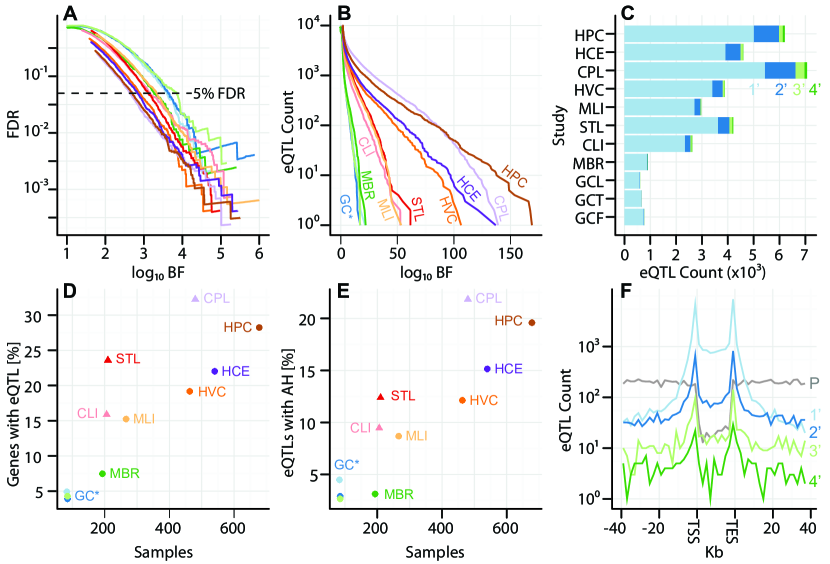
Considering only the most highly associated cis-SNP for each RefSeq gene (the primary eQTL SNP), across the studies considered here, we observe between and genes with eQTLs (), corresponding to thresholds between and (Figures 1A-C, Table 2). As expected, studies with larger sample sizes () and replicate gene expression measurements () identified more eQTLs at a given FDR threshold (Figure 1D). Indeed, across the studies examined here, of the variance in the proportion of genes with eQTLs can be explained by sample size and expression replication. The effect size distribution relative to study and to is also consistent with the expectation that larger studies identify eQTLs with smaller effect sizes (Figures S1-2). We expect that future eQTL studies with larger sample sizes (even from previously examined cell types) will identify additional eQTLs with smaller effects. We find that, despite study heterogeneity, the relationship between BF and FDR is quite uniform across studies (Figure 1A). As demonstrated in previous studies [41, 42], eQTL SNPs are highly enriched at the transcription start site (TSS) and transcription end site (TES) of the associated gene (Figure 1F).
| FDR | |||||||||
| Study | Tissue | eQTLs | eQTLs | eQTLs | eQTLs | ||||
| GenCord | fibroblasts | ||||||||
| GenCord | t cells | ||||||||
| GenCord | LCLs | ||||||||
| Harvard | cerebellum | ||||||||
| Harvard | prefrontal cortex | ||||||||
| Harvard | visual cortex | ||||||||
| Merck | liver | ||||||||
| Myers | brain | ||||||||
| UChicago | liver | ||||||||
| Stranger | LCLs | ||||||||
| CAP | LCLs |
Alellic heterogeneity is a pervasive property of cis-eQTLs
The extent to which multiple co-localized genetic variants exert independent influence on human phenotypes, referred to as allelic heterogeneity, is largely unknown. Several recent GWAS meta-analyses have estimated the frequency of allelic heterogeneity underlying human genotype-phenotype associations [43, 44], however, the number of associations examined remains relatively small. For example, of loci significantly associated with human height have more than one independently associated SNP [43].
Given that transcription for each gene is regulated by a complex interplay of multiple regulatory elements, often over large distances, it is plausible, and indeed expected, that numerous segregating cis-SNPs may independently affect the expression of a single gene. In particular, the ENCODE project has identified millions of regulatory elements across most of the genome, and these elements impact the transcription of only genes [28, 29]. Recently, several studies have quantified the frequency of allelic heterogeneity underlying eQTLs [45, 46], with estimates ranging from . We sought to extend these observations by leveraging the unprecedented size and breadth of the current combined study to identify the set of cis-SNPs that are independently associated with expression levels of each gene and to quantify the frequency of allelic heterogeneity in gene regulation (see Methods). To do this, we first identified, for each gene probe cluster, the most highly associated SNP within each local linkage disequilibrium (LD) block, tested the independence of each SNP by multivariate regression (Figure S3), and took the union of the independent SNPs that regulate a single gene. We refer to, for example, the first and second most significant, independently associated SNPs as primary and secondary SNPs, respectively, and we refer to the set of primary (secondary) SNPs as the primary (secondary) tier. For each study, and within each tier, we independently estimated FDR by permutation.
Across all eleven studies, ( of ) of eQTL-regulated RefSeq genes are independently associated with at least two SNPs in at least one study (; Figures 1C and 1E, Figures S1-2). Within each study, the fraction of eQTL-regulated genes with two or more independently associated SNPs ranges from (). As with primary eQTL discovery, sample size () and replicate expression measurements () are significantly and independently associated with the fraction of eQTL loci exhibiting significant allelic heterogeneity. Our search for allelic heterogeneity is power-limited and our estimates of its frequency should be taken as a lower bound; larger sample sizes will identify additional heterogeneity. Second tier eQTL SNPs reside significantly further from the associated gene TSS than primary tier eQTL SNPs (Figure 1D). For example, in the CAP_LCL eQTL data set, the median absolute distances between the TSS and primary and secondary eQTL SNPs are and kb, respectively ().
We performed a Gene Ontology (GO) [47] enrichment analysis (Table S2), which did not reveal easily interpretable functional differences in eQTL-regulated gene sets by cell type or tier. This implies that there are no obvious functional differences between either genes with more than one eQTL SNP, genes with a single eQTL SNP, and the background set of tested genes, further supporting the hypothesis that most genes harbor one or more eQTL SNPs of small effect, but power and computational limitations preclude identification of the complete set.
To determine the accuracy of our LD-based approximate method, we performed forward stepwise regression (FSR) on subset of genes with allelic heterogeneity [48, 49]. We compared the results from these two models on a set of genes with allelic heterogeneity in the CAP_LCL study (i.e., at least secondary eQTL SNPs; ). Our LD-based allelic heterogeneity ascertainment generally appears to underestimate the number of independently associated SNPs per gene, however this may be a result of the thresholds for SNP inclusion between the two methods being different (Figure S4, Table S3).
Cis-eQTL replication within and between cell types
We next investigated the cell type specificity of eQTLs, comparing eQTLs identified both within and between cell types. Cell type specific eQTLs are defined here as eQTL SNPs that replicate across studies of the same cell type but fail to replicate across studies of different cell types. Given the broad array of technical and biological factors known to influence the reproducibility of eQTLs [26, 22, 21, 37], our analysis of eQTL replication focused on three specific comparison sets:
-
1.
CAP_LCL versus Stranger_LCL and Merck_liver
-
2.
UChicago_liver versus Merck_liver and Stranger_LCL
-
3.
Harvard_cerebellum versus Myers_brain and Stranger_LCL.
Each trio of comparisons enabled the simultaneous quantification of within and between cell type eQTL reproducibility. Each of the six studies above used different expression platforms and were composed entirely of independent samples; principled approaches for the analysis of platform specific effects and paired subject study designs are the subject of current research. We note that this specific selection of comparisons is somewhat arbitrary but was driven by the computational requirements of each comparison and the sample size of the discovery cohort. However, the conclusions highlighted below are largely independent of the particular discovery cohort, replication cohort, or cell type (Figure 2, Figure S5, Table S4). We note that the Myers_brain samples include samples from several different brain cell types, a minority of which were cerebellum, implying that the cell type matching in comparison 3 above is inexact.
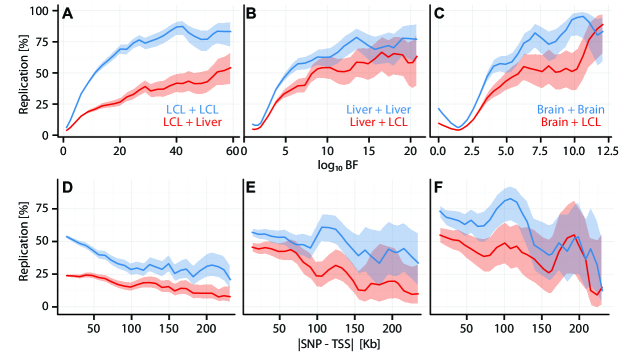
Consistent with previous observations, we find that a meaningful fraction of cis-eQTLs are cell type specific (Figure 2, Figures S5-7). Gene Ontology (GO) [47] enrichment analysis (Table S2) did did not reveal readily interpretable functional differences between sets of ubiquitous or cell type specific eQTLs. Across all comparisons, we find that within cell type replication frequencies, as a function of , plateau at , while between cell type replication frequencies plateau at (Figures 2A-C). Cis-eQTLs are therefore significantly more likely to replicate across studies within the same cell type than they are to replicate between different cell types (e.g., in CAP_LCL: ). We found that eQTL replication frequency is significantly associated with a number of factors (quantified by Equation (2)). Within and between cell type replication of CAP_LCL eQTLs is positively associated with discovery significance (within: , between: ) and negatively associated with absolute distance to the TSS (within: , between: ) and with eQTL tier (within: , between: ). We find that as the level of discovery significance increases, the likelihood that the eQTL replicates in both matched and unmatched cell types also increases, implying that cell type specific eQTLs tend to have smaller effects (Figure S7). Comparing each discovery data set with permuted replication data produced very few replicated associations, implying that the proportion of false positive replications is likely to be small (results not shown). However, we suspect that eQTLs that fail to replicate within cell type primarily consist of false negative replications, with a small proportion due to false positive eQTLs in the discovery data set that would not be expected to replicate in the second study. Comparing the proportion eQTLs that replicated between cell types to the proportion of eQTLs that replicated both within and between cell types may approximate the within cell type false negative rate under these assumptions (Figure S7).
Previous reports have conflicted with regards to the relationship between cell type specificity and eQTL location [17, 24, 18]. Our simultaneous analysis of within and between cell type replication across multiple discovery cell types sheds some light on this conflict: distal eQTLs are inherently less reproducible than are promoter proximal eQTLs, even across studies of the same cell type (Figure 2D-F). Without controlling for this effect, it would appear that between cell type replication frequencies decrease with increasing distance from the TSS (Figure 2D-F, Figures S6-7). Indeed, within cell type replication actually decreases at a modestly faster rate than does between cell type replication frequency (Figure 2D-F; , , , for LCLs, liver, and brain, respectively). In addition, cell specific replication frequency peaks at the TSS and decreases modestly at more distally linked SNPs (Figure S7). Any differences between the spatial distributions of cell type specific and more ubiquitous eQTLs therefore appear to be quite subtle.
eQTL SNP tier is significantly associated with eQTL replication frequencies; primary tier eQTL SNPs are significantly more reproducible than additional independently associated SNPs (Figure S8). For example, primary and secondary CAP_LCL eQTL SNPs () exhibit within cell type replication frequencies of and , respectively (Fisher’s exact test ). Additionally, primary eQTL SNPs are significantly less likely to be cell type specific, relative to additional independently associated SNPs. For example, and of primary and secondary CAP_LCL eQTL SNPs are cell type specific, respectively (Fisher’s exact test ). Therefore, for any given gene, the most highly associated eQTL SNP is more likely to be TSS-proximal, of large effect, and observed in additional cell types, whereas additional independent eQTL SNPs are more likely to be specific to the discovery cell type, have smaller effect sizes, and reside further from the TSS.
eQTL SNPs are associated with many classes of cis-regulatory elements
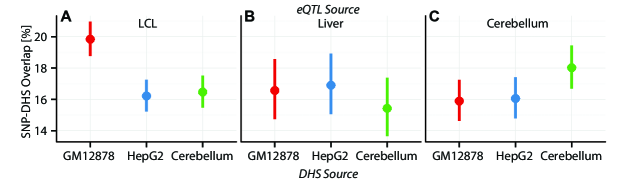
We next sought to investigate the biological characteristics associated with the reproducibility and cell specificity of eQTLs. To do this, we quantified the overlap between cis-eQTL SNPs and genomic features associated with functional cis-regulatory elements (CREs), including evolutionarily constrained elements, CpG islands, open chromatin regions, chromatin marks, and binding sites for insulators and other DNA associated regulatory proteins (see Table S5 for full list of data sets). We categorized regions of open or active chromatin, and regions of transcription factor or DNA protein binding as active CREs, and regions of repetitive, repressive, or heterochromatic chromatin domains as repressed CREs, to draw a contrast between genomic regions where transcription factor binding is frequent and regions where it is discouraged or unlikely. When data were available from multiple cell types and CREs were cell type specific, we focused analyses on the cell type that most closely matches the eQTL discovery cell type. For example, we focused analyses of LCL eQTL SNPs on CRE data sets produced in LCLs (primarily GM12878) and analyses of liver eQTLs on CRE data produced in HepG2 cells, a well-characterized, if imperfect, proxy for hepatocyte biology. We note that the quantification of eQTL SNP-CRE overlap enrichments is inherently conservative, given that the boundaries of most genomically defined CRE types are imprecise and that eQTL SNPs are typically tag SNPs, rather than the exact causal variants.
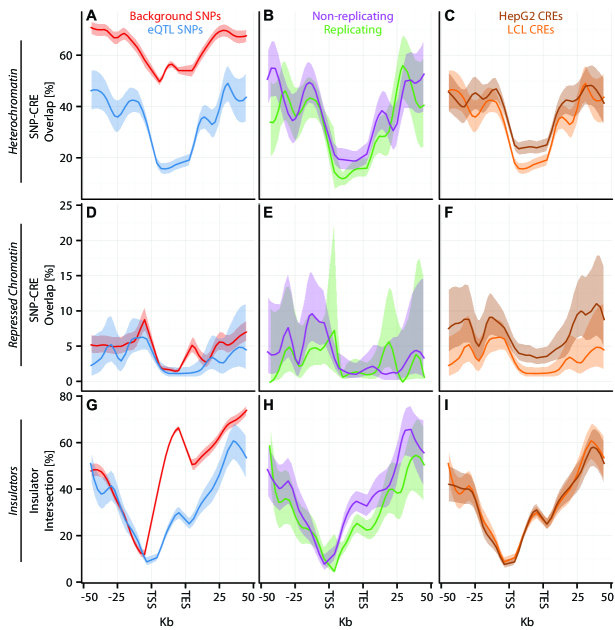
Consistent with the hypothesis that many eQTL SNPs exert their affect by modifying the biochemical function of CREs, cis-eQTLs are known to be enriched for overlaps with several classes of CREs, including DHS sites (Figure 3A), relative to the background distribution of tested cis-SNPs [50, 51]. Moreover, cis-eQTLs have been shown to be depleted within regions in which an insulator binding site lies between the eQTL SNP and the target gene TSS (Figure 4G). We further extend these observations by demonstrating that LCL eQTL SNPs are associated (, quantified by Equation (1)) with LCL derived CRE data sets, liver eQTL SNPs are associated with HepG2 derived CRE data sets, and cerebellum eQTL SNPs are associated with cerebellum derived CRE data set (Figures S9-10). We suspect that the decreased enrichment of liver eQTL SNPs within HepG2 CREs (relative to the enrichment observed between LCL eQTLs and LCL CREs) may be due to both the increased number of eQTLs identified in LCLs as well as the fact that HepG2 cells do not fully recapitulate the biology of primary hepatocytes. Almost universally, eQTL SNPs are enriched within regions of active CREs (Figure 3; Tables S6-S8), while being depleted within repressed CREs (Figure 4, Figures S9-10, Tables S6-S8). For example, we find that LCL eQTL SNPs are enriched within active CREs while being depleted within repressed CREs (Fisher’s exact test ). Liver eQTL SNPs display a similar enrichment within active CREs and depletion within repressed CREs (). Active CRE classes significantly enriched for eQTL SNPs include FAIRE domains, H3K27Ac domains, methylated DNA domains, and regions of H2A.Z, Pol II, and p300 enrichment (see Figure 3 for selected examples and Tables S6-S8 for complete results). CRE classes significantly depleted for eQTL SNPs include H3K27me3 and H3K9me3 domains and regions with intervening insulators (see Figure 4 for selected examples and Tables S6-S8 for complete results).
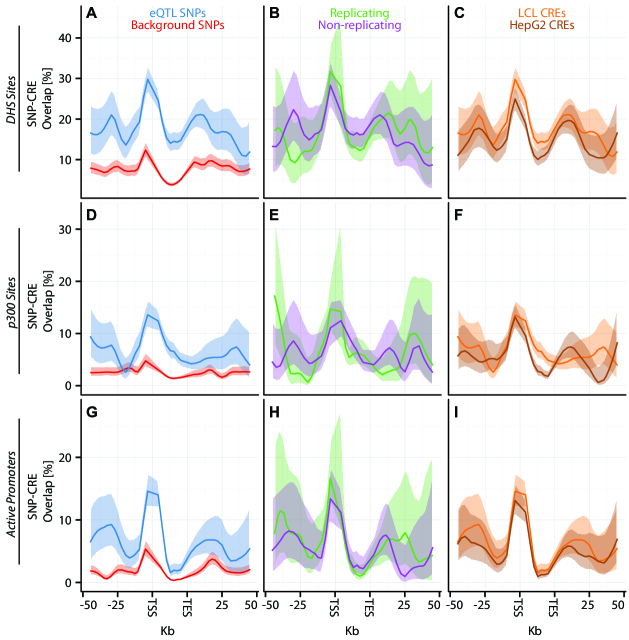
The frequency of eQTL SNP overlap with each class of CRE displays significant spatial structure and is typically consistent with the known biology of the CRE (Figures 3-4, Figure S11). Although substantial heterogeneity exists in the pattern of eQTL SNP enrichment across cis-regulatory element types, we find that eQTL SNP overlap with TFBS, OCRs, and active chromatin marks is markedly enriched immediately upstream of the TSS. For example, DHS sites are indicative of histone-depleted open chromatin and are a classic feature of active regulatory elements [52]. We find that the frequency of overlap between eQTL SNPs and DHS sites is greatest immediately adjacent to the TSS (Figure 3A-C), confirming that regulatory SNPs are enriched at transcriptionally active promoters. While this trend also exists in background SNPs, it is much more pronounced in eQTL SNPs ().
In contrast, we find that eQTL SNP overlap with heterochromatin, repressive chromatin, or repetitive regions is typically most highly depleted in the span immediately upstream of the TSS through the gene body (e.g., Figures 4A and D). Thus, eQTL SNPs are unlikely to be found within regions of repressed chromatin or heterochromatin, presumably because CREs within such regions are inaccessible to transcriptional regulators. Similarly, we find that intervening CTCF sites are most depleted immediately upstream of the gene TSS; the decay of this depletion is nearly symmetrical about the TSS (Figure 4G). The above mentioned spatial overlap patterns represent the most commonly observed patterns that we observed (Figures 3-4); intriguing modifications to these patterns were observed for many elements tested (e.g., chromHMM class transcription elongation, which is highest within the gene, Figure S11).
Secondary eQTL SNPs are themselves also associated with numerous CRE classes. For example, primary and secondary CAP_LCL eQTL SNPs are associated (, quantified by Equation (3)) with and LCL CRE classes, respectively (Figure S9, Table S9). Interestingly, CTCF insulator binding sites are significantly enriched between primary and secondary eQTL SNPs (Figure S12; , quantified by Equation (4)). Independently associated primary and secondary eQTL SNPs separated by less than kb are more than twice as likely to have an intervening insulator as similarly spaced background cis-SNPs ( versus ). We note that insulators are enriched between alternative promoters in Drosophila melanogaster [53], supporting the notion that insulators frequently demarcate CREs of the same gene, but, to our knowledge, this represents the first demonstration of this phenomenon in humans. These observations, combined with the substantial replication rates of non-primary eQTL SNPs (Figure S6), suggest that many of the SNPs identified in our scans for allelic heterogeneity tag SNPs affecting the biochemical function of distinct CREs that independently regulate transcription, rather than SNPs tagging the same causal regulatory variant.
Regulatory element overlap predicts eQTL reproducibility
We next investigated whether patterns of eQTL SNP-CRE overlap were associated with eQTL reproducibility. Within cell type reproducibility of CAP_LCL eQTL SNPs is significantly associated (, quantified by Equation (2)) with SNP overlap with LCL CRE data sets. Similarly, within cell type reproducibility of liver eQTL SNPs is significantly associated with SNP overlap with HepG2 CRE data sets. Furthermore, reproducible eQTLs are more likely to overlap active CRE classes, and are less likely to overlap repressed CRE classes than are non-reproducible eQTLs (in LCLs: , in liver: ; Figures 4B, 4E, 4H, and 5). For example, CAP_LCL eQTL SNPs are enriched, relative to background SNPs, within H3K36me3 enriched regions, which typically mark active transcription (). Moreover, CAP_LCL eQTL SNPs that replicate in Stranger_LCLs are significantly more likely to overlap H3K36me3 enriched regions than are eQTL SNPs that fail to replicate ().
Similarly, liver eQTL SNPs are enriched within FoxA1 binding sites more than would be expected from the distribution of background cis-SNPs (). Furthermore, within cell type reproducible liver eQTL SNPs are more likely to be found within FoxA1 binding sites than are irreproducible eQTL SNPs (). In summary, cis-eQTL SNPs are significantly enriched within active CREs and depleted within repressive chromatin, and, moreover, these associations are more pronounced when contrasted with externally replicating eQTLs. This suggests that irreproducible eQTL SNPs are often identifiable in the absence of additional gene expression data for particular cell types of interest when CREs are available for that cell type.
eQTL-regulatory element overlap is frequently cell type specific
Previous investigations have suggested several plausible mechanisms underlying the cell type specificity of eQTLs [18, 27, 24]. Cell type differences in expression of the gene of interest could modify the effect of an underlying regulatory SNP or decrease the sensitivity of eQTL discovery. Similarly, cell type specific differences in the expression of trans-acting regulators that bind to polymorphic TFBSs could generate SNPs with cell type specific expression associations. Given the known cell type specificity of regulatory protein binding sites and local chromatin environment [54, 55, 28], it is plausible that a SNP that disrupts a TFBS would have different downstream effects if it were found within a region of open, active chromatin as opposed to a region of repressed chromatin. Although the current resolution of CRE tag eQTL SNP data sets make this hypothesis difficult to test directly for individual SNPs, we sought to quantify the frequency, in aggregate, with which eQTL SNPs overlap CREs that differ between cell types using our identified eQTLs and CRE data from the ENCODE project.
We assessed cell specific eQTL SNP-CRE overlap for LCL, liver, and cerebellum eQTLs by quantifying the fraction of eQTL SNPs overlapping a CRE derived from the same cell type, relative to the fraction overlapping a CRE derived from a second cell type. When the frequency of overlap between an eQTL SNP set and the matched and unmatched cell type CREs are statistically significantly different, we consider the overlap to be cell specific. LCL and liver eQTL SNPs were tested for overlap with CRE data sets available from both LCLs and HepG2 cells, while cerebellum eQTLs were tested for overlap with a single pair of cerebellum and LCL CRE data sets. Consistent with a significant fraction of cell type specific eQTLs, we find that eQTL SNP-CRE overlap is frequently cell specific (see Figures 3, 4 and 5, for examples, Tables S6-S8 for full results). LCL and liver eQTL SNPs are significantly differentially represented (McNemar’s test ) in and CRE data types, respectively; moreover, cerebellum eQTLs are over-represented in cerebellum derived DHS sites relative to LCL DHS sites (Table S8). For example, and of CAP_LCL eQTL SNPs overlap LCL and HepG2 derived chromHMM strong enhancers, respectively (). Notably, the cannonical biochemical function of the CRE class is predictive of the pattern of cell type specific eQTL-CRE overlap. eQTL SNPs are more likely to overlap active CREs and less likely to overlap repressed CREs derived from the same cell type as the eQTL discovery data (repeated measures logistic regression ; Tables S6-S8).
Interestingly, while eQTL SNPs are typically more highly enriched within TFBS derived from the same cell type as opposed to the unmatched cell type, several of the exceptional CRE classes seem worthy of note. Both LCL and liver eQTL SNPs are significantly more likely to overlap IRF3 binding sites derived from LCLs, as well as RXRA binding sites derived from HepG2, consistent with the known biochemical function of these factors in the immune system and liver, respectively. We also investigated the relative locations of insulators with respect to cell type. We found that the proportion of eQTL SNP - TSS pairs with intervening insulators is remarkably consistent across cell types, indicating substantially less cell type specificity in insulator locations than in open, active, or repressed chromatin states (Figure 4I, Tables S6-S8). Analysis of the cell type specificity of LCL and HepG2 CTCF binding site overlap further supports this notion; of active CTCF binding sites overlap between LCLs and HepG2 cells, which is substantially greater than the overlap observed for DHS sites, FAIRE sites, or regions of active chromatin marks (Figure S13). Further supporting this observation, we note that a similar paucity of CTCF binding site cell type specificity exists in Drosophila melanogaster [53].
Genetic architecture of cell type specific eQTLs
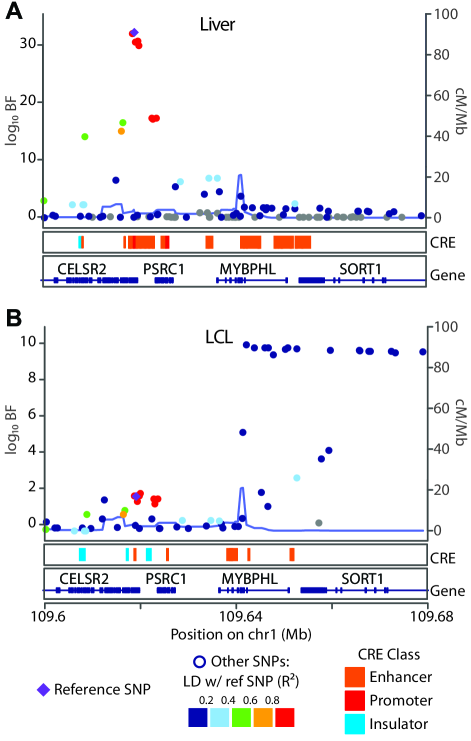
Consistent with the hypothesis that the CRE landscape is a major determinant of eQTL specificity, eQTL SNPs that overlap cell type specific CREs are more significantly likely to be cell type specific than are eQTL SNPs that overlap shared CREs (Fisher’s exact test ) for , , and CRE data sets in LCLs, liver, and cerebellum, respectively (Tables S6-S8). For example, LCL eQTLs are significantly more likely to be cell type specific (i.e., replicate in an independent cohort of LCLs but fail to replicate in the liver) when they overlap an LCL-derived p300 binding site, but fail to overlap a HepG2-derived p300 binding site (). Similarly, liver-derived eQTLs are significantly more likely to be cell type specific if they overlap a HepG2-derived open chromatin region but fail to overlap an LCL- derived open chromatin region (). To illustrate a specific example, we examined the pattern of cell specific eQTL SNP- CRE overlap at the SORT1 locus, a well characterized myocardial infarction risk locus (Figure 6) [15]. Consistent with previous obeservations, we find a liver specific eQTL association kb downstream of the SORT1 gene. Consistent with this specificity, we also observe that this eQTL SNP overlaps a cluster of predicted enhancers that are present in HepG2 cells but not LCLs.
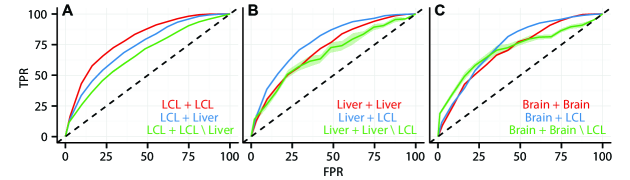
Given the association between cell type specific eQTLs and cell type specific cis-regulatory elements, we sought to test our ability to use CRE data in conjunction with genomic location information to predict the cell type specificity of eQTLs. We trained a random forest classifier on a large set () of features, including SNP position, effect size, cell type specific CRE overlap, and non-cell type specific genomic elements (see Table S5 for full list) to predict whether each eQTL SNP association would replicate in a second study (i.e., binary class). We validated the classifier with -fold cross validation. We found that the classifier could accurately predict within cell type eQTL replication, between cell type eQTL replication, and cell type specific eQTL replication (Figure 7, Table 3). For example, the area under the ROC curves (AUC) for within LCL replication, between LCL and liver replication, and LCL specific replication were , , and , respectively. Therefore, given a broad collection of chromatin state and regulatory factor binding site data sets, such as is available for a large number of cell types in the ENCODE project database, it is possible to predict with substantial accuracy whether a given eQTL association exists in a different, specific cell type, in the absence of any gene expression data from the second cell type.
| Prediction | AUC | Accuracy | |
|---|---|---|---|
| CAP_LCL Stranger_LCL | 0.79 | 0.74 | 0.44 |
| CAP_LCL Merck_liver | 0.73 | 0.82 | 0.16 |
| CAP_LCL (Stranger_LCL Merck_liver) | 0.67 | 0.71 | 0.18 |
| UChicago_liver Merck_liver | 0.74 | 0.70 | 0.39 |
| UChicago_liver Stranger_LCL | 0.77 | 0.73 | 0.29 |
| UChicago_liver (Merck_liver Stranger_LCL) | 0.71 | 0.66 | 0.30 |
| Harvard_cerebellum Myers_brain | 0.71 | 0.83 | 0.15 |
| Harvard_cerebellum Stranger_LCL | 0.77 | 0.81 | 0.23 |
| Harvard_cerebellum (Myers_brain Stranger_LCL) | 0.68 | 0.60 | 0.18 |
We further quantified the contribution of each feature to prediction accuracy (see Methods). Across all training sets, we found that eQTL discovery significance, SNP to TSS distance, and gene expression level contribute substantially to prediction accuracy (Table S10). Consistent with the relative cell type specificity of insulators and chromatin marks discussed above, cis-regulatory elements with different functionality vary considerably in the degree to which they are useful in predicting within or between cell type replication. For example, we find that the presence of intervening insulators contributes substantially to within cell type predictions but less so for between cell type predictions, as might be expected considering its function is less cell type specific. In contrast, cell type specific differences in the chromatin modification state of the eQTL SNP contribute substantially to the accuracy of predictions of between cell type eQTL replication.
This preliminary classifier serves a three-fold purpose. First, quantifying the importance of each feature for prediction accuracy enables the identification of specific CREs involved in determining the cell type specificity of regulatory SNPs. Second, it facilitates follow-up analyses of SNPs of interest by predicting the cell types in which they may be functional and the specific CREs that may determine the type of biochemical function they exert. Finally, it acts as a proof-of-concept for further refinements and generalizations for prediction of cell type specificity for specific eQTLs.
Discussion
The integrative analyses presented here provide new insights into the patterns of cis-eQTL replication within and between cell types, while controlling for biological and technical variation. Our predictive models allow us to make preliminary estimates of the likelihood of eQTL replication between cell types of interest based on the location of the eQTL, the cell types in question, known and predicted CREs, and gene function. Several notable results emerge from our analyses. We find that within cell type eQTL replication is relatively stable across different comparisons and uniformly greater than between cell type eQTL replication, indicating that a meaningful fraction of eQTLs are cell type specific. A substantial fraction of eQTL loci exhibit allelic heterogeneity (i.e., multiple genetic variants independently associated with an expression phenotype). We demonstrate that non-primary eQTLs replicate at substantial frequencies, and are more likely to be promoter distal and cell type specific.
Importantly, we demonstrate that eQTLs are more likely to overlap active CREs and less likely to overlap repressive CREs when they are ascertained from the same cell type versus different cell types. Cis-eQTL SNPs overlapping most classes of activating cis-regulatory elements are significantly more likely to replicate in independent studies. Conversely, eQTL SNPs that overlap repetitive or repressed chromatin states and eQTL SNP-gene pairs that are intersected by insulators are significantly less reproducible. Cis-eQTL SNP-CRE overlap is also significantly more predictive of eQTL reproducibility when the CRE data are derived from the same cell type as the gene expression data. Furthermore, eQTL SNPs that overlap cell type specific CREs are significantly enriched for cell type specific eQTLs, suggesting specific regulatory mechanisms for those cell type specific eQTL associations. The observed relationship between eQTL SNP reproducibility and CRE overlap led us to test the hypothesis that independently derived CRE data could be used to predict the cell type specificity of eQTLs in the absence of additional gene expression or genotype data. While we see room for substantial improvement, we believe that the successful validation of this hypothesis with a random forest classifier will enable improved interpretation of genome-wide association study results.
Because we remapped and clustered expression probes to create uniformity across the different gene expression array platforms, we actually created multiple gene expression values for each single gene. Although we combined the eQTL results across the different gene expression clusters for each gene after the analysis, in future work we will identify eQTLs jointly across the gene probe clusters. We performed this analysis in a genome-wide manner because the eQTLs we identify individually likely only tag the specific causal variant, but in aggregate are enriched within specific regulatory elements classes. This genome-wide enrichment points to biological mechanisms determining function and cell type specificity of SNPs, and enables the predictive models to perform well. One caveat to this interpretation is that, of the CREs that co-localize with eQTL SNPs in a cell type specific manner, some proportion of those CREs permissively allow the SNP to be functional (e.g., DHS sites are where transcription factors are able to bind to DNA), and some proportion will be the CREs through which the SNP influences genetic regulation (e.g., interrupting binding of a specific transcription factor). While we do not currently examine the directionality of these causal interactions, this is an area of current research.
After a GWAS is performed, it is now common practice to search eQTL databases to determine whether SNPs of interest are eQTLs for the cell type relevant to the study phenotype. When the SNPs are not known eQTLs in the cell type of interest, typically the line of reasoning is dropped; however, it is possible that the specific cell type was not tested, that the relevant SNP-gene pair was not interrogated, or that the sample size was too small for a cell type specific study to substantiate the SNP as an eQTL. Instead, if the researcher finds that the SNP is an eQTL in an alternative cell type, our classifier can be applied to determine the likelihood of the SNP being an eQTL in the cell type of interest if there are CRE data available for the relevant (or related) cell type. Furthermore, the genomic location can be scrutinized relative to known CREs to identify specific CRE types that may explain the mechanism by which gene transcription and downstream phenotype are regulated. Conversely, given those same GWAS hits, using these predictions one might be able to identify the physiologically relevant cell type based on overlap with (predicted or known) cell specific eQTLs.
Materials and Methods
Genotype preparation
Genotype data were downloaded from public databases or individual investigators as summarized in Table 1. Genotype and quality control filtering was performed with plink [56]. Individuals with a call rate of less than were removed. SNPs with a call rate of less than were classified as missing and later imputed. SNPs deviating from HWE were removed ().
Merck_liver study genotypes were previously imputed by MACH [57]; we extracted from the full set of SNPs only those that were unimputed (and we removed all of the imputed genotypes from individuals in the non-imputed SNPs) to represent the original genotyping data. This set we filtered using identical criteria as above.
The HapMap phase 2 individuals fully sequenced genotypes were downloaded from the Impute2 website [58]; we matched the genotypes to individuals by comparing individual SNPs to genotypes from the indexed individuals. We filtered these genotypes as above. We removed ungenotyped individuals in the Harvard study, leaving us with individuals with cerebellum tissue data, individuals with prefrontal cortex tissue data, and individuals with visual cortex tissue data.
Genotype imputation
Genotypes were imputed using BIMBAM [34]. We imputed genotypes up to the HapMap phase CEPH SNP set. BIMBAM removes SNPs with a minor allele frequency (MAF) less than or missing SNPs by default. For the studies with Caucasian only participants, we used only the unrelated CEPH individuals for imputation. For the UChicago_liver study, which has African American individuals (of subjects total), we used both the CEPH and the unrelated YRI individuals as a reference set. For the Stranger_LCL study on a subset of HapMap phase 2 individuals, we used the CEPH, YRI, and the unrelated JPT and CHB individuals’ genotypes and did not impute. Mean values for the imputed genotypes were used for association and other downstream analyses [39].
Gene expression preparation, normalization, and processing
For each expression array platform, probe sequences were aligned to the human reference genome (hg18) and the RefSeq transcript set. Probes with only one genomic alignment with identity to the reference genome, over the full length of the probe, were considered to be uniquely aligned. Probes that failed to align to the genome but did have at least one alignment with at least identity to a RefSeq transcript were further considered to be adequately aligned. All other probes were removed from further analyses. Based on genomic alignment coordinates and RefSeq gene annotations, each aligned probe was assigned to a RefSeq gene. We further searched the genomic locations of each probe alignment for the presence of common polymorphisms, as defined by dbSNP131 and the One Thousand Genomes Project (8/4/2010 release [59]).
Where appropriate, we defined a lower expression level boundary, above which we considered a gene to be expressed. Genes falling below the expression threshold were removed from further analyses. Low expression thresholds were defined either on the basis of negative control probes, exogenous RNA spike in probes, or the observed relationship between probe mean expression and variance.
Gene expression data from each study were prepared independently as follows. Poorly extracted, non-uniform, outlier, or other flagged features were treated as missing data. Where appropriate, background signal intensities were subtracted. Negative adjusted intensities were set to one half the minimum positive value on the array. Background corrected intensities were transformed. Missing data were imputed using the -nearest neighbors algorithm (), as implemented in the R package impute [60]. Each array was quantile transformed to the overall average empirical distribution across all arrays. Across all arrays within a study, each probe’s expression values were transformed to the quantiles of the standard normal distribution (or quantile normalized). Transformation to standard normal avoids potential problems due to outliers or other deviations from normality in later association tests [36]. For gene expression data derived from individuals with multiple ancestries (Stranger_LCL, UChicago_liver), we quantile normalized within each population separately to control for population-specific expression levels [61]. We controlled for known and unknown sources of non-genetic variation by correcting these data using their principle components (PCs), identified using the R function pca from the R package pcaMethods [37, 38]. We did not explicitly control for known covariates (e.g., age or sex) to enable cross-study comparison, and instead assumed that the relevant covariates will be incorporated in the PCs [38]. We jointly controlled for the effect of all PCs by again taking the residuals from a linear model with these PCs as covariates. We considered PCs until the difference in the variance explained by an additional PC was less than (Table S1). Finally, we quantile normalized these residuals within each probe and used these normalized data in our subsequent analyses.
For genes with multiple probes on a single array, we used the R package mclust [62] to cluster the probes samples matrix of expression levels. We allowed clusters per gene. Within each probe cluster, we used the per individual, PC corrected mean of the different probes as a proxy for the gene expression level for that collection of probes. Each probe cluster was modeled downstream independently, under the assumption that uncorrelated probe sets represent either independent transcript isoforms or poorly performing probes.
eQTL mapping
We used Bayesian regression, as implemented in BIMBAM [33, 39] to quantify the association between each SNP and residual gene expression data for each gene across each sample from each study. We used default parameters, which average over different plausible effect sizes for additive and dominant models. We used the mean imputed genotype for all studies except Stranger_LCLs, in which we used assayed genotypes for each individual because the individuals did not require imputation.
Summarizing eQTLs
We identified the SNP with the largest for each gene, and also identified the cis-SNP with the largest in each LD block around a gene. We defined LD blocks using the HapMap recombination rates [63] in which each SNP interval with cM/Mb defines the boundaries of an LD block. For each of these associations, we note the chromosome and location of the gene and SNP, major and minor allele of the SNP, the LD block index, the MAF of the SNP in the sample population, the value of the fit of the linear model between the imputed values for the SNP and the rounded values of the SNP, the magnitude and direction of the association () and the value of the fit of the linear model, the number of exons and the average length of the gene exons, number of probes corresponding to the probe cluster, mean gene expression value for those probes, and the for this association. We determine the maximum MAF for all SNPs overlapping expression array probe alignment coordinates using One Thousand Genomes Project data and dbSNP131. For all downstream comparisons between studies, we consider only expressed gene-SNP pairs in common between the two studies.
Evaluating FDR by permutation
To evaluate the FDR for each study, we permuted the sample indices on the gene expression data identically across genes within each study, and ran association mapping on these permuted data. Then, for each cutoff , we conservatively computed FDR by the number of associations identified in the original data at that cutoff divided by the number of associations identified in the permuted data at that cutoff (Table S11). We performed a single permutation for each study because of the resources required to run a single complete permuted association test. Unless otherwise noted, eQTL results in the text refer to associations significant at .
Multivariate analysis
Given the computational requirements of performing conditional QTL scans in eleven studies, we implemented a two step approach to identify independently associated SNPs at each gene. For each gene probe cluster, we identified the most highly associated SNP in each LD block within Mb of the gene’s transcription start site (TSS) or transcription end site (TES). We subsequently recomputed the BF of each SNP association by Bayesian multivariate regression to quantify the conditional independence of the effects of the associated SNPs [64]. Finally we took the union of the identified SNPs from all probe clusters for a single gene; when this set had more than one SNP below the appropriate cutoff, the gene is said to exhibit allelic heterogeneity.
We compared this approach to forward stepwise regression for a subset of CAP_LCL genes with significant allelic heterogeneity (). We implemented, in R, a custom forward stepwise regression with all SNPs within Mb of a gene’s TSS and TES to identify the set of independently associated SNPs. In particular, starting from the model with a gene probe cluster as the response variable and no covariates, we included a SNP in the model when it most improved the Bayesian Information Criterion (BIC) of the fitted model. The BIC is a criterion for model selection that takes into account both the likelihood of the model and the number of parameters (here, eQTL SNPs), so as to avoid excessive parameters that may result in overfitting. We continued to identify a single SNP that most improves the BIC and included that SNP in the model until a SNP resulted in a non-improvement of the BIC, when we stopped. As in the LD-based method, we took the union of the identified SNPs from all probe clusters for a single gene. Although forward selection is not exhaustive, it is tractable, and these results represent a more complete (but still conservative) estimate of the allelic heterogeneity for a particular gene relative to our method of identification (for full results comparison, see Table S3). In particular, we note that this method is an approximation in the presence of interactions [65], but we consider this case to be beyond the scope of this analysis.
Analysis of Gene Ontology annotation enrichment
We performed Gene Ontology (GO) [47] enrichment analyses using DAVID software [20]. We considered GO Biological Process ontology, Molecular Function ontology, and KEGG pathway [66] enrichment terms with (Table S2). We considered CAP_LCL, UChicago_liver, and Harvard_cerebellum as eQTL discovery data sets, and looked for enrichment among AH genes in these data, and also looked for enrichment among genes that did and did not replicate within cell type and between cell type studies as above.
Replication quantification
A SNP-gene association was considered ‘replicated’ if the in the target study of the same SNP-gene pair with a less than the cutoff for for that tier in the discovery data set. Only SNP-gene pairs that were observed in a given replication cohort were considered when calculating the replication frequency in that study. In other words, if a SNP failed quality control or if a gene was not represented on a particular gene expression microarray platform, the SNP-gene pair was not considered when calculating replication.
Comparison between eQTLs and functional genomic data sets
When available, CRE data from the CEU HapMap LCL line GM12878, the hepatocellular carcinoma HepG2 cell line, and primary cerebellum tissue were used to represent LCLs, liver, and cerebellum respectively. These data sets (fully listed in Table S5) were all downloaded directly from the ENCODE data coordination center at UCSC. Cell type independent data sets were also used, including CpG islands [67], GERP evolutionary constrained elements [68], clustered DNAse hypersensitive sites, and clustered transcription factor binding sites. A second chromatin structure segmentation (Segway [69]) data set, derived from the integration of K562 data sets, was also included in the regulatory element feature set. When available, precomputed ‘peak calls’ were used. If more than one replicate (i.e., peak calls generated in the same lab using the same antibody), was available, peak calls were merged by taking the union of all elements.
Given that a putative eQTL SNP does not necessarily represent the causal genetic variant, but rather is a ‘tag’ for the causal variant in substantial linkage disequilibrium, we classified a SNP as overlapping a given genomic element if it was either contained within the element or found within bp of the element boundary. CTCF sites were classified as eQTL interrupting if the midpoint of the CTCF binding site was between the eQTL SNP and the TSS of the associated gene.
To test if eQTL SNPs are enriched within each class of putative cis-regulatory element, we first modeled the background distribution of cis-linked SNPs as follows. All CEU HapMap phase 2 SNPs that lie within Mb of a RefSeq gene model TSS or TES, or lie within a RefSeq gene model were included. Each such SNP that was cis-linked to more than one RefSeq gene model was randomly assigned to one such gene. As with the eQTL SNP set, the background SNP set was tested for overlap with any element in each genomic feature class. For each eQTL or background SNP (), we modeled the probability of cis-regulatory element overlap () by logistic regression:
| (1) |
In this equation, we controlled for the effects of SNP position () and the expression level of the associated gene (), in order to quantify the difference in overlap frequency between observed eQTL SNPs and those drawn from the background SNP distribution (denoted by the indicator variable ).
Similarly, for each eQTL SNP (), we model the effect of cis-regulatory element overlap () on the probability of within cell type replication () by logistic regression:
| (2) |
In this equation, we controlled for the effects of SNP position and the significance of the eQTL association (, as assessed by Bayesian multivariate regression) and the ‘tier’ of the associated SNP (), in order to quantify the enrichment of within cell type replicating eQTLs in cis-regulatory elements.
We tested for an enrichment of second tier SNPs within CRE data sets, relative to the expectation from the background distribution of cis-linked SNPs, by modeling, for each SNP (), the probability of cis-regulatory element overlap () by logistic regression:
| (3) |
where we quantify the difference in overlap frequency between background SNPs, primary tier SNPs, and secondary tier SNPs with the indicator variable . Enrichment of secondary SNPs, relative to background, was quantified by testing for the significance of the difference between the estimates.
To test for an enrichment of CTCF sites between SNPs independently associated with the same gene expression trait (i.e., SNPs tagging the allelic heterogeneity at a given locus), we used the background distribution of cis-linked SNPs as defined above; however, for each RefSeq gene, two cis-linked SNPs were selected at random. This collection of background SNP pairs was contrasted with the first and second most highly associated SNPs at all genes for which the secondary SNP was significant at a threshold. For each SNP pair (), we modeled the probability of the presence of an intervening insulator () by logistic regression:
| (4) |
In this equation, we controlled for the inter-SNP distance (), SNP pair position relative to the gene TSS (, in which indexes each SNP in the pair), the presence of an intervening recombination hotspot (), and the presence of an intervening TSS (), in order to quantify the difference in insulator frequency between observed eQTL SNP pairs and those drawn from the background SNP distribution (denoted by the indicator variable ).
Predicting replicating eQTLs with random forests
We built a classifier to predict within cell type, between cell type, and cell type specific replication using random forests [70]. A random forest is an ensemble classifier that uses the mode of predictions from a large number of decision trees. For each pair of comparisons, we can train a random forest classifier to predict the binary replication outcome given a set of features about the genomic location of the eQTL and the CREs for the corresponding cell types (see Table S5 for complete set). We found this classifier worked well in this scenario because it is capable of capturing interactions within the features. We used the random forest classifier and computed variable importance using the R randomForest package [71]. We performed -fold cross validation to compute generalization error. We used the R package ROCR [72] to build the ROC curves and compute the AUC.
Additional statistical analyses
Unless otherwise noted, tests of categorical data were quantified by Fisher’s exact test. Tests of paired interval data were quantified by Wilcoxon’s rank sum test. tests of paired categorical data were quantified by McNemar’s test.
Acknowledgments
The authors would like to thank Manolis Dermitzakis for access to the GenCode study data, and Greg Crawford for pre-release access to DNAse I hypersensitive site data from cerebellum. The authors would also like to thank Greg Cooper, Greg Crawford, Ron Hause, and Matthew Stephens for helpful discussions, the ENCODE project, and all of the studies included here who made their gene expression, genotype, and CRE data public. The gene expression and genotype data designated by Harvard∗ were generated by Merck Research Laboratories in collaboration with the Harvard Brain Tissue Resource Center and was obtained through the Synapse data repository (data set id: syn4505 at https://synapse.sagebase.org/#Synapse:syn4505).
References
- 1. Cookson W, Liang L, Abecasis G, Moffatt M, Lathrop M (2009) Mapping complex disease traits with global gene expression. Nature reviews Genetics 10: 184–94.
- 2. Emilsson V, Thorleifsson G, Zhang B, Leonardson AS, Zink F, et al. (2008) Genetics of gene expression and its effect on disease. Nature 452: 423–8.
- 3. Gilad Y, Rifkin SA, Pritchard JK (2008) Revealing the architecture of gene regulation: the promise of eQTL studies. Trends in genetics : TIG 24: 408–415.
- 4. Brem RB, Yvert G, Clinton R, Kruglyak L (2002) Genetic dissection of transcriptional regulation in budding yeast. Science (New York, NY) 296: 752–5.
- 5. Schadt EE, Monks SA, Drake TA, Lusis AJ, Che N, et al. (2003) Genetics of gene expression surveyed in maize, mouse and man. Nature 422: 297–302.
- 6. Morley M, Molony CM, Weber TM, Devlin JL, Ewens KG, et al. (2004) Genetic analysis of genome-wide variation in human gene expression. Nature 430: 743–7.
- 7. De Gobbi M, Viprakasit V, Hughes JR, Fisher C, Buckle VJ, et al. (2006) A regulatory SNP causes a human genetic disease by creating a new transcriptional promoter. Science (New York, NY) 312: 1215–7.
- 8. Small KS, Hedman AK, Grundberg E, Nica AC, Thorleifsson G, et al. (2011) Identification of an imprinted master trans regulator at the KLF14 locus related to multiple metabolic phenotypes. Nature genetics 43: 561–4.
- 9. Göring HHH, Curran JE, Johnson MP, Dyer TD, Charlesworth J, et al. (2007) Discovery of expression QTLs using large-scale transcriptional profiling in human lymphocytes. Nature genetics 39: 1208–16.
- 10. Moffatt MF, Kabesch M, Liang L, Dixon AL, Strachan D, et al. (2007) Genetic variants regulating ORMDL3 expression contribute to the risk of childhood asthma. Nature 448: 470–3.
- 11. Emison ES, Garcia-Barcelo M, Grice EA, Lantieri F, Amiel J, et al. (2010) Differential contributions of rare and common, coding and noncoding Ret mutations to multifactorial Hirschsprung disease liability. American journal of human genetics 87: 60–74.
- 12. Maurano MT, Humbert R, Rynes E, Thurman RE, Haugen E, et al. (2012) Systematic Localization of Common Disease-Associated Variation in Regulatory DNA. Science 337: 1190–1195.
- 13. Nicolae DL, Gamazon E, Zhang W, Duan S, Dolan ME, et al. (2010) Trait-Associated SNPs Are More Likely to Be eQTLs: Annotation to Enhance Discovery from GWAS. PLoS Genet 6.
- 14. Fraser HB, Xie X (2009) Common polymorphic transcript variation in human disease. Genome research 19: 567–75.
- 15. Musunuru K, Strong A, Frank-Kamenetsky M, Lee NE, Ahfeldt T, et al. (2010) From noncoding variant to phenotype via SORT1 at the 1p13 cholesterol locus. Nature 466: 714–9.
- 16. Harismendy O, Notani D, Song X, Rahim NG, Tanasa B, et al. (2011) 9p21 DNA variants associated with coronary artery disease impair interferon- signalling response. Nature 470: 264–8.
- 17. Dimas AS, Deutsch S, Stranger BE, Montgomery SB, Borel C, et al. (2009) Common regulatory variation impacts gene expression in a cell type-dependent manner. Science (New York, NY) 325: 1246–50.
- 18. Fairfax BP, Makino S, Radhakrishnan J, Plant K, Leslie S, et al. (2012) Genetics of gene expression in primary immune cells identifies cell type-specific master regulators and roles of HLA alleles. Nature genetics 44.
- 19. Powell JE, Henders AK, McRae AF, Wright MJ, Martin NG, et al. (2012) Genetic control of gene expression in whole blood and lymphoblastoid cell lines is largely independent. Genome research 22: 456–66.
- 20. Huang DW, Sherman BT, Zheng X, Yang J, Imamichi T, et al. (2009) Extracting biological meaning from large gene lists with DAVID. Current protocols in bioinformatics / editoral board, Andreas D Baxevanis [et al] Chapter 13: Unit 13.11.
- 21. van Nas A, Ingram-Drake L, Sinsheimer JS, Wang SS, Schadt EE, et al. (2010) Expression quantitative trait loci: replication, tissue- and sex-specificity in mice. Genetics 185: 1059–68.
- 22. Nica AC, Parts L, Glass D, Nisbet J, Barrett A, et al. (2011) The architecture of gene regulatory variation across multiple human tissues: the MuTHER study. PLoS genetics 7: e1002003.
- 23. Ding J, Gudjonsson JE, Liang L, Stuart PE, Li Y, et al. (2010) Gene expression in skin and lymphoblastoid cells: Refined statistical method reveals extensive overlap in cis-eQTL signals. American journal of human genetics 87: 779–89.
- 24. Fu J, Wolfs MGM, Deelen P, Westra HJ, Fehrmann RSN, et al. (2012) Unraveling the regulatory mechanisms underlying tissue-dependent genetic variation of gene expression. PLoS genetics 8: e1002431.
- 25. Gerrits A, Li Y, Tesson BM, Bystrykh LV, Weersing E, et al. (2009) Expression quantitative trait loci are highly sensitive to cellular differentiation state. PLoS genetics 5: e1000692.
- 26. Innocenti F, Cooper GM, Stanaway IB, Gamazon ER, Smith JD, et al. (2011) Identification, replication, and functional fine-mapping of expression quantitative trait Loci in primary human liver tissue. PLoS genetics 7: e1002078.
- 27. Heap GA, Trynka G, Jansen RC, Bruinenberg M, Swertz MA, et al. (2009) Complex nature of SNP genotype effects on gene expression in primary human leucocytes. BMC medical genomics 2: 1.
- 28. Thurman RE, Rynes E, Humbert R, Vierstra J, Maurano MT, et al. (2012) The accessible chromatin landscape of the human genome. Nature 489: 75–82.
- 29. Dunham I, Kundaje A, Aldred SF, Collins PJ, Davis CA, et al. (2012) An integrated encyclopedia of DNA elements in the human genome. Nature 489: 57–74.
- 30. Stranger BE, Forrest MS, Dunning M, Ingle CE, Beazley C, et al. (2007) Relative impact of nucleotide and copy number variation on gene expression phenotypes. Science 315: 848–853.
- 31. Myers AJ, Gibbs JR, Webster Ja, Rohrer K, Zhao A, et al. (2007) A survey of genetic human cortical gene expression. Nature genetics 39: 1494–9.
- 32. Schadt EE, Molony C, Chudin E, Hao K, Yang X, et al. (2008) Mapping the genetic architecture of gene expression in human liver. PLoS biology 6: e107.
- 33. Servin B, Stephens M (2007) Imputation-based analysis of association studies: candidate regions and quantitative traits. PLoS genetics 3: e114.
- 34. Scheet P, Stephens M (2006) A fast and flexible statistical model for large-scale population genotype data: applications to inferring missing genotypes and haplotypic phase. American journal of human genetics 78: 629–44.
- 35. Simon JA, Lin F, Hulley SB, Blanche PJ, Waters D, et al. (2006) Phenotypic predictors of response to simvastatin therapy among African-Americans and Caucasians: the Cholesterol and Pharmacogenetics (CAP) Study. The American journal of cardiology 97: 843–50.
- 36. Barber MJ, Mangravite LM, Hyde CL, Chasman DI, Smith JD, et al. (2010) Genome-wide association of lipid-lowering response to statins in combined study populations. PloS one 5: e9763.
- 37. Leek JT, Storey JD (2007) Capturing heterogeneity in gene expression studies by surrogate variable analysis. PLoS genetics 3: 1724–35.
- 38. Pickrell JK, Marioni JC, Pai AA, Degner JF, Engelhardt BE, et al. (2010) Understanding mechanisms underlying human gene expression variation with RNA sequencing. Nature 464: 768–772.
- 39. Guan Y, Stephens M (2008) Practical issues in imputation-based association mapping. PLoS genetics 4: e1000279.
- 40. Stephens M, Balding DJ (2009) Bayesian statistical methods for genetic association studies. Nature reviews Genetics 10: 681–90.
- 41. Veyrieras JB, Kudaravalli S, Kim SY, Dermitzakis ET, Gilad Y, et al. (2008) High-Resolution Mapping of Expression-QTLs Yields Insight into Human Gene Regulation. PLoS Genet 4.
- 42. Veyrieras JB, Gaffney DJ, Pickrell JK, Gilad Y, Stephens M, et al. (2012) Exon-specific QTLs skew the inferred distribution of expression QTLs detected using gene expression array data. PloS one 7: e30629.
- 43. Lango Allen H, Estrada K, Lettre G, Berndt SI, Weedon MN, et al. (2010) Hundreds of variants clustered in genomic loci and biological pathways affect human height. Nature 467: 832–8.
- 44. Naitza S, Porcu E, Steri M, Taub DD, Mulas A, et al. (2012) A genome-wide association scan on the levels of markers of inflammation in Sardinians reveals associations that underpin its complex regulation. PLoS genetics 8: e1002480.
- 45. Wood AR, Hernandez DG, Nalls MA, Yaghootkar H, Gibbs JR, et al. (2011) Allelic heterogeneity and more detailed analyses of known loci explain additional phenotypic variation and reveal complex patterns of association. Human molecular genetics 20: 4082–92.
- 46. Zhang X, Cal AJ, Borevitz JO (2011) Genetic architecture of regulatory variation in Arabidopsis thaliana. Genome research 21: 725–33.
- 47. Ashburner M, Ball C, Blake J (2000) Gene Ontology: tool for the unification of biology. Nature …25: 25–29.
- 48. Wang S, Yehya N, Schadt EE, Wang H, Drake Ta, et al. (2006) Genetic and genomic analysis of a fat mass trait with complex inheritance reveals marked sex specificity. PLoS genetics 2: e15.
- 49. Stranger BE, Montgomery SB, Dimas AS, Parts L, Stegle O, et al. (2012) Patterns of Cis Regulatory Variation in Diverse Human Populations. PLoS Genetics 8: e1002639.
- 50. Degner JF, Pai AA, Pique-Regi R, Veyrieras JB, Gaffney DJ, et al. (2012) DNase I sensitivity QTLs are a major determinant of human expression variation. Nature 482: 390–4.
- 51. Gaffney DJ, Veyrieras JB, Degner JF, Pique-Regi R, Pai AA, et al. (2012) Dissecting the regulatory architecture of gene expression QTLs. Genome biology 13: R7.
- 52. Boyle AP, Davis S, Shulha HP, Meltzer P, Margulies EH, et al. (2008) High-resolution mapping and characterization of open chromatin across the genome. Cell 132: 311–22.
- 53. Nègre N, Brown CD, Shah PK, Kheradpour P, Morrison CA, et al. (2010) A comprehensive map of insulator elements for the Drosophila genome. PLoS genetics 6: e1000814.
- 54. Ernst J, Kheradpour P, Mikkelsen TS, Shoresh N, Ward LD, et al. (2011) Mapping and analysis of chromatin state dynamics in nine human cell types. Nature 473: 43–9.
- 55. Cooper SJ, Trinklein ND, Nguyen L, Myers RM (2007) Serum response factor binding sites differ in three human cell types. Genome research 17: 136–44.
- 56. Purcell S, Neale B, Todd-Brown K, Thomas L, Ferreira MAR, et al. (2007) PLINK: a tool set for whole-genome association and population-based linkage analyses. American journal of human genetics 81: 559–75.
- 57. Li Y, Willer CJ, Ding J, Scheet P, Abecasis GR (2010) MaCH: using sequence and genotype data to estimate haplotypes and unobserved genotypes. Genetic epidemiology 34: 816–34.
- 58. Howie B, Marchini J, Stephens M (2011) Genotype Imputation with Thousands of Genomes. G3: Genes, Genomes, Genetics 1: 457–470.
- 59. 1kg (2010) A map of human genome variation from population-scale sequencing. Nature 467: 1061–73.
- 60. Troyanskaya O, Cantor M, Sherlock G, Brown P, Hastie T, et al. (2001) Missing value estimation methods for DNA microarrays. Bioinformatics 17: 520–525.
- 61. Kudaravalli S, Veyrieras JB, Stranger BE, Dermitzakis ET, Pritchard JK (2009) Gene expression levels are a target of recent natural selection in the human genome. Molecular biology and evolution 26: 649–58.
- 62. Fraley C, Raftery A, Wehrens R (2005) Incremental Model-Based Clustering for Large Datasets With Small Clusters. Journal of Computational and Graphical Statistics 14: 529–546.
- 63. Frazer KA, Ballinger DG, Cox DR, Hinds DA, Stuve LL, et al. (2007) A second generation human haplotype map of over 3.1 million SNPs. Nature 449: 851–61.
- 64. Wen X, Stephens M (2011) Bayesian Methods for Genetic Association Analysis with Heterogeneous Subgroups: from Meta-Analyses to Gene-Environment Interactions .
- 65. Storey JD, Akey JM, Kruglyak L (2005) Multiple locus linkage analysis of genomewide expression in yeast. PLoS biology 3: e267.
- 66. Kanehisa M, Goto S, Sato Y, Furumichi M, Tanabe M (2012) KEGG for integration and interpretation of large-scale molecular data sets. Nucleic acids research 40: D109–14.
- 67. Gardiner-Garden M, Frommer M (1987) CpG Islands in vertebrate genomes. Journal of Molecular Biology 196: 261–282.
- 68. Cooper GM, Stone EA, Asimenos G, Green ED, Batzoglou S, et al. (2005) Distribution and intensity of constraint in mammalian genomic sequence. Genome research 15: 901–13.
- 69. Hoffman MM, Buske OJ, Wang J, Weng Z, Bilmes JA, et al. (2012) Unsupervised pattern discovery in human chromatin structure through genomic segmentation. Nature methods 9: 473–476.
-
70.
Breiman L (2001) Random Forests.
Machine Learning 45: 5–32.
Key: springerlink:10.1023/A:1010933404324
Annotation: 10.1023/A:1010933404324 - 71. Liaw A, Wiener M (2002) Classification and Regression by randomForest. R news 2: 18–22.
- 72. Sing T, Sander O, Beerenwinkel N, Lengauer T (2005) ROCR: visualizing classifier performance in R. Bioinformatics (Oxford, England) 21: 3940–1.