Magnetic Field Strength and Inclination in the Penumbral Fine-Structure
Abstract
The uncertainty about a possible correlation between strength and inclination of the magnetic field and the continuum intensity of the sunspot penumbral fine-structure has been removed by a detailed analysis of a spatially very high resolved spectrum: the darker, lengthy penumbral lanes host a 10% stronger and up to flatter magnetic field as compared to the bright penumbral locations. This finding does not only result from the high spatial resolution achived but also from the choice of the Fe I 6842.7 line, which obtains its essential contribution from those deep layers near the continuum intensity level where the penumbral structure is seen. The almost perfect correlation establishes that the penumbral structure is formed by two magnetic components, which mainly differ by their field inclination and less by their field strength. The discrepancy with results from other Zeeman lines, as e.g. Fe I 6302.5, indicates a different field structure above the white light penumbral layers.
keywords:
Sun: sunspot penumbrae, magnetic field structure, fine-structure1 Introduction
Sunspot penumbrae are highly structured with bright and dark ’fibrils’ extending quasi-radially from the umbra to the surrounding photosphere. Their widths are too small to be spatially resolved in Earth-bound observations which are degraded by turbulence in the Earth’s atmosphere (seeing). Although modern image processing can eliminate almost entirely this influence, the finally restored two-dimensional images with a spatial resolution at the limits of the solar telescope used, e.g. 200 km on the sun, contain only few information such as the temperature (using the Planck law; Sütterlin & Wiehr 1998). This temperature structure is commonly assumed to be caused by the magnetic field, which has so far not been measured at a spatial resolution near that of processed white light images, since a spectrograph and polarization optics are required. First attempts to remove influences of seeing from spectra (Keller & Johannesson 1995, Sütterlin & Wiehr 2000) gave an improved spatial resolution for line intensity profiles, however, not for Zeeman polarization.
It is thus rather astonishing that it was possible to deduce from spectra with moderate spatial resolution ‘flatter and stronger magnetic fields in the dark structure’ of sunspot penumbrae as claimed by Beckers & Schröter (1968). Careful inspection of their photographic spectra, however, gives strong indication that they were referring to pronounced penumbral ’disturbances’ rather than to smallest penumbral structures. It, indeed, was not until 1990 that the spatial variation of the field inclination has been measured independently by Lites, Scharmer, Skumanich (1990), Degenhardt & Wiehr (1991), and Schmidt et al. (1992).
However, the question of a possible relation with the field strength remained a subject of considerable controversy: Degenhardt & Wiehr (1991), Lites et al. (1993), Stanchfield, Thomas, Lites (1997) found the steeper fields to be stronger, contradicting the 1968 finding. Even the question whether spatial variations of the penumbral field strength do exist at all, is still open: the observations span results between 400 Gs (Lites, Scharmer, Skumanich 1990), 200 Gs (Solanki, Rüedi, Livingston 1992), and no spatial field variations (Schmidt et al. 1992).
A systematic relation with the continuum brightness has hitherto not been found. Although Schmidt et al. (1992) and Hofmann et al. (1994) report more horizontal fields in the dark structure (in agreement with Beckers & Schröter 1968), recently Bernasconi et al (1998) find weaker and more horizontal fields in the brighter structure. Lites, Scharmer, Skumanich (1990) say that ‘variations of the field strength are much less dramatic than those of the continuum intensity’.
2 Observations
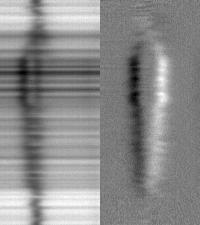
As long as (speckle) reconstructed data of the penumbral Zeeman polarization is not available, only frame-selected slit spectra may help to solve the persistent controversy. In addition, a spectral line is required which probes those deep layers where the penumbral continuum structure does exist. This is most reasonably fulfilled by Fe I 6842.7 Å which has the same Landé factor (g=2.5) as the often used Fe I 6302.5 line, but its larger wavelength yields a 1.09 times higher ratio of Zeeman splitting and line width . It therefore gives for a field strength of only 2000 Gs already a separation of the -components of mÅ (Degenhardt & Wiehr 1991) and is thus totally split in penumbrae (Fig. 1; see also Wiehr 1999). This allows to directly determine the field strength; and the amount of circular polarization (Stokes-V maximum) is then purely determined by the magnetic field inclination cos (with respect to the line-of-sight).
Stokes spectra of highest spatial resolution were obtained on 20 August, 1999, with the evacuated 45 cm Gregory-Coudé solar telescope on Tenerife (Schröter, Soltau, Wiehr 1985) observing a sunspot at . The spectrograph slit of correspondingly 0.75 arcsec width (i.e. km on the solar surface) intersects the penumbral fine-structure almost perpendicularly. Behind the slit, a quarter-wave plate followed by a calcite block is used to analyze the circularly polarized light from the longitudinal Zeeman effect. The 0.15 sec integration of the CCD-camera gives penumbral continuum intensities of 4000 counts.
During a period of exceptionally good seeing, one spectrum among a series of bursts achieves nearly the spatial resolution limit of telescope plus spectrograph. It is processed in the usual manner, i.e. an elimination of the dark and the flat matrices, and the subtraction of the simultaneously taken left and right handed polarized sub-spectra. The resulting Stokes-V is shown in figure 1 where the smallest spatial structure has a half-width of 0.7 arcsec (see also Fig. 4).


3 Results and their discussion
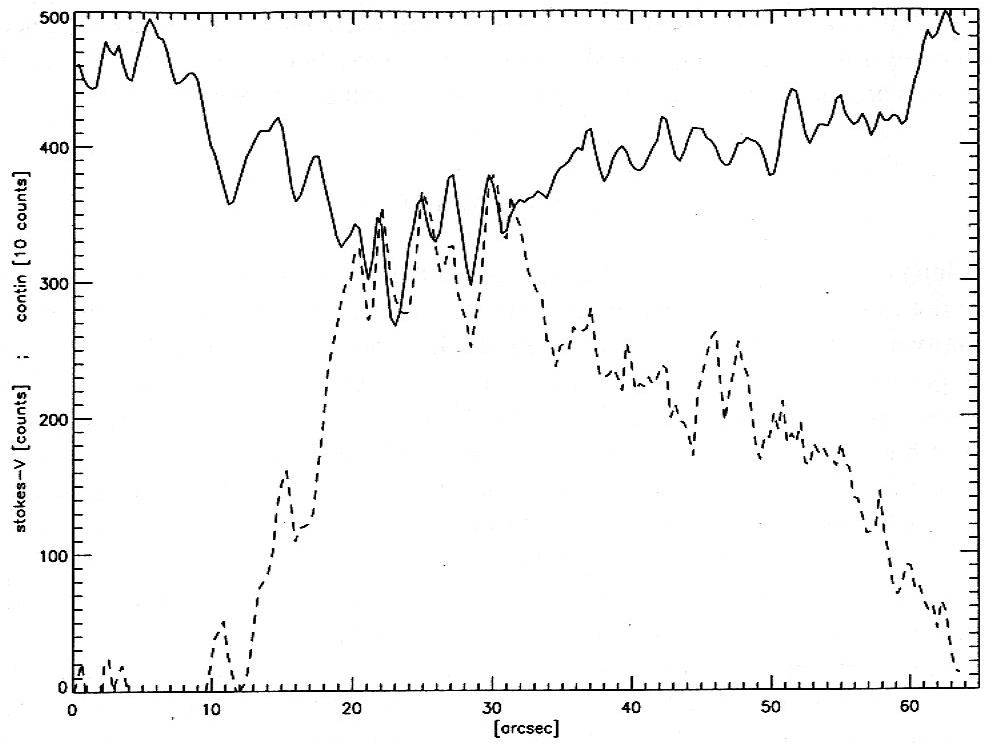
In order to obtain the spatial variation of intensity and total polarization with low noise, the continuum intensity is averaged over 0.5Å (between two absorption lines), and the absolute amount of circular polarization is integrated over 0.5Å, covering both Zeeman components. The resulting scans in figure 2 show larger circular Zeeman polarization in the brighter penumbral structures.
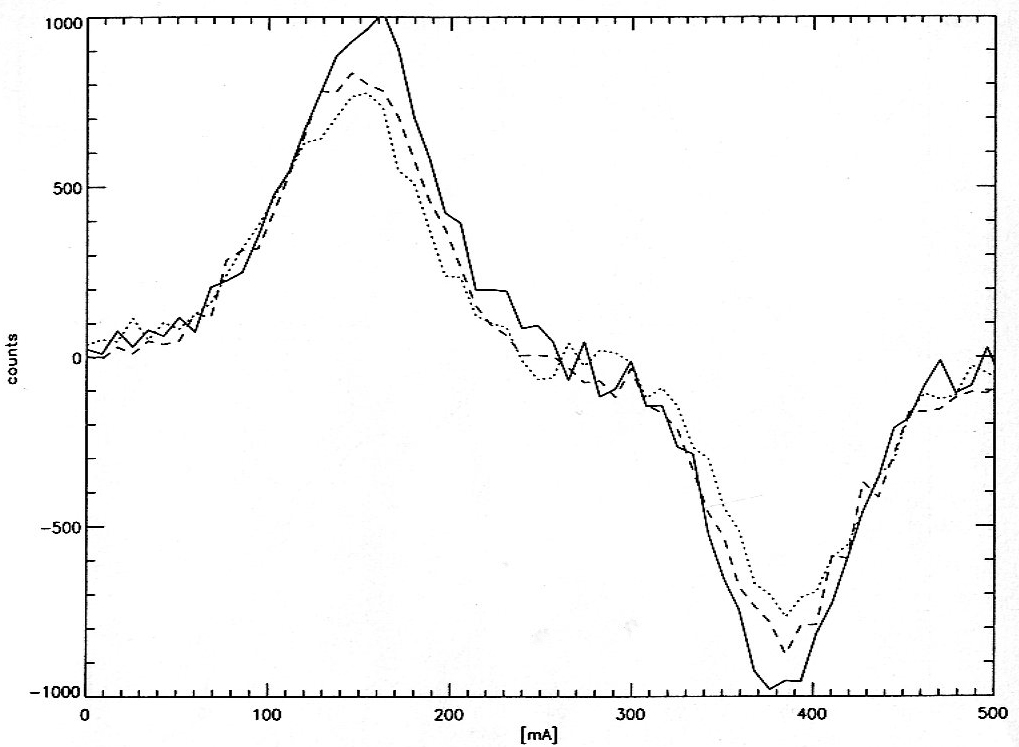
Figure 3 gives examples of Stokes-V profiles from three spatial locations at 21.2”, 22.0”, and 23.0” in figure 2, representing one bright continuum streak and its two dark neighbors. The small differences of the Zeeman splitting indicate a small spatial variation of the magnetic field strength. The Stokes-V extrema indicate a stronger variation of the field inclination. The scans show that the rms noise is of the order of .
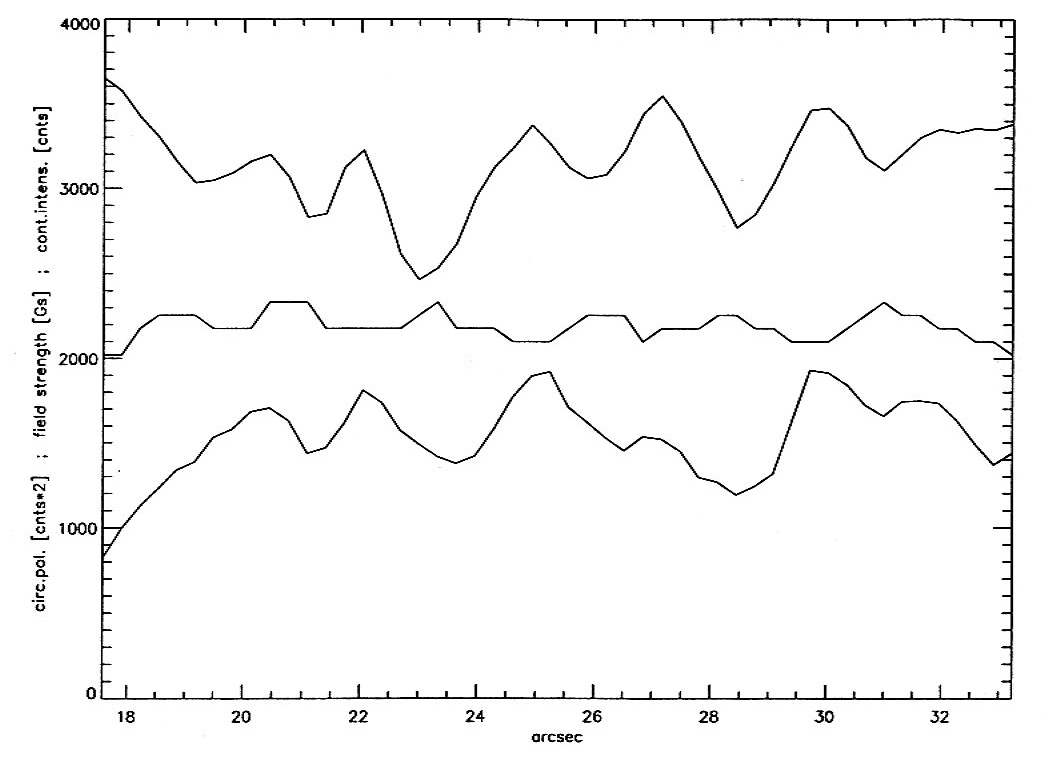
For a detailed investigation, the Zeeman components are fitted with Gaussian profiles at locations of complete splitting (i.e. 18”–33” in figure 2). Here, the wavelength separation of the polarization extrema, , is linearly related with the field strength, ; the Stokes-V amplitude then being a measure for the field inclination, cos. Figure 3 gives the spatial variation of the total Stokes-V amplitude, , together with the spatial variation of and the continuum intensity. It clearly shows that less inclined and stronger fields are located in the dark penumbral lanes. The Stokes-V variation can not result from the intensity variations alone since these are considerably smaller.
At locations in the outer penumbra, where the field strength is not high enough to yield a total line splitting, (i.e. outside the range 18”–33” in figure 2), the Stokes-V amplitude is proportional to thus not allowing a separation of and . We may, however, reasonably extend the results found for locations with total splitting (figure 4) also for the remaining spatial locations, i.e., higher field strength in dark structures. In that case, the positive correlation of Stokes-V with the continuum intensity through the whole penumbra (cf., figure 2) indicates that the spatial variation of the inclination generally exceeds that of the field strength. If, instead, the strength dominated, one would observe larger Stokes-V in dark rather than in bright continuum streaks, i.e. an anti-relation between Stokes-V and continuum, – which is not observed.

Particularly this latter finding demonstrates that the penumbral structure is mostly produced by a spatial variation of the inclination rather than of the strength of the magnetic field, which varies only by about 10%. This picture of a sunspot penumbra nicely fits model calculations by Schlichenmaier, Jahn, Schmidt (1998) proposing rising flux tubes which produce the locally steeper fields in the brighter penumbral structures. However, this model predicts that the latter are invisible since optically thick; the present results then suggest to reconsider that model.

4 Conclusion
An important condition for the above findings is the total Zeeman splitting of Fe 6842.7Å in penumbrae which allows the separation of strength and inclination of the magnetic field. This is not the case for the widely used Fe 6302.5Å (and Fe 6173), which are not completely split by a penumbral magnetic field (Wiehr 1999). For such an incomplete splitting, a separation of field strength and inclination would require model calculations, which are potentially ambiguous since the detailed conditions in the various bright and dark penumbral structures are unknown.
However, also at locations of complete Zeeman splitting (cf., figure 3), a quantitative determination of the field inclination from the Stokes-V signal requires a knowledge of the model atmosphere in the respective bright or dark penumbral structure. Application of a mean penumbral model (Kjeldseth-Moe & Maltby 1969) yields fluctuations . But such a use of a mean atmosphere ignores that the line depth of Fe 6842.7Å, and thus Stokes-V, increases in hotter structures; – this in addition to its intensity dependence. An interpretation of penumbral Stokes signals with a mean model can thus even hide essential information about the magnetic field (Wiehr 1974; section-6) and may well affect apparent ’variations’ of the field inclination.
Even the application of separate models for bright and dark lanes (Kjeldseth-Moe & Maltby 1974) will not help, since these are based on ‘typical’ intensities of bright and dark penumbral structures with Ib=0.95 and Id=0.61 (from Muller 1973), which have been contested by Grossmann-Doerth and Schmidt (1981) who find a single peaked histogram for penumbral intensities rather than a double peaked one. The latter reflects the fact that the penumbral structure is not defined in absolute brightness but only relative to its neighborhood, since dark structures do exist, which are even brighter than faintest bright structures in a penumbra (Wiehr et al. 1984). The different atmospheric conditions in individual penumbral structures include the possibility that observed variations of Stokes-V may be produced by their different atmospheres rather than by the actual magnetic field inclination.
Apart from this intrinsic complication, the present finding that dark penumbral structures host stronger and flatter fields essentially results from the fact that the Fe 6843 line used probes deep layers being close to those where the penumbral continuum structure occurs. The absence of such a correlation in former data may essentially be due to the use of absorption lines, which obtain considerable contribution from layers above the penumbral white light structure. The widely used Fe 6303 line has an almost 2.5 times larger equivalent width, , and is not located on the linear part of the curve-of-growth but already saturates. It originates almost 200 km above Fe 6843 and hardly probes those deep layers, which host magnetic field and Evershed flow. This is also indicated in recent investigations by Schlichenmaier & Schmidt (2000).
The largely differing results deduced from lines, which obtain considerable contribution at larger heights, indicate that those higher layers contain different fields (and flows). In particular, the significantly smaller mean field strength obtained from lines probing higher layers (Wiehr 1999) may hardly be explained by a simple field gradient. I like to suggest that only those (inner) bright penumbral structures, which move toward the umbra, are the rising flux-tubes in the theoretical picture by Schlichenmaier, Jahn, Schmidt (1998). Other (more outer) bright structures, which do not show a similarly strong radial motion in white light images, might represent the foot-points of a (fainter) ‘background field’ reaching high layers and affecting the ‘super-penumbra’ visible in chromospheric lines.
Acknowledgements
The Gregory-Coudé Telescope on Tenerife is operated by the University of Göttingen at the Spanish ’Observatorio del Teide’ of the Instituto de Astrofisica de Canarias.
References
- Beckers and Schröter (1968) Beckers J.M., Schröter, E.H.: 1968, Solar Phys. 4, 303
- Bernasconi et al. (1998) Bernasconi P.N., Keller C.U., Solanki S.K., Stenflo, J.O., 1998, Astron. Astrophys. 329, 704
- Degenhardt and Wiehr (1991) Degenhardt D., Wiehr E., 1991, Astron. Astrophys. 252, 821
- UGD and Schmidt (1981) Grossmann-Doerth U., Schmidt W., Astron. Astrophys. 95, 366
- Hofmann et al. (1994) Hofmann J., Deubner F.L., Fleck B., Schmidt, W., 1994, Astron. Astrophys. 284, 269
- Keller and Johannesson (1995) Keller, C.U. and Johannesson, A.: 1995, Astron. Astrophys. Supl. 110, 565.
- Kjeldseth-Moe and Maltby (1969) Kjeldseth-Moe O., Maltby P., 1969, Solar Phys. 8, 23
- Kjeldseth-Moe and Maltby (1974) Kjeldseth-Moe O., Maltby P., 1974, Solar Phys. 36, 101
- Lites et al. (1991) Lites B.W., Scharmer G., Skumanich A., 1990, Astrohys. J 355, 329
- Lites et al. (1993) Lites B.W., Elmore D.F., Saegraves P., Skumanich, A., 1993, Astrohys. J 418, 928
- Muller (1973) Muller R.: 1973, Solar Phys. 32, 409
- Schlichenmaier et al. (1998) Schlichenmaier R., Jahn K., Schmidt H.U, 1998, Astron. Astrophys. 337, 897
- Schlichenmaier and Schmidt (2000) Schlichenmaier R., Schmidt W., 2000, Astron. Astrophys. (in press)
- Schmidt et al. (1992) Schmidt W., Hofmann A., Balthasar H., Tarbell T.D., Frank, Z.A., 1992, Astron. Astrophys. 264, L-27
- Schr”oter et al. (1985) Schröter E.H., Soltau D., Wiehr, E., 1985, Vistas in Astronomy 28, 519
- Solanki et al. (1992) Solanki S.K., Rüedi I., Livingston W., 1992, Astron. Astrophys. 263, 339
- Stanchfield et al. (1997) Stanchfield D.,C.,H., Thomas J.H., Lites, B.,W., 1997, Astrohys. J 477, 485
- Sütterlin and Wiehr (1998) Sütterlin P., Wiehr E., 1998, Astron. Astrophys. 336, 367
- Sütterlin and Wiehr (2000) Sütterlin P., Wiehr E., 2000, Solar Phys. 194 35
- Wiehr (1974) Wiehr E.: 1974, Solar Phys. 35 351
- Wiehr et al. (1984) Wiehr, E., Koch, A., Knölker, M., Küveler, G., Stellmacher, G.: 1984 Astron. Astrophys. 140, 352
- Wiehr (1999) Wiehr E.: 1999, in B. Schmieder, A. Hofmann, J. Staude (eds.) Adv. in Sol. Phys. Euroconf. ‘Magnetic Fields an Oscillations’ ASP Conf. Ser. 184, p.86