Intrinsic Shape of Star-Forming BzK Galaxies II: Rest-Frame UV and Optical Structures in GOODS-South and SXDS
Abstract
We study statistical intrinsic shape of star-forming BzK galaxies (sBzK galaxies) at in both rest-frame UV and rest-frame optical wavelengths. The sBzK galaxies are selected down to mag in the Great Observatories Origins Deep Survey-South (GOODS-S) and Subaru-XMM Deep Survey (SXDS) fields, where high-resolution images from Hubble Space Telescope are publicly available. 57% (583) of all 1028 galaxies in GOODS-S show a single component in the Advanced Camera for Survey (ACS)/F850LP image. As Wide Field Camera (WFC3)/F160W images cover only some part of GOODS-S and SXDS, 724/1028 and 2500/29835 sBzK galaxies in the GOODS-S and SXDS have the WFC3 coverage. 86% (626) and 82% (2044) of the sBzK galaxies in WFC3/F160W images appear as a single component in the GOODS-S and SXDS, respectively. Larger fraction of single-component objects in F850LP images represents multiple star-forming regions in galaxies, while they are not so obvious in the F160W image which appears smoother. Most of the single-component sBzK galaxies show Sérsic indices of , in agreement with those of local disk galaxies. Their effective radii are kpc and kpc in F850LP and F160W images, respectively, regardless of the observed fields. Stellar surface mass density of the sBzK galaxies is also comparable to that of the local disk galaxies. However, the intrinsic shape of sBzK galaxies is not a round disk as seen in the local disk galaxies. By comparing apparent axial ratio () distributions of the sBzK galaxies with those by assuming tri-axial model with axes , we found their intrinsic face-on ratios peak at and in the rest-frame UV and optical, respectively and are statistically more bar-like than that of the local disk galaxies. The intrinsic edge-on ratios in both rest-frame UV and optical wavelengths peak at 0.26, which is slightly larger than that of the local disk galaxies. Possible origins of this bar-like structure are bar instability, galaxy interaction, or continuous minor mergers. Study of galaxy structure evolution in cosmological simulations is desirable to examine the most likely scenario.
Subject headings:
galaxies: evolution — galaxies: formation — galaxies: high-redshift — galaxies: structure1. Introduction
Disk galaxy is one type of galaxies commonly seen in the present-day universe. Origin of the disk galaxy is, therefore, a crucial key to understand the galaxy formation and evolution. Observational studies suggest that disk galaxies already exist at . Despite some luminosity evolution up to (e.g., Scarlata et al. 2007), stellar surface mass density does not show significant evolution (Barden et al. 2005). Likewise, there is almost no significant evolution of disk galaxies seen in the stellar mass function (e.g., Pannella et al. 2009) and in the scale length function (e.g., Lilly et al. 1998; Sargent et al. 2007). These studies imply that the origin of disk galaxies is beyond . However, obvious counterpart of disk galaxies has not been identified at . Studies of Lyman break galaxies (LBGs) at reveal that most of the LBGs show surface brightness distribution consistent with Sérsic profile with Sérsic index around one (e.g, Steidel et al. 1996; Akiyama et al. 2008). Nevertheless, Akiyama et al. (2008) showed that the stellar surface mass density of the LBGs is too high to plausibly evolve into the local disk galaxies, suggesting that the LBGs at are more likely to be progenitors of the local elliptical galaxies. In addition, large clustering amplitude of the bright LBGs indicates that they reside in massive dark matter halo and are seemingly not a direct progenitor of the present-day disk galaxies (e.g., Giavalisco & Dickinson 2001; Ouchi et al. 2001).
At , galaxies can be efficiently selected by color selection (e.g., Steidel et al. 2004; Daddi et al. 2004). The clustering study of star-forming BzK (sBzK) galaxies, which are selected based on and color (Daddi et al. 2004), showed that faint sBzK galaxies ( mag) reside in dark matter halos with comparable mass to that of the local disk galaxies (Hayashi et al. 2007). Förster Schreiber et al. (2009) studied kinematic properties of 80 star-forming galaxies at through spectroscopic imaging observations of H emission and found that about 30% of their sample is rotationally supported with similar velocity-size relation to the present-day disk galaxies, albeit larger velocity dispersion. The results seem to imply that star-forming galaxies at are likely to be disk galaxies with thicker disk than the local disk galaxies. Unfortunately, the intrinsic shape of these galaxies at had not been studied yet to confirm the presumption.
The intrinsic shape of galaxies is related to distributions of their apparent axial ratios () and can be constrained by assuming a tri-axial model with axes (e.g., Ryden 2004; Padilla & Strauss 2008; Unterborn & Ryden 2008). Yuma et al. (2011, hereafter paper I) studied the intrinsic shape of sBzK galaxies in the GOODS-North field by using high-resolution imaging data obtained with the Advanced Camera for Surveys (ACS) camera on Hubble Space Telescope (HST). Among 1029 sBzK galaxies selected down to mag, 54% of them showed a single component in ACS/F850LP images, of which the effective wavelength corresponds to the rest-frame UV ( Å). Most of these single-component sBzK galaxies show surface brightness distribution with Sérsic indices of , suggesting that they have disk-like structure. Besides, they found that the sBzK galaxies largely distribute in the same region of the size-mass diagram as disk galaxies, suggesting a comparable stellar surface mass density. However, paper I found that the sBzK galaxies at apparently prefer a bar-like or oval shape rather than a round disk seen in the local disk galaxies. In case of the sBzK galaxies (paper I), the mean face-on axial ratio () is 0.61 and the mean disk thickness is 0.28, while they are and , respectively, for the local disks (Padilla & Strauss 2008; Unterborn & Ryden 2008). In other words, despite similar Sérsic index and comparable stellar surface mass density, the sBzK galaxies at statistically show a bar-like or oval intrinsic shape different from disk galaxies in the local universe that show a round and flat disk shape.
Although the conclusion about the intrinsic shape of sBzK galaxies is quite clear, some problems still remain for further investigations. The relevant problem is difference of effective wavelengths of the images used to derived the apparent between galaxies at and those at . The apparent of the sBzK galaxies in the GOODS-N field was determined in the ACS/F850LP images corresponding to the rest-frame UV wavelength where the luminosity is mainly dominated by star-forming activity. In contrast, studies of local galaxies were carried out in the optical wavelength, which is dominated by more evolved stellar component. Thus their structures can possibly be different. Recent morphological studies of galaxies at demonstrated that a galaxy may look different in different wavelengths (e.g., Cameron et al. 2011; Conselice et al. 2011). Conselice et al. (2011) studied the stellar-mass selected galaxies at and found that galaxies appearing peculiar in the rest-frame UV images often show compact morphology in the rest-frame optical images. Though this result is partially due to the resolution difference between images in two wavelength ranges, the morphologies of galaxies seem to be varied when observing in different wavelengths. Accordingly, it is important to study the intrinsic shape of galaxies in the rest-frame optical wavelengths. In this paper, we examine the intrinsic shape of sBzK galaxies at in GOODS-South and SXDS fields in both rest-frame UV and optical wavelengths. In addition to determine the difference in structure between two different wavelength ranges, this work increases at least twice the number of galaxies used to derive the intrinsic shape in both wavelengths, which improves the statistical significance of the determined shapes.
This paper is organized as follows. In Section 2, we provide an overview of the data sources and photometric catalogs of objects in both GOODS-South and SXDS fields. In Section 3, we describe how we determine the photometric redshifts and stellar properties of objects. Section 4 is given to a description of our sample selection method and counterparts of sBzK galaxies in high-resolution images. Section 5 presents structural analysis and accuracy of structural parameters. In Section 6, we present results of structural parameters, stellar surface mass density, and intrinsic shape of the sBzK galaxies derived in both rest-frame UV and optical wavelengths as well as the comparison between different wavelengths. In Section 7, we compare our results with those of the local disk galaxies and discuss possible scenarios for the origin of the intrinsic shape of the sBzK galaxies. Finally, we summarize our results in Section 8. We use a standard CDM cosmology of , , and km s-1 Mpc-1 and AB magnitude system.
2. Data Sources and Photometric Catalogs
2.1. GOODS-S
Data in the GOODS-South field were collected as a part of the Great Observatories Origins Deep Survey (GOODS)111http://www.stsci.edu/science/goods/. The optical /ACS data were taken from the v2.0 data products of the GOODS /ACS treasury program (Giavalisco et al. 2004). They consist of four band imaging data: F435W, F606W, F775W, and F850LP, hereafter referred to as the , , , and band, respectively. The images cover an area of arcmin2. The pixel scale of the images is 0.″030 pixel-1. The limiting magnitudes of the , , , and images at 1.″0 diameter aperture are 27.9, 27.8, 27,3, and 27.0, respectively. The and data were obtained with /VIMOS from the ESO/GOODS program (Nonino et al. 2009). The final and images in the area common to the GOODS /ACS observations reach limiting magnitudes of 28.61 and 28.06 mag, respectively (at 1.″0 diameter aperture).
The NIR /ISAAC data in , , bands were taken from the GOODS/ISAAC data release final version (2.0) (Retzlaff et al. 2010). The pixel scale of the ISAAC images is 0.″150, which is chosen so that one ISAAC pixel subtends exactly a block of ACS pixels. The images in each band consist of at least 24 sections222 There are two additional sections for and data. over the GOODS-S field with different seeing size varying from 0.″4 to 0.″6. The limiting magnitudes for point sources of , , and mag are reached within 75% of the survey area (Retzlaff et al. 2010). The mid-infrared (MIR) data were obtained from deep observations with the Infrared Array Camera (IRAC) on the Space Telescope (SST). We used 3.6µm and 4.5µm images from both DR1 and DR2 provided by the Legacy Science program. Limiting magnitudes of the 3.6µm and 4.5µm images are 24.3 and 24.4, respectively ( at 2.″4 diameter aperture). The effective area of the GOODS-S field we study is arcmin2.
In order to study the structural parameters of sBzK galaxies in the rest-frame optical wavelength, the high-resolution NIR image is necessary. At , the rest-frame optical wavelength (Å) is redshifted to µm, corresponding to the F160W band. We used the publicly available data from the Cosmic Assembly Near-Infrared Deep Extragalactic Legacy Survey (CANDELS; Koekemoer et al. 2011; Grogin et al. 2011) 333http://candels.ucolick.org/index.html. This survey consists of five fields, one of which is the GOODS-S field. The data were taken from data release v0.5 of both deep JH and wide JH subregions, covering about 70% of the ACS/GOODS-S field with 10 observing epochs. Limiting magnitude of the WFC3/F160W image (hereafter ) is depending on the observing epochs ( at 1.″0 diameter). The pixel scale is 0.″060 pixel-1.
2.2. SXDS
The deep multi-wavelength data in the SXDS/UDS field are also publicly available. The optical /Suprime-Cam images (, , , , and ) were obtained from the Subaru-XMM Deep Survey (SXDS; Furusawa et al. 2008) with the original pixel scale of 0.″202. limiting magnitudes at 2.″0 diameter aperture are 27.7, 27.2, 27.1, 27.0, and 26.0 mag for , , , , and , respectively. The NIR data are from DR8 version of the UKIDSS Ultra Deep Survey (UDS; Lawrence et al. 2007). The , , and images with the original pixel scale of 0.″268 were taken with WFCAM on . The limiting magnitudes are 24.9, 24.2, and 24.6 mag for , , and , respectively ( at 2.″0 diameter). The / IRAC images with the pixel scale of 0.″600 were obtained from the Public Legacy Survey of the UKIDSS Ultra Deep Survey (SpUDS; PI: J. Dunlop). The limiting magnitudes are 24.8 and 24.5 for 3.6µm and 4.5µm, respectively. We used the overlapped area of these data, which effectively covers deg2. The high-resolution NIR images (), which is used to study the galaxy structure, were taken from the CANDELS data release v1.0 covering central arcmin2 of the original SXDS. The limiting magnitude of the image is 27.1 mag for point sources. It is noteworthy that the CANDELS images in the SXDS are approximately one magnitude deeper than those we used in the GOODS-S field.
2.3. Photometric Catalogs
The photometric catalog was made by first selecting the objects in the ISAAC/ images and then making photometry in all images (except for WFC3 data) ranging from UV to MIR wavelength to construct spectral energy distribution (SED) of each object in the GOODS-S field. Due to seeing size difference among the ISAAC images, we first smoothed ISAAC/ images into one homogenous seeing size, i.e., 0.″6. The ACS/optical images were put into the same pixel scale as the ISAAC/NIR images by summing pixels of the original images and preserving the fluxes. The images were then smoothed to have the FWHM common to the -band images. Because of the dimension differences of images in different bands, objects were extracted separately above with 5 connected pixels by SExtractor (Bertin & Arnouts 1996). For the ACS images, aperture photometry was carried out separately in each band centering at the position extracted in band with 0.″8 diameter aperture, which provides the best signal-to-noise (S/N) ratio for the PSF homogenized images. The total magnitude of objects in ACS images was calculated from the aperture magnitude scaled up to the SExtractor’s MAG_AUTO in band. For VIMOS and ISAAC images, the total magnitude was obtained directly from MAG_AUTO of each object. For IRAC images, the total magnitude was calculated by using the aperture photometry at 2.″4 diameter and aperture correction. The correction factors were determined by generating the artificial objects with given total magnitudes and recovering their aperture photometry (paper I).
The photometric catalog of objects in SXDS is described by Yabe et al. (2012). The NIR images are aligned and homogenized to the optical images. Aperture photometry of objects in each image was made at the position extracted in the -band image by using dual-image mode in SExtractor with an aperture of 2.″0 diameter. Total magnitudes are calculated by applying the correction factor, which is determined by scaling the aperture magnitude to the MAG_AUTO in -band image, to the aperture photometry in each band. For the IRAC images, aperture photometry was carried out at 2.″4 diameter aperture and was corrected to the total photometry in the same manner as done in the GOODS-S field.
3. Photometric Redshifts and SED Fitting
The photometric redshift () of each object in both GOODS-S and SXDS fields was determined by using (Bolzonella et al. 2000). The observed spectral energy distributions (SEDs) of each individual object, which consist of photometry in and IRAC 3.6 and 4.5µm band, was fitted to the template SEDs covering E, S0, Sa-Sd, Im, and starburst types. The redshift range is set to be with a step of . The obtained was compared with the available spectroscopic redshift catalogs in both GOODS-S (Popesso et al. 2009; Balestra et al. 2010) and SXDS/UDS (Simpson et al. 2011, inprep.; Akiyama et al. 2011, in prep.; Smail et al. 2008). Although there are catastrophic redshift outliers, the is mostly consistent with the with uncertainties (standard deviation of ) of 0.05 and 0.03 in GOODS-S and SXDS/UDS, respectively.
Stellar mass, star formation rate (SFR), age, and color excess (E(B-V)) of objects in the catalogs were obtained from SED fitting with the standard minimization. The SED fitting was performed by using the SEDfit program (Sawicki 2012), which is the evolved version of the SED fitting program used in (Sawicki & Yee 1998). The main differences are that the new version uses Calzetti et al. (2000) law instead of the Calzetti (1997) and the population synthesis model by Bruzual & Charlot (2003) instead of those by Bruzual & Charlot (1993). BC03 population synthesis code (Bruzual & Charlot 2003) was used to construct the model SEDs with various star formation histories (instantaneous burst, exponential declining SF, constant SF). The Salpeter initial mass function (IMF; Salpeter 1955) with the mass range of and metallicity of 1.0 were assumed.444Metallicity of most star-forming galaxies at is slightly lower than solar abundance; or larger for galaxies (e.g., Hayashi et al. 2009; Yoshikawa et al. 2010; Wuyts et al. 2012). Here we adopted the 1.0 model rather than the 0.2 model. The dust attenuation law by Calzetti et al. (2000) was adopted with range of mag (0.02 mag step) and the redshift was fixed to the determined by to reduce the number of free parameters. The uncertainty is obtained based on Monte Carlo simulation at 68% confidence level. The median uncertainties for derived stellar masses are dex and 0.38 dex for samples in GOODS-S and SXDS, respectively.
 |
 |
 |
 |
4. Sample Selection
4.1. Star-Forming BzK Galaxies
Star-forming galaxies at were selected by applying the BzK selection method (Daddi et al. 2004) to the photometric catalogs described above down to mag. Because the response functions used in this paper are not identical to those used by Daddi et al. (2004), the color corrections were determined in both GOODS-S and SXDS field. The stellar spectra by Pickles (1998) were convolved with the response functions including the detector’s quantum efficiency and atmospheric transmission. Both and colors derived from filter system used in the GOODS-S are not significantly different from those by Daddi et al. (2004). Thus no correction is required for the GOODS-S field. In contrast, we adopted the color corrections for the SXDS field as follow:
| (1) | |||||
| (2) |
Then the original sBzK criterion, , was applied to construct the sBzK samples in both fields. The candidates with and were excluded from the samples. Eventually, we have 1028 and 29835 sBzK galaxies in GOODS-S and SXDS, respectively.
 |
 |
 |
 |
4.2. Cross-Identification with Images
4.2.1 ACS/F850LP
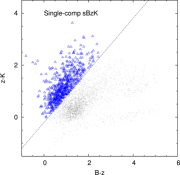
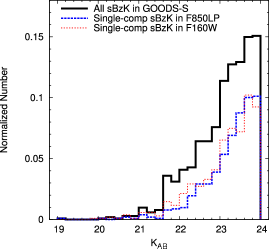
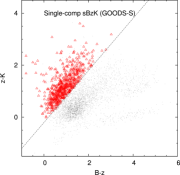
In order to verify the intrinsic shape of sBzK galaxies in the same rest-frame UV wavelength as in the GOODS-N field (paper I), we used the images that are publicly available in the GOODS-S field. In section 2, we constructed the photometric catalog of objects selected in -band images by using the smoothed ACS images. However, we also need to identify galaxies using high-resolution images in order to study structure of galaxies. The sBzK galaxies are re-identified in the original image, which corresponds to rest-frame Å. An object in the images is identified as a BzK counterpart if it is detected above threshold with 5 connected pixels in SExtractor and locates within 1.″0 radius centered at the sBzK position in band. Similar to paper I, the radius was chosen as it is twice of the median FWHM of the samples in images. The sBzK galaxies are divided into 2 groups: the single-component and the multiple-component sBzKs, depending on the number of their counterparts within the radius. 583 (57%) sources are identified as single-component sBzK galaxies, while the multiple-component sample contains 438 galaxies including six objects (3 pairs) of (interacting) sBzK galaxies. Note that the ratio of single-component sBzK galaxies is in agreement with that (54%) in GOODS-N (paper I). The contamination rate of forground/background galaxies within 1.″0 radius is estimated to be 14% for the image. As we select the single- and multiple-component galaxies in both and images, we explicitly denote the single-component sBzK galaxies in the images as the single- galaxies and the multiple-component sBzK galaxies in the images as the multiple- galaxies to avoid any confusion. Figure 1 shows BzK diagrams of the single- and multiple- sBzK galaxies in the images. Distributions of both single- and multiple- sBzK galaxies are almost the same. They show similar distribution to the whole sBzK sample in the GOODS-S field as well. A histogram of magnitude of the single- sBzK galaxies is shown in the left panel of Figure 2 together with the histograms of all sBzK galaxies. The figure shows that the single- galaxies similarly distribute in the magnitude range of mag as compared to the total sample in the field. The total number of the sBzK galaxies that are able to be identified to either single or multiple components in the high-resolution images is 1021 out of all 1028 objects in the GOODS-S field. The remaining seven candidates are too faint to be detected in the original images, though they were detected in the -band homogenized images, which were used in the sBzK selection process.
| GOODS-S | SXDS | |||
|---|---|---|---|---|
| Type of sBzK | aa The number of all sBzK galaxies detected in the original images is 1021, which is not identical to the number of all sBzK in GOODS-S field (i.e., 1028). This is because the sBzK galaxies were selected based on the images homogenized to match PSF of the -band images instead of the original images (see text). | -smoothed | ||
| Single-component | 583 () | 718 () | 626 () | 2044 () |
| Multiple-component | 438 () | 310 () | 98 () | 456 () |
4.2.2 WFC3/F160W
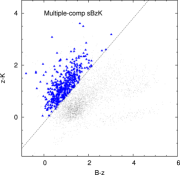
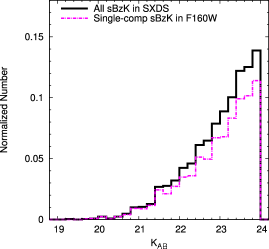
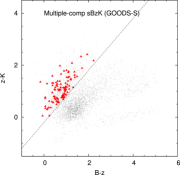
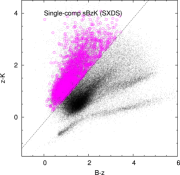
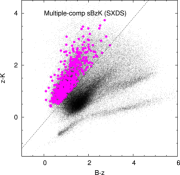
The high-resolution WFC3/F160W () images are used in order to determine the structure of the sBzK galaxies in the rest-frame optical wavelength range. The images have the effective wavelength corresponding to the rest-frame Å at . We applied the definition identical to that used for the ACS/F850LP images in order to classify the single or multiple components, i.e., the sBzK counterparts in the high-resolution images are identified if being detected above and 5 connected pixels within 1.″0 radius from the sBzK center. 626 (86%) single-component and 98 multiple-component sBzK galaxies are obtained in the GOODS-S, and we have 2044 (82%) single-component and 456 multiple-component galaxies in the SXDS. Note that because the WFC3/F160W data are not available for the whole area of the GOODS-S and SXDS fields, only some fractions of the sBzK galaxies are used in this paper. The contamination rate for the images is 7% within 1.″0 radius. Although most of sBzK galaxies located in the images (%) are classified as a single component in both fields, the single-component fraction somehow does not agree to each other within uncertainty555, where denotes the fraction and is for number of the sample., i.e., for GOODS-S and for SXDS. However, they are still in agreement with each other within range. We refer to the single- and multiple-component sBzK galaxies in the images as the single- and the multiple- sBzK galaxies, respectively. The BzK diagrams of both single- and multiple- sBzK galaxies in both fields are illustrated together with the whole sBzK sample in Figure 3. The single- sBzK galaxies in both fields seem to show similar distributions in the BzK diagram as compared to the entire sample of sBzK galaxies. -band magnitude histograms of the single- sBzK galaxies in GOODS-S and SXDS are shown in the left panel (red dotted) and right panel (magenta dot-dashed) of the Figure 2, respectively. Histograms of the single- galaxies in both fields are similar to those of the whole sBzK galaxies shown in the black solid lines. These imply that the single- sBzK galaxies can be good representatives for the entire populations at least in term of their colors and rest-frame optical magnitudes.
4.2.3 High Fraction of Single-Component sBzK Galaxies in WFC3/F160W
As described above, the sBzK galaxies are categorized as single-component or multiple-component galaxies according to their appearance in the high-resolution images both in the rest-frame UV () and the rest-frame optical () wavelengths. In the GOODS-S field where high-resolution images are available in both rest-frame UV and optical wavelength, 57% of all sBzK galaxies are identified as single- galaxies, while 86% of the galaxies located in the images are the single- samples. There are two plausible reasons responsible for the difference in fraction of single-component objects in different wavelengths. The first reason is the difference in the resolution of images between in and in bands. The images have about two times better resolution than the images; FWHM of the PSF in and images are 0.″1 and 0.″18, respectively. The second reason is that the difference is real. The rest-frame UV component of a galaxy is mainly dominated by star-forming activity, whereas the relatively low-mass, long-age stellar component tends to dominate the rest-frame optical wavelengths. Consequently, components of one galaxy seen in the rest-frame UV (i.e., ) are possibly just the star-forming regions in the galaxy, not the entire galaxy.
In order to examine which reason is responsible for this different fraction, we first smoothed the original image to the resolution. Then we re-detected and re-selected the single-component and multiple-component sBzK galaxies from the -smoothed images. The number and percentage of the single- and multiple-component sBzK galaxies are summarized in Table 1. As seen in the table, fraction of the single- galaxies increases significantly after homogenizing the images to match the PSF of the images; however, the fraction is still less than that for the single- sample. The results indicate that the difference in appearance of sBzK galaxies between in the rest-frame UV and optical wavelength is partially due to the difference in resolution of images obtained with ACS and WFC3. On the other hand, more than half of the single- galaxies seen as multiple components in the images indicate real difference between the morphology of galaxies in the rest-frame UV and that in the rest-frame optical wavelength.
5. Structural Analysis
We carried out the structural analysis in the same process as done in paper I. Briefly, the structural parameters of the sBzK galaxies are obtained by fitting their two-dimensional surface brightness distributions in or images with a single Sérsic profile (Sérsic 1963; Sersic 1968) using GALFIT version 3.0 (Peng et al. 2010). The Sérsic profile is formulated by , where is surface brightness at an effective radius and is a variable parameter coupled with Sérsic index so that covers half of the total flux. The de Vaucouleurs and exponential profiles are special cases of the Sérsic profile when and , respectively. Seven free parameters of each object, i.e., position (x, y), magnitude, , , axial ratio (), and position angle (PA), are determined by minimization. Initial values of all parameters are given from SExtractor outputs, except for the Sérsic index which is initially set at . As explained in paper I, the GALFIT results do not significantly depend on the initial Sérsic index. Sigma images required for calculating the and fitting errors are constructed from variance maps produced during the reduction process.
| Number of sBzK galaxies (After/before GALFIT)aa The objects before GALFIT are those used in GALFIT process. The objects after GALFIT are those with and errors within 30% of the derived parameter values. | ||
|---|---|---|
| Observed Fields | Single- | Single- |
| GOODS-S | 467/573 (82%)bb Although there are 583 single- sBzK galaxies, 10 of them are at the image edge which cannot be used to study the structural parameters. | 550/626 (88%) |
| SXDS | cc The ACS/F850LP images are not available in the SXDS field. | 1878/2044 (92%) |
 |
 |
 |
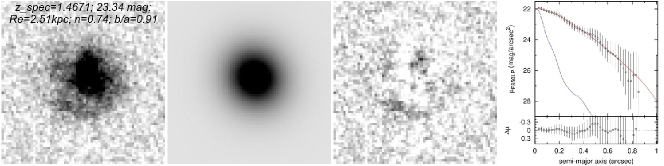
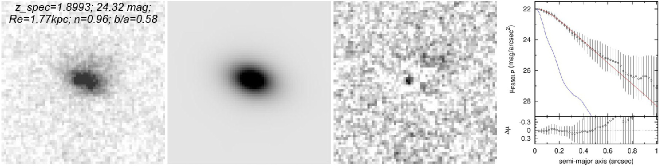
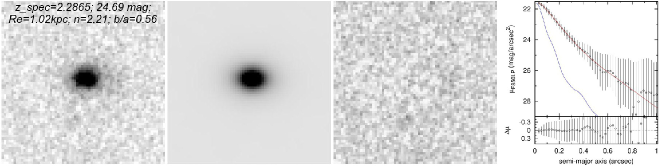
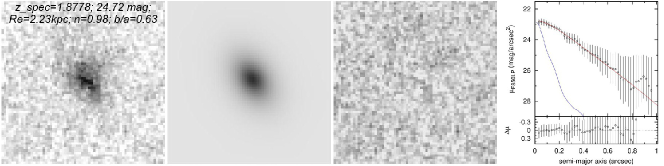
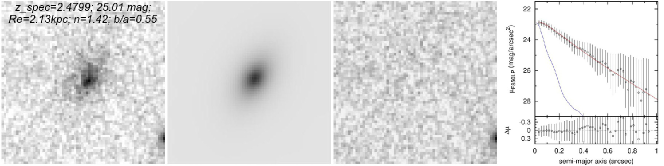
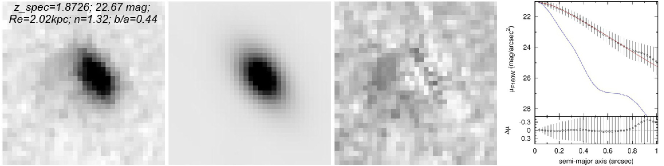
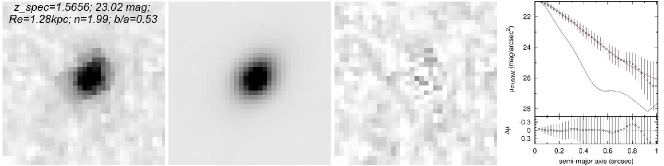
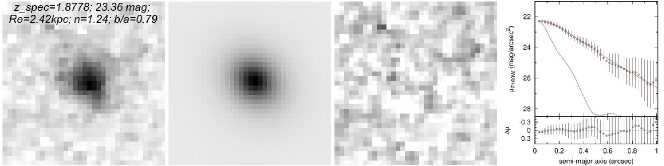
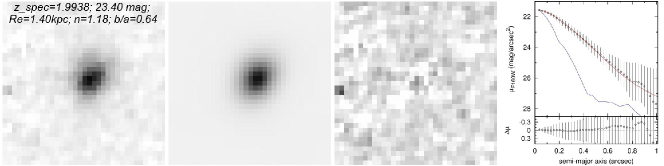
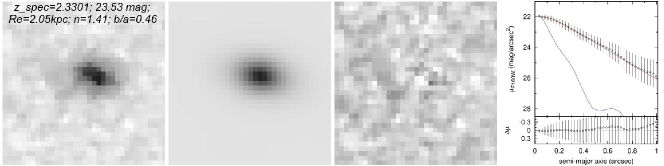
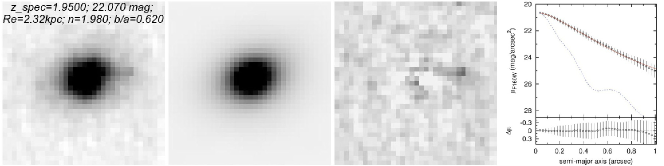
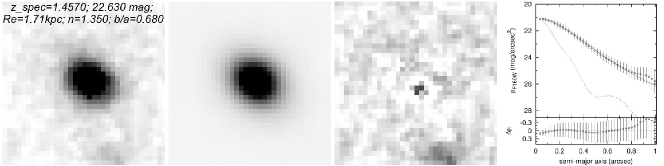
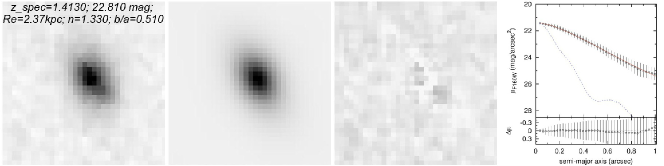
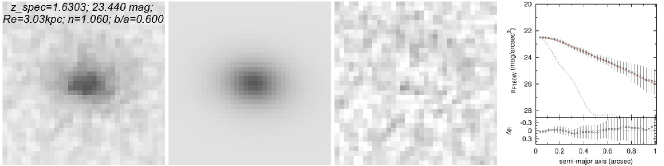
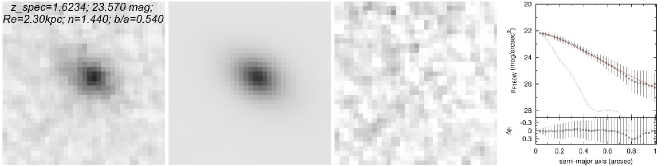
The analysis was executed for all single-component sBzK samples, i.e., the single- & single- sBzK galaxies in the GOODS-S and the single- sBzK galaxies in the SXDS. We excluded objects with larger than one and containing inconvincibly large fitting uncertainties, i.e., objects with parameter errors more than 30% of the parameter values. The excluded galaxies are mostly too faint to obtain reliable results. The resultant numbers of sBzK galaxies left after GALFIT analysis are listed in Table 2. Over 80% of the single-component sBzK galaxies in both fields show good fitting results of GALFIT. Examples of the GALFIT results are demonstrated in Figures 4, 5, and 6, for the single-, single-sBzK galaxies in the GOODS-S and the single- sBzK in the SXDS, respectively. The figures show the observed images, best-fitting models, and residuals, along with one-dimensional light profile visualizing the agreement between the observed and modeled profiles.
5.1. Accuracy in Determining Structural Parameters
In paper I, we carried out the Monte Carlo simulations to examine the accuracy of the derived structural parameters in the images in GOODS-N field and found that the estimation of Sérsic index becomes less reliable at mag. The effective radii derived for disk profiles are robustly recovered down to mag and more accurate than those in the spheroid case. Since the images in the GOODS-S are 0.5 mag deeper than those in the GOODS-N, we conservatively assume the same accuracy as estimated in paper I.
 |
 |
 |
In case of the images, we separately generated artificial objects in both GOODS-S and SXDS with random magnitude, effective radius, ellipticities, and position angles of mag, 0.″11.″0, , and , respectively. The ranges of the input parameters were chosen to be the same as those of the sBzK galaxies. The artificial objects, which are equally constructed for disks () and spheroids (), were convolved with PSF of images and inserted into the original images. Then we performed the GALFIT and selected the good fits in the identical way to that used for the sBzK galaxies; i.e., and errors %. The percentages of successful fittings for the artificial objects in both GOODS-S (86%) and SXDS (92%) fields are very similar to those for the single- sBzK galaxies (Table 2).
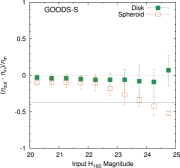
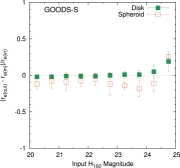
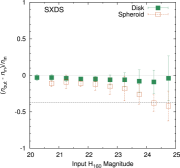
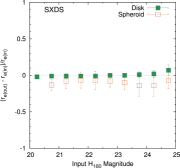
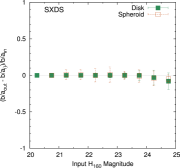
Figure 7 shows the accuracy in determining the structural parameters from Monte Carlo simulations in the GOODS-S field by GALFIT program along with distributions of the recovered structural parameters. The left panel shows the Sérsic index accuracy of both disk-like (; green solid square) and spheroid-like (; orange open square) artificial objects. It is shown that the recovered Sérsic indices are systematically underestimated in most cases. It is not significant in case of simulated disks; the median difference between the input and recovered Sérsic indices is no more than 10% at all magnitude ranges. In contrast, the Sérsic index estimation for the simulated spheroids becomes less accurate at fainter magnitudes; their recovered Sérsic indices go below at mag. In other words, we are able to distinguish the disk-like sample from the spheroid based on the Sérsic index criterion down to mag in the GOODS-S. Similar to the simulations made in the images (paper I), the effective radius of a disk profile is better recovered than that of the spheroid one. The middle panel shows that the effective radii of the simulated disks are well recovered down to the faint magnitudes; however, they are systematically underestimated in case of spheroid about except for the faintest magnitude bin. However, this underestimation is not severe as we show in the next section that most of our samples are disk-like, of which the effective radii can be accurately recovered. The other important parameter that we obtain from GALFIT is the apparent axial ratio (), which will be used later in determining the intrinsic shape of the galaxies. The resulting accuracy in determining the is shown in the right panel of Figure 7. The ratios are robustly recovered in both types of profiles down to mag, at which the recovered begins to be underestimated.
Similarly, the accuracy in recovering the structural parameters of the artificial objects inserted in the SXDS is summarized in Figure 8. The simulations performed in both GOODS-S and SXDS fields show the similar accuracy in all parameters over most of the magnitude range. However, as the images in the SXDS are about one magnitude deeper than those in the GOODS-S, the accuracy calculated at the faintest magnitude bins (i.e., mag) in the SXDS is roughly better than that in the GOODS-S. The Sérsic indices (left panel) are generally underestimated in both disk and spheroid profiles, but negligible (%) in the disk case. The figure shows that the disk-like and spheroid profiles are accurately distinguishable down to mag. Similar to the GOODS-S, the middle panel indicates that the effective radii are robustly derived in the disk profile, while they are averagely underestimated in the case of spheroids. The axial ratios are accurately determined in both profiles over the magnitude range as seen in the right panel of Figure 8.
Surface brightness of galaxies can be different due to their inclination; edge-on galaxies tend to show higher surface brightness than the face-on galaxies at the same total magnitude. The sample selection can possibly be biased toward edge-on galaxies, which consequently results in lower a peak of distribution. This selection bias was already tested in paper I by generating artificial objects with the random inclination angles (axial ratios) and uniformly distributed magnitudes of mag in the -band image. Their effective radii were assumed to be in the same range as the observed galaxies selected from the image at each magnitude bin. They found that the detection rate remains constant above 95% regardless of inclination angle or axial ratio down to mag (Figure 10 in paper I). For the faintest magnitude bin ( mag), the detection rate reaches 100% at (edge-on case) and then becomes constant at from to , which is a face-on case. Therefore, there seems to be no significant bias toward selecting mostly edge-on galaxies. As we use the same mag limit as that in paper I, we assume that brighter surface brightness of edge-on galaxies does not cause any bias on our sample selection.
 |
 |
 |
 |
6. Results
6.1. Structural Parameters
6.1.1 GOODS-S
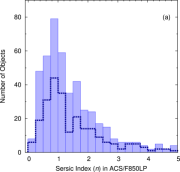
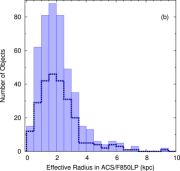
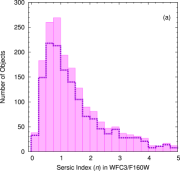
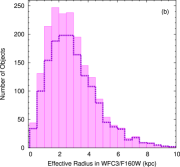
In this section, we present results of GALFIT of the single- and the single- sBzK galaxies in the GOODS-S field. Distributions of the derived Sérsic indices and effective radii are shown in Figure 9. The effective radii are indicated in the unit of kpc calculated by assuming the photometric redshift or spectroscopic redshift (if available) of each object. In the figure, we also show the histograms for the brighter sample; galaxies with mag (top panels) and mag (bottom panels). It is seen in Figure 9 (a) that most of the single- sBzK galaxies have regardless of the magnitude limit. The median for all and the brighter single- sBzK galaxies are the same at . Figure 9 (b) shows that the effective radii of most single- galaxies are in the range of kpc, regardless of magnitude limit. The median are 1.89 and 1.91 kpc for all single- galaxies and the brighter samples, respectively.
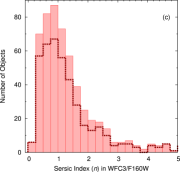
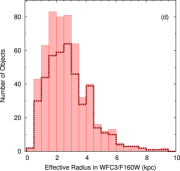
Figures 9 (c) and (d) show the and histograms for the single- sBzK galaxies. Similar to those in the images, the Sérsic indices of the single- sBzK galaxies mostly distribute around with the median values of and for all samples and those with mag, respectively (Figure 9 (c)). Figure 9 (d) shows that the effective radii of the single- galaxies are typically around kpc. The median for all single- sBzK galaxies is kpc, similar to the median of kpc for the brighter sample.
We performed Kolmogorov-Smirnov (K-S) tests to the and distributions of all and the brighter sample and found that we could not reject the null hypothesis that the and histograms of both samples are drawn from the same populations at more than confidence levels. We need to use as large number as possible of the sBzK galaxies in order to determine their intrinsic shape with sufficient statistical accuracy. Since the distributions of both and are consistent regardless of the magnitude limit, we keep using the whole samples of both single- and single- sBzK galaxies to determine the intrinsic shape in section 7. We divide the sBzK galaxies into disk-like and spheroid-like samples according to their Sérsic index. The disk-like galaxies are those with Sérsic indices of , whereas the spheroid ones are those with . In both cases of the single- and single- sBzK galaxies, majority of them (72%) are similarly classified as disk-like galaxies.
 |
 |
6.1.2 SXDS
We illustrate the histograms of the Sérsic indices () and the effective radii () of the single- sBzK galaxies in Figures 10 (a) and (b), respectively. Figure 10 (a) shows that the single- sBzK galaxies in the SXDS mainly have the Sérsic indices of in both all and the brighter sample. The median values of both samples () are very close to those obtained in GOODS-S. Using the same criteria as those in the GOODS-S, we categorized 67% of our all single- sBzK galaxies in the SXDS as the disk-like sample. Figure 10 (b) also shows that the effective radii range between and kpc in both cases. The median of the whole sample is kpc, which is similar to that of sBzK galaxies (median kpc) and almost equal to those in the GOODS-S (median kpc).
 |
 |
 |
 |
6.1.3 Comparison between the Rest-frame UV and Optical Wavelengths
As mentioned in section 1, a star-forming galaxy may have different structure when being observed in different wavelengths. Star-formation activity probably dominates the rest-frame UV structure; therefore, studying the rest-frame optical structure is crucial to understand the galaxy morphology in the wavelength where more evolved stellar component dominates. In this section, we compare the structural parameters obtain from GALFIT between the rest-frame UV and optical wavelengths. Comparison of Sérsic indices and effective radii of the single-component sBzK galaxies between in rest-frame UV and optical wavelengths in the GOODS-S field is shown in Figure 11. Top left panel shows the Sérsic index comparison for the galaxies detected in both and images. It is important to note that there are 296 galaxies that are detected as a single component in both images. Sérsic indices derived from both wavelength ranges of most galaxies are in agreement with each other. scatter of Sérsic index ratio () is . Similar comparison but for the effective radius is shown in the top right panel. The effective radii derived in both wavelength range seem to be almost equal with little scatter.
Bottom panels show histograms of all single-component sBzK galaxies detected in either or images. The bottom panel shows that the Sérsic index distributions of the sBzK galaxies in both wavelengths are averagely very similar and their median values are comparable with slightly larger Sérsic index in the rest-frame UV wavelength. The median Sérsic indices are 1.17 and 1.09 in the rest-frame UV and rest-frame optical wavelengths, respectively. Histogram of the effective radii is shown in the bottom right panel. The effective radii of all single- galaxies distribute in narrower range and are apparently smaller than those of all single- samples. Their median values are 1.89 and 2.52 in the rest-frame UV and optical wavelengths, respectively. The ratio of median in rest-frame optical to that in rest-frame UV is 1.33, which agrees well with the ratio of 1.37 found in the star-forming galaxies at the similar redshifts (BM/BX and LBGs) by Swinbank et al. (2010). The effective radii in the rest-frame optical wavelength are also roughly in agreement with those derived for the sBzK and BM/BX galaxies at the same redshift by Overzier et al. (2010) and Mosleh et al. (2011), respectively. It suggests the similar structures between the sBzK galaxies and the BM/BX or LBGs at .
The ratio of median seems to contradict with the comparison for individual galaxy that appears as a single component in both wavelength range (57% of all single- sBzK; top right panel) with the median of 1.0. This is mainly because the galaxies with larger effective radii in the image appear as multiple components in the image; of all single- sBzK galaxies are those classified as multiple- galaxies and almost all of them have larger than the median . It is worth to recall that higher fraction of single- sBzK against the single- sBzK galaxies are partly due to the poorer resolution in the WFC3/F160W image as compared to the ACS/F850LP.
6.2. Stellar Surface Mass Density
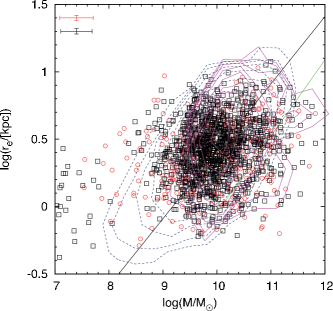
Figure 12 shows the size-mass relation of the single- sBzK galaxies with in both GOODS-S and SXDS fields and local galaxies. Because we derived the effective radii of the sBzK galaxies in the images (i.e., the rest-frame optical images), the size-mass relation of the sBzK galaxies is able to be directly compared with the relation of galaxies in the local universe, where the effective radii were measured in optical wavelengths. The stellar masses of local galaxies were corrected into Salpeter IMF with dex depending on colors (Akiyama et al. 2008; Rudnick et al. 2003). As seen in the figure, most of the sBzK galaxies with locate in the same region as the local disk and disk galaxies locate. The result is similar to what we found for the single-component sBzK galaxies in GOODS-N (paper I), confirming that the sBzK galaxies at have comparable stellar surface mass density to the disk galaxies at . However, there are some outskirts that show larger surface mass density, which are closer to the typical values of the local elliptical galaxies (green line; Shen et al. 2003). Note that the galaxies with stellar mass of are those with the estimated lower than 1.4.
 |
 |
6.3. Axial Ratio Distribution and Intrinsic Shape of sBzK Galaxies
Although we found that the sBzK galaxies in both wavelengths show the Sérsic indices around one and have stellar surface mass density comparable to disk galaxies at , it is still important to see whether or not their structure is a round disk as seen in the local disk galaxies. Since the intrinsic shape of galaxies can be statistically examined from their observed distributions of apparent axial ratios (), we show the distribution and the resulting intrinsic shape of the sBzK galaxies in this section.
6.3.1 Rest-Frame UV in GOODS-S
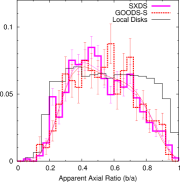
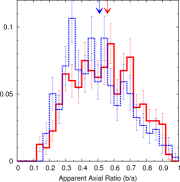
Histograms of the apparent of the single- galaxies with in GOODS-S and GOODS-N fields (paper I) are shown in the left panel of figure 13. Distribution of local disk galaxies by (Padilla & Strauss 2008, in SDSS) is also shown. The distribution of samples in GOODS-S peaks at and declines significantly toward . This trend agrees with that found in GOODS-N. We performed the K-S test and found that distribution of the single- sBzK galaxies are drawn from the same distribution with confidence level. However, they are obviously different from the distribution of the local disk, which is relatively flat in the range of . It is implied that structure of the sBzK galaxies in the rest-frame UV differs from that of the local disks.
| Parameter | Minimum Value | Maximum Value | Step |
|---|---|---|---|
| ()aa The corresponding is written in the parenthesis. | (0.98) | (0.1) | 0.15 |
| 0.20 | 2.00 | 0.15 | |
| 0.10 | 0.98 | 0.02 | |
| 0.01 | 0.35 | 0.02 |
In order to study the intrinsic shape of galaxies, a tri-axial model is adopted with axes . The face-on ellipticity () is assumed to be described by lognormal distribution with mean and dispersion , while the edge-on thickness () is described by Gaussian distribution with mean and standard deviation . One set of these 4 parameters provides one apparent- distribution after repeatedly computing the apparent at various random viewing angles. The parameters , , , and were constrained by comparing the model distributions of with those of the observed samples. The ranges and steps of the parameters are summarized in Table 3. The best-fitting parameter set was obtained by minimization method. The observed distribution was first compared with the above parameter sets to obtain the primary result. Then we refitted the observed distribution with parameter set with finer grid (at least half of the current step) centered at the primary best-fitting result. The fitting uncertainties are calculated at 68% confidence level based on Monte Carlo realization. We derived the best-fitting set of parameters and repeated the process 500 times by varying the observed distribution of ratios within their Poisson noises.
| Rest-Frame Wavelength | Field | ||||
|---|---|---|---|---|---|
| UV ( image) | GOODS-S | ||||
| GOODS-Naa Yuma et al. (2011, paper I) | |||||
| GOODS-NS | |||||
| Optical ( image) | GOODS-S | ||||
| SXDS | |||||
| GOODS-S SXDS | |||||
| Local Disks (-band image)bb Padilla & Strauss (2008). | SDSS DR6 |
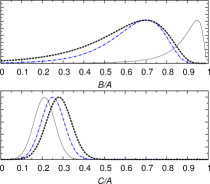
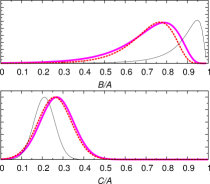
The final best-fitting results of the single- sBzK galaxies in GOODS-S are summarized in Table 4. For comparison purpose, we also show the results of the single- galaxies in GOODS-N by paper I in the table. Distributions of the best-fitting parameters are also shown in right panel of Figure 13. The peak (i.e., mode) of the distribution is determined from and parameters, while and parameters corresponds to a peak and width of the distribution, respectively. The single- galaxies in GOODS-S show similar distribution to those in the GOODS-N with a slightly larger width of GOODS-N sample (top right panel of Figure 13). The best-fitting of the single- galaxies in GOODS-S is , consistent with that in GOODS-N within (). Although a slightly larger best-fitting in the GOODS-N samples, the parameters of the samples in both fields are well in agreement with each other within confidence level (Table 4). The bottom right panel of Figure 13 shows the slightly different distributions of the intrinsic edge-on ratio of the single- galaxies between in GOODS-S and in GOODS-N. However, their best-fitting and , which correspond to distribution, agree well to each other within uncertainties. This indicates that the sBzK galaxies in both GOODS-S and GOODS-N are not round () and seem to be flat (mean ) when being observed in rest-frame UV wavelength.
Since the intrinsic shapes of the single- sBzK galaxies in both GOODS-S and GOODS-N fields are consistent with each other, we combined the samples together and re-derived the intrinsic shape in order to improve the statistics. The fitting results are shown in Table 4. The best-fitting parameters are similar to those determined in the separated fields but with smaller range of uncertainties. The results confirm that the sBzK galaxies that appear as a single component in the rest-frame UV wavelength show a flat (peak ) and bar-like/oval shape (peak ).
 |
 |
6.3.2 Rest-Frame Optical in GOODS-S and SXDS
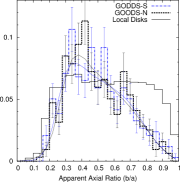
Thanks to the publicly available data from CANDELS survey, we are able to study the structure of sBzK galaxies at in the rest-frame optical wavelength. The apparent histograms of the single- sBzK galaxies in GOODS-S and SXDS are shown in the left panel of Figure 14. The distributions of samples in both fields look similar to each other; however, the K-S test indicates that these two histograms are drawn from different distribution. In any case, the distributions roughly seem to be flat from to and decline continuously toward . The distributions of the single- sBzK galaxies are still different from those of the local disk galaxies, which is also shown with the black solid line in the figure. Law et al. (2012) also studied the rest-frame optical morphologies of star-forming galaxies at and showed the histogram that peaks at . Their histogram seems to be similar to that of the sBzK sample in GOODS-S.
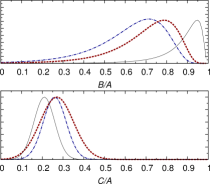
We determined the intrinsic shape of the single- sBzK galaxies in the identical manner as done for the single- samples. The fitting results are summarized in Table 4. The best-fitting parameters are also shown in the right panels of Figure 14 as and distributions. Despite statistically significant difference of the distribution, the best-fitting of the single- sBzK galaxies in both fields are the same at . Meanwhile, slightly different parameters result in different distribution as seen in the top right panel of Figure 14. The best-fitting value of samples in GOODS-S is still consistent with that in SXDS within 68% uncertainty. The distributions of the sBzK galaxies in both fields show almost the same peak with the same width, since they have comparable and values.
Because the intrinsic shapes derived separately in GOODS-S and SXDS are well in agreement with each other within uncertainties, we combined the samples and re-derived the intrinsic shape to increase the statistical significance. Fitting results of the combined samples are listed in Table 4. The peak and ratios of the combined samples are 0.79 and 0.27, respectively, indicating that the sBzK galaxies are indeed not round even when observing in the rest-frame optical wavelength. The best-fitting parameters of the combined samples are identical to those of the single- galaxies in SXDS alone. This is presumably due to the fact that number of the single- sBzK galaxies in SXDS is approximately three times larger than that in GOODS-S.
 |
 |
 |
 |
6.3.3 Comparison between Rest-Frame UV and Optical Wavelengths
In this section, we discuss the structural difference between in the rest-frame UV and in the rest-frame optical wavelength in terms of the apparent axial ratios (). The comparison of sBzK galaxies that appear as a single component in both wavelengths in the GOODS-S is shown in Figure 15. The left panel shows that most objects show larger ratios in the rest-frame optical wavelength ( images) than those in the rest-frame UV ( images), though some show the same or even lower ratios in the rest-optical images. The comparison of histograms is illustrated in the right panel of the figure. It is seen that the histogram is slightly different at in the way that larger fraction of the sBzK galaxies in the rest-frame optical wavelength shows ratios more than 0.5. The median value in the rest-frame optical images () is also larger than that in the rest-frame UV (). This difference may result in the difference in the derived intrinsic shape of the sBzK galaxies.
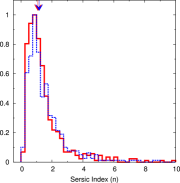
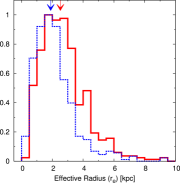
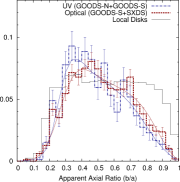
We investigate the difference of the intrinsic shape of sBzK galaxies between in the rest-frame UV and in the rest-frame optical wavelengths by using the combined samples in both wavelength ranges, i.e., the single- galaxies in GOODS-S and GOODS-N for rest-frame UV and the single- galaxies in GOODS-S and SXDS for rest-frame optical, to improve statistical significance. Their histograms are shown in the left panel of Figure 16 along with those of the local disk galaxies by Padilla & Strauss (2008). Similar to what we found in the GOODS-S, the distribution of the sBzK galaxies observed in the rest-frame optical wavelength shows a slightly larger fraction at than those in the rest-frame UV wavelength. Comparing the histograms with those of the local disks, we even see more difference of the histograms at . In paper I, they discussed that difference in histogram results in difference in the intrinsic shape (Figure 12 in paper I). The histogram at affects the intrinsic face-on shape, mainly the parameters. Higher fraction at histogram indicates rounder face-on shape. The effect can be seen in the right panel of Figure 16; the top right panel shows the intrinsic distributions derived for the sBzK galaxies in the rest-frame UV and optical wavelengths. The ratio of the single- sBzK galaxies peaks at , which is different from that of the single- sBzK galaxies more than uncertainty. The same trend of dramatically increase at of the histograms results in the similar for the samples in both wavelength ranges, whereas some excess fraction at in the rest-frame UV sample causes difference in the derived parameters. Their best-fitting are similar at or peak of , whereas wider distribution can be seen in the single- galaxies (bottom right panel) due to slightly larger . However, they are still in agreement within confidence level. In conclusion, as seen in the right panel of Figure 16 and Table 4, the sBzK galaxies appearing as a single component in rest-frame UV show just slightly different or intrinsic face-on shape as compared to those in rest-frame optical wavelength with similar or intrinsic edge-on distribution.
| Rest-Frame Wavelength | Subsamples | ||||
|---|---|---|---|---|---|
| (Observed Field) | |||||
| UV (GOODS-S&N) | All single- | ||||
| mag | |||||
| Optical (GOODS-S+SXDS) | All single- | ||||
| mag | |||||
6.4. Apparent Distribution and Intrinsic Shape of Subsamples
6.4.1 Rest-Frame UV in GOODS-S and GOODS-N
In this section, we discuss the dependence of apparent distribution (if any) on various properties of the sBzK galaxies. As described in section 6.3.1, the distribution of the single- sample in both fields are drawn from the same distribution and their best-fitting shape parameters agree well within 68% confidence level. Besides, the images in both fields have almost the same depth. Therefore, we combined together the sample from both fields to increase the statistics. Figure 17 shows histograms of subsamples of the single- sBzK galaxies in GOODS-S and GOODS-N. As described in section 5.1 and also in paper I, the Sérsic index can be derived accurately down to mag in the images, but we used the single- galaxies of which magnitudes reach mag in order to increase the number of samples. Thus we made a subsample of galaxies with mag to investigate the shape difference as compare to the whole sample. Figure 17(a) shows the apparent distributions of both mag and the whole samples of single- galaxies. The distributions of both samples are close to each other in the way that the histogram of sample shows a peak at and gradually declines until . We also derived the intrinsic shape parameters for subsamples and summarized in Table 5. The derived intrinsic shape for the brighter subsample agrees well with that of the whole sample within 68% confidence level. Figure 17 (b) shows the very similar histograms between the whole sample and subsample, while the histogram of the subsample is little fuzzy. Their best-fitting parameters in Table 5 are still in agreement within uncertainty, suggesting that diving the single- galaxies into subsamples of and does not affect the statistical results of the intrinsic shape. It is interesting to note here that sBzK subsample with shows different distribution. The K-S test of two distributions between the whole sample () and the subsample results in , meaning that we can reject the null hypothesis that they are drawn from the same populations with 2% significance level. Their histogram peaks at and has a lower fraction at , resulting in larger disk thickness but comparable face-on shape () as compared with sample.
Figure 17 (c) shows the comparison of histograms for the lower-mass () and higher-mass () subsamples. The lower-mass subsample shows similar distribution as compared to the whole sample; the derived parameters of intrinsic shape also agree well with each other. The histogram of the higher-mass subsample is slightly different from that of the whole sample with from the K-S test; however, their intrinsic shape parameters are still in agreement within the 68% uncertainty. We also divided the single- sBzK galaxies into subsamples according to their colors. Histogram of subsample is well in agreement with that of the whole sample as seen in Figure 17 (d). Their derived intrinsic shapes are also consistent with each other. For the subsample, the histogram peaks at , which is larger than the peak of the whole sample. This suggests a slightly higher thickness as also seen in Table 5, though an error is large. Figure 17 (e) shows the histograms of the and subsamples. The redshifts are binned so that both subsamples have comparable number of galaxies. Histograms of both subsamples seem to look similar to those of the whole sample; their best-fitting parameters are also consistent within uncertainty.
6.4.2 Rest-Frame Optical in GOODS-S and SXDS
Similar to the rest-frame UV wavelength, we combine the single- sBzK galaxies from GOODS-S and SXDS together in order to increase the statistical significance. Although the depth of the image in GOODS-S is currently shallower than that in SXDS, the resulting intrinsic shapes derived separately in both fields agree well with each other as shown in section 6.3.2. Thus combining the sample is unlikely to cause any false result or discussion.
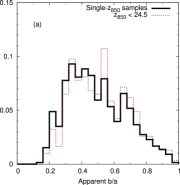
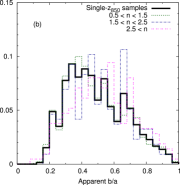
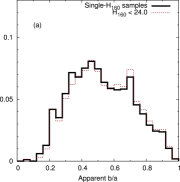
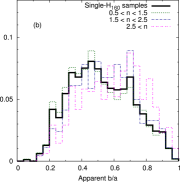
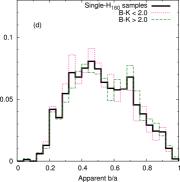
The single- sBzK galaxies were divided into subsamples according to their various properties and their histograms are shown in Figure 18. Figure 18 (a) shows the histogram of the sBzK subsamples with mag, which is the magnitude limit for determining the accurate Sérsic indices (section 5.1). Their histogram is remarkably identical to that of the whole sample and their derived intrinsic shape parameters are also the same (Table 5), indicating that using the whole sample to increase the statistic accuracy does not affect the results on intrinsic shape. Figure 18 (b) shows that the histograms of the and subsample have no significant difference from those of the whole sBzK sample. The fitting results in Table 5 also show an agreement within uncertainties. In contrast, the subsample shows lower fraction at and larger fraction at , similar to that seen in the rest-frame UV wavelength. According to Table 5, the peak (0.83) and peak (0.34) of the subsample are both different from those of the whole sample; the subsample statistically shows rounder and thicker shape than the sample. Although the subsample does not show the similar shape to the local elliptical galaxies (peak and peak ; Padilla & Strauss 2008), the trend of being thicker in shape than the subsample is the same as that in local universe in the way that local elliptical galaxies show almost similar face-on ratio but thicker edge-on ratio than the local disk galaxies.
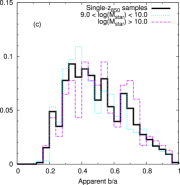
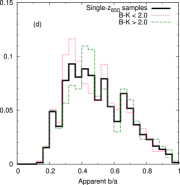
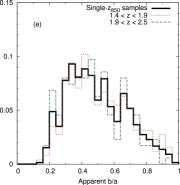
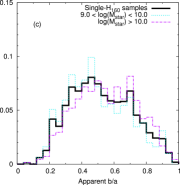
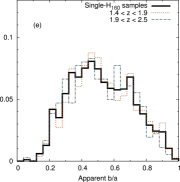
The distributions of mass-divided subsamples are shown in Figure 18 (c). Similar to the single- galaxies, the lower-mass subsample with shows similar distribution to the whole sBzK sample, meanwhile the larger-mass subsample with shows slightly different distribution, fewer fraction at and larger fraction at . The derived parameters show that the larger-mass sample is slightly rounder and thicker than the lower-mass one; however, they are still within uncertainty. Figure 18 (d) illustrates the histograms of the subsamples. The histograms of both subsamples are similar to each other and similar to the whole sample; their derived parameters are also consistent within uncertainty. Likewise, both histograms of the redshift subsamples are not significantly different from those of the whole sample as seen in Figure 18 (e). Their derived intrinsic shapes are also in agreement with each other.
7. Discussion
7.1. Intrinsic Shape Comparison with Disk Galaxies in the Local Universe
The apparent histogram of the local disk galaxies by Padilla & Strauss (2008) is shown in comparison purpose in the left panel of Figure 16. As described in the previous section, the histogram of the local disks is significantly different from the sBzK galaxies both in rest-frame UV and optical wavelengths. The peak value of the derived distribution is for the sBzK galaxies (combined sample in the rest-frame optical), while it is for the local disk galaxies, indicating that the local disks are significantly rounder than the sBzK galaxies. The parameters of the local disks differs from that of the sBzK galaxies in both wavelengths, suggesting that the local disks are statistically flatter than the sBzK galaxies at (right panels of Figure 16). It is implied that the population of galaxies showing round and flat disk seen in the local universe is unlikely to be exist yet at .
At this redshift, the outermost isophotes we can reach in this study are and mag arcsec-2 for and , respectively. Due to the cosmological dimming effect, of mag arcsec-2 at corresponds to mag arcsec-2 at after simple correction by median color of the sample, while mag arcsec-2 corresponds to mag arcsec-2 at . In contrast, the intrinsic shape study for local disk galaxies by Padilla & Strauss (2008) could reach surface brightness of 25 mag arcsec-2. Although we could not reach the same surface brightness as observed in the local universe, it is possible that the surface brightness we see corresponds to mag arcsec-2 by considering mag luminosity decrease from to (e.g., Scarlata et al. 2007). This surface brightness corresponds to far beyond bar ends seen in the local universe (e.g., Ohta et al. 1990; Kuchinski et al. 2000; Ohta et al. 2007). In fact, we trace the isophotes out to ″ radius at , which corresponds to kpc at . If the structural evolution was not drastic, we already trace the disk structure far enough.
7.2. Why Bar-Like?: Possible Origins of the Bar-Like/oval Structure
As discussed in the previous section, the sBzK galaxies at show the similar light profile, effective radius, and stellar surface mass density to those of the disk galaxies in the local universe, suggesting they are likely to be disk galaxies. However, we found that the sBzK galaxies (at least those with a single component) are statistically in bar-like or oval shape instead of a round disk seen in the local disk galaxies. This result rises an interesting question of why or how the sBzK galaxies become bar-like. It is worth noting here that the bar-like structure seen in sBzK galaxies is unlikely to be direct progenitors of bars in local barred galaxies, because a fraction of barred galaxies decreases with increasing redshifts and it is only 10-20% at (Sheth et al. 2008). Considering also the larger size as compared with a typical bar length in local universe, we regard the bar-like shape seen in the sBzK galaxies as a global structure of galaxies.
As discussed in paper I, one possibility is bar instability when the fraction of disk mass against halo mass within a disk radius exceeds the threshold (Ostriker & Peebles 1973). Using -body simulations, Athanassoula & Misiriotis (2002) showed that different central concentration results in different morphology of the bars. Their massive disk model (MD model), where disk dominates the inner part of the galaxy, shows an agreement of the bar structure with the intrinsic shape of the sBzK galaxies.
The bar structure can also be made by galaxy interaction (e.g., Noguchi 1987; Gerin et al. 1990; Miwa & Noguchi 1998; Berentzen et al. 2004). The galaxy is able to develop into a bar structure when perturbed by the tidal force of another galaxy. The galaxy loses its angular momentum due to tidal perturbation, resulting in elongating bar structure (Berentzen et al. 2004). Although this scenario seems to be less likely as the sBzK sample that we study is the single component, which shows no clear sign for strong close galaxy interaction, the bar-like structure generated through the galaxy interaction can last for at least a few Gyr (Noguchi 1996; Berentzen et al. 2004). Thus it is still possible that the bar-like structure we see in the sBzK galaxies are probably the results of the galaxy interaction in the past. The pass-by galaxy interaction (galaxy harassment) and continuous minor merging process are also likely to be responsible for the bar-like shape of the sBzK galaxies. Studying galaxy shapes in cosmological simulations is desirable to answer which of the above scenarios is the most likely process for causing the bar-like structure of star-forming galaxies at high redshift.
7.3. Do We See A Thick Disk?
The intrinsic thickness of is close to a typical value for thick disks in the present-day disk galaxies (e.g., Yoachim & Dalcanton 2006). Age of the stellar population composing the thick disk is old; in the Milky Way galaxy, the age of the stellar population in the thick disk is older than Gyr and most of them are between 10 and 13 Gyr (Reddy et al. 2006). Hence, there is a possibility that the structure we see is the progenitor of thick disks, though the radial scale length may be slightly smaller than that of present-day thick disk. The difference of peak thickness in the rest-frame UV and optical is very small, suggesting almost no age and/or metallicity gradient in the vertical structure. The thick disk may be heated up from a thin disk (e.g., Quinn et al. 1993). In the redshift range we studied there seems to be a subtle evolution of thickness as seen in Table 5: in while it is 0.24 in in the rest-frame UV and 0.30 in and 0.24 in in the rest-frame optical wavelength. However, the difference is probably not significant when considering the large uncertainty.
One problem for the thick disk interpretation may be the stellar mass of disks. Yoachim & Dalcanton (2006) showed for the local disk galaxies. Our sample galaxies show a typical stellar mass of and a scale length of 2 kpc, giving a circular velocity of km s-1 if the stellar mass dominates the total mass. Then the expected stellar mass ratio between thick and thin components at would be smaller than , i.e., the stellar mass of the thin disk at should be larger than that of the sBzK galaxies at with at least factor of five. If this is the case, the data points for in Figure 12 should shift toward right by dex or larger as the galaxies evolve, provided that the disk scale lengths do not evolve so much (Trujillo et al. 2006). Such a large shift can not reproduce the distribution of local disks in the figure. Thus the structure we see may partly include the thick disk, but would not totally be the thick disk. It should be worth noting that most of our sBzK galaxies are expected not to be evolving into present-day elliptical galaxies, because faint ( mag) sBzK galaxies are expected to reside in less massive dark halos and their counterparts at are expected to be disk galaxies according to a clustering amplitude (Hayashi et al. 2007).
8. Summary
We study the intrinsic structure of star-forming galaxies at selected as sBzK based on their and colors. 1028 and 29835 galaxies were selected down to mag in GOODS-South and SXDS fields, respectively. For these objects, we made SEDs and derived the photometric redshifts and stellar masses. In the GOODS-S, the structure of the sBzK galaxies was studied in both and images obtained with , which correspond to the rest-frame UV (Å) and optical wavelengths (Å), respectively, while only the rest-frame optical structure was studied in SXDS due to the availability of the images. The images cover only part of both GOODS-S and SXDS fields; therefore, only a fraction of sBzK galaxies (724 in GOODS-S and 2500 in SXDS) are used to study the rest-frame optical structure. Similar to paper I (Yuma et al. 2011), majority of the sBzK galaxies appear as a single component in high-resolution images. 57% (583) of the sBzK galaxies were classified as a single component in images in GOODS-S, while 86% (626) and 82% (2044) are classified as a single component in images in GOODS-S and SXDS, respectively. The larger fraction of single-component galaxies seen in images is partially due to their poorer resolution; however, more than half of the single- galaxies seen as multiple components in the images reveal the real morphological difference of galaxies between in the rest-frame UV and in the rest-frame optical wavelengths.
Structural analysis was done for the single-component sBzK galaxies by fitting 2D light distributions of galaxies with a single Sérsic profile by using GALFIT. Most of our samples show Sérsic indices of , suggesting a disk-like structure. Regardless of the observed fields, the effective radii are in the ranges of kpc and kpc in the and images, respectively. The median effective radius is 1.89 kpc for the single- galaxies in GOODS-S, while they are 2.52 kpc and 2.62 kpc for the single- galaxies in GOODS-S and SXDS, respectively. Ratio between the effective radii in and images () is 1.33, consistent with that of BM/BX or LBGs at similar redshift (Swinbank et al. 2010). Size-stellar mass relation of the sBzK galaxies with indicates that most sBzK galaxies have comparable stellar surface mass density to disk galaxies at , again suggesting they are disk galaxies.
Although the Sérsic index, effective radius, and stellar surface mass density of the sBzK galaxies are comparable to those of the local disk galaxies, it is important to study their intrinsic structure to see whether disk galaxies with similar shape as observed today already exist at . Distribution of apparent axial ratios () of the galaxies was used to derived the intrinsic shape of galaxies. By assuming a tri-axial model with axes , we found that the sBzK galaxies have peak face-on ratio of and peak edge-on ratio of in the rest-frame UV wavelength, where we also included the samples in the GOODS-N studied in paper I to improve statistical accuracy. For the rest-frame optical wavelength, the peak and ratios are and , respectively. The results indicate that the sBzK galaxies have almost the same intrinsic shape in both rest-frame UV and optical wavelengths, though with slightly rounder in the rest-frame optical images.
In order to examine the dependence of the intrinsic shape, we divided the sBzK galaxies into subsamples according to their properties. First, we determined the intrinsic shape of the brighter sample, whose structural parameters can be determined more reliably, and found that their derived intrinsic shape is consistent with the whole sample regardless of the rest-frame wavelength ranges. Likewise, dividing the sample into and does not affect the derived intrinsic shape. We, furthermore, divided the sBzK sample into subsamples by considering their stellar mass, color, and photometric redshifts. Except for the larger-mass subsample () that shows very slightly rounder and thicker shape, the intrinsic shapes of other subsamples are in agreement with those of the whole sBzK sample.
Comparing the intrinsic shape of the sBzK galaxies at to those of local disk galaxies (peak , peak ; Padilla & Strauss 2008), we found that the sBzK galaxies are rather in bar-like or oval shape and slightly thicker than round and flat disks seen in the local universe. There are several possibilities explain the origin of the bar-like structure of the sBzK galaxies. First is the bar instability in a massive disk galaxy where disk mass dominate the central part of the galaxy. Interaction between galaxies is another possible process in which the galaxy can evolve into bar structure after influenced by the tidal perturbation from the pass-by galaxy. Even though no sign of interaction is seen in our single-component sample, we cannot reject the possibility of this galaxy interaction scenario as the resultant bar structure from the galaxy interaction can remain for a few more Gyr. Moreover, the continuous minor merge could also be the case. Study of structure evolution in cosmological simulations is desirable. As the intrinsic ratio of the sBzK galaxies are comparable to the typical value for thick disks in the local disk galaxies, we may see progenitors of thick disks. However, if all the stellar mass of the sBzK galaxies at is that of thick disk, the expected stellar mass of total disk at would be very large, suggesting they are not the direct progenitor of the present-day thick disks, though a part of them may make the thick disks.
We are grateful to the anonymous referee for careful reading and valuable comments which improved clarity of the manuscript. This work is supported by the Grant-in-Aid for Scientific Research from Japan Society for the Promotion of Science (24540230) and the Grant-in-Aid for Global COE program ”The Next Generation of Physics, Spun from Universality and Emergence” from the Ministry of Education, Culture, Sports, Science, and Technology (MEXT) of Japan. This work is partially based on observations taken by the CANDELS Multi-Cycle Treasury Program with the NASA/ESA HST, which is operated by the Association of Universities for Research in Astronomy, Inc., under NASA contract NAS5-26555. Parts of the observations in GOODS-S have been carried out using the Very Large Telescope at the ESO Paranal Observatory under Program ID 168.A-0485.
References
- Akiyama et al. (2008) Akiyama, M., Minowa, Y., Kobayashi, N., et al. 2008, ApJS, 175, 1
- Athanassoula & Misiriotis (2002) Athanassoula, E. & Misiriotis, A. 2002, MNRAS, 330, 35
- Balestra et al. (2010) Balestra, I., Mainieri, V., Popesso, P., et al. 2010, A&A, 512, A12+
- Barden et al. (2005) Barden, M., Rix, H., Somerville, R. S., et al. 2005, ApJ, 635, 959
- Berentzen et al. (2004) Berentzen, I., Athanassoula, E., Heller, C. H., & Fricke, K. J. 2004, MNRAS, 347, 220
- Bertin & Arnouts (1996) Bertin, E. & Arnouts, S. 1996, A&AS, 117, 393
- Bolzonella et al. (2000) Bolzonella, M., Miralles, J., & Pelló, R. 2000, A&A, 363, 476
- Bruzual & Charlot (1993) Bruzual, G. & Charlot, S. 1993, ApJ, 405, 538
- Bruzual & Charlot (2003) —. 2003, MNRAS, 344, 1000
- Calzetti (1997) Calzetti, D. 1997, AJ, 113, 162
- Calzetti et al. (2000) Calzetti, D., Armus, L., Bohlin, R. C., et al. 2000, ApJ, 533, 682
- Cameron et al. (2011) Cameron, E., Carollo, C. M., Oesch, P. A., et al. 2011, ApJ, 743, 146
- Conselice et al. (2011) Conselice, C. J., Bluck, A. F. L., Ravindranath, S., et al. 2011, MNRAS, 417, 2770
- Daddi et al. (2004) Daddi, E., Cimatti, A., Renzini, A., et al. 2004, ApJ, 617, 746
- Förster Schreiber et al. (2009) Förster Schreiber, N. M., Genzel, R., Bouché, N., et al. 2009, ApJ, 706, 1364
- Furusawa et al. (2008) Furusawa, H., Kosugi, G., Akiyama, M., et al. 2008, ApJS, 176, 1
- Gerin et al. (1990) Gerin, M., Combes, F., & Athanassoula, E. 1990, A&A, 230, 37
- Giavalisco & Dickinson (2001) Giavalisco, M. & Dickinson, M. 2001, ApJ, 550, 177
- Giavalisco et al. (2004) Giavalisco, M., Ferguson, H. C., Koekemoer, A. M., et al. 2004, ApJ, 600, L93
- Grogin et al. (2011) Grogin, N. A., Kocevski, D. D., Faber, S. M., et al. 2011, ApJS, 197, 35
- Hayashi et al. (2009) Hayashi, M., Motohara, K., Shimasaku, K., et al. 2009, ApJ, 691, 140
- Hayashi et al. (2007) Hayashi, M., Shimasaku, K., Motohara, K., et al. 2007, ApJ, 660, 72
- Koekemoer et al. (2011) Koekemoer, A. M., Faber, S. M., Ferguson, et al. 2011, ApJS, 197, 36
- Kuchinski et al. (2000) Kuchinski, L. E., Freedman, W. L., Madore, B. F., Trewhella, M., Bohlin, R. C., Cornett, R. H., Fanelli, M. N., Marcum, P. M., Neff, S. G., O’Connell, R. W., Roberts, M. S., Smith, A. M., Stecher, T. P., & Waller, W. H. 2000, ApJS, 131, 441
- Law et al. (2012) Law, D. R., Steidel, C. C., Shapley, A. E., et al. 2012, ApJ, 745, 85
- Lawrence et al. (2007) Lawrence, A., Warren, S. J., Almaini, O., et al. 2007, MNRAS, 379, 1599
- Lilly et al. (1998) Lilly, S., Schade, D., Ellis, R., et al. 1998, ApJ, 500, 75
- Miwa & Noguchi (1998) Miwa, T. & Noguchi, M. 1998, ApJ, 499, 149
- Mosleh et al. (2011) Mosleh, M., Williams, R. J., Franx, M., & Kriek, M. 2011, ApJ, 727, 5
- Noguchi (1987) Noguchi, M. 1987, MNRAS, 228, 635
- Noguchi (1996) —. 1996, ApJ, 469, 605
- Nonino et al. (2009) Nonino, M., Dickinson, M., Rosati, P., et al. 2009, ApJS, 183, 244
- Ohta et al. (2007) Ohta, K., Aoki, K., Kawaguchi, T., & Kiuchi, G. 2007, ApJS, 169, 1
- Ohta et al. (1990) Ohta, K., Hamabe, M., & Wakamatsu, K. 1990, ApJ, 357, 71
- Ostriker & Peebles (1973) Ostriker, J. P. & Peebles, P. J. E. 1973, ApJ, 186, 467
- Ouchi et al. (2001) Ouchi, M., Shimasaku, K., Okamura, S., et al. 2001, ApJ, 558, L83
- Overzier et al. (2010) Overzier, R. A., Heckman, T. M., Schiminovich, D., et al. 2010, ApJ, 710, 979
- Padilla & Strauss (2008) Padilla, N. D. & Strauss, M. A. 2008, MNRAS, 388, 1321
- Pannella et al. (2009) Pannella, M., Gabasch, A., Goranova, Y., et al. 2009, ApJ, 701, 787
- Peng et al. (2010) Peng, C. Y., Ho, L. C., Impey, C. D., & Rix, H.-W. 2010, AJ, 139, 2097
- Pickles (1998) Pickles, A. J. 1998, PASJ, 110, 863
- Popesso et al. (2009) Popesso, P., Dickinson, M., Nonino, M., et al. 2009, A&A, 494, 443
- Quinn et al. (1993) Quinn, P. J., Hernquist, L., & Fullagar, D. P. 1993, ApJ, 403, 74
- Reddy et al. (2006) Reddy, B. E., Lambert, D. L., & Allende Prieto, C. 2006, MNRAS, 367, 1329
- Retzlaff et al. (2010) Retzlaff, J., Rosati, P., Dickinson, M., et al. 2010, A&A, 511, A50
- Rudnick et al. (2003) Rudnick, G., Rix, H.-W., Franx, M., et al. 2003, ApJ, 599, 847
- Ryden (2004) Ryden, B. S. 2004, ApJ, 601, 214
- Salpeter (1955) Salpeter, E. E. 1955, ApJ, 121, 161
- Sargent et al. (2007) Sargent, M. T., Carollo, C. M., Lilly, S. J., et al. 2007, ApJS, 172, 434
- Sawicki (2012) Sawicki, M. 2012, ArXiv e-prints; 1210.0285v1
- Sawicki & Yee (1998) Sawicki, M. & Yee, H. K. C. 1998, AJ, 115, 1329
- Scarlata et al. (2007) Scarlata, C., Carollo, C. M., Lilly, S., et al. 2007, ApJS, 172, 406
- Sérsic (1963) Sérsic, J. L. 1963, Boletin de la Asociacion Argentina de Astronomia La Plata Argentina, 6, 41
- Sersic (1968) Sersic, J. L. 1968, Atlas de galaxias australes, ed. Sersic, J. L.
- Shen et al. (2003) Shen, S., Mo, H. J., White, S. D. M., et al. 2003, MNRAS, 343, 978
- Sheth et al. (2008) Sheth, K., Elmegreen, D. M., Elmegreen, B. G., Capak, P., Abraham, R. G., Athanassoula, E., Ellis, R. S., Mobasher, B., et al. 2008, ApJ, 675, 1141
- Smail et al. (2008) Smail, I., Sharp, R., Swinbank, A. M., et al. 2008, MNRAS, 389, 407
- Steidel et al. (1996) Steidel, C., Giavalisco, M., Dickinson, M., & Adelberger, K. 1996, AJ, 112, 352
- Steidel et al. (2004) Steidel, C. C., Shapley, A. E., Pettini, M., et al. 2004, ApJ, 604, 534
- Swinbank et al. (2010) Swinbank, A. M., Smail, I., Chapman, S. C., et al. 2010, MNRAS, 405, 234
- Trujillo et al. (2006) Trujillo, I., Förster Schreiber, N. M., Rudnick, G., Barden, M., Franx, M., Rix, H.-W., Caldwell, J. A. R., McIntosh, D. H., Toft, S., Häussler, B., Zirm, A., van Dokkum, P. G., Labbé, I., Moorwood, A., Röttgering, H., van der Wel, A., van der Werf, P., & van Starkenburg, L. 2006, ApJ, 650, 18
- Unterborn & Ryden (2008) Unterborn, C. T. & Ryden, B. S. 2008, ApJ, 687, 976
- Wuyts et al. (2012) Wuyts, E., Rigby, J. R., Sharon, K., & Gladders, M. D. 2012, ArXiv e-prints
- Yabe et al. (2012) Yabe, K., Ohta, K., Iwamuro, F., et al. 2012, PASJ, 64, 60
- Yoachim & Dalcanton (2006) Yoachim, P. & Dalcanton, J. J. 2006, AJ, 131, 226
- Yoshikawa et al. (2010) Yoshikawa, T., Akiyama, M., Kajisawa, M., et al. 2010, ApJ, 718, 112
- Yuma et al. (2011) Yuma, S., Ohta, K., Yabe, K., Kajisawa, M., & Ichikawa, T. 2011, ApJ, 736, 92