Mining Permission Request Patterns from Android and Facebook Applications (extended author version)
Abstract
Android and Facebook provide third-party applications with access to users’ private data and the ability to perform potentially sensitive operations (e.g., post to a user’s wall or place phone calls). As a security measure, these platforms restrict applications’ privileges with permission systems: users must approve the permissions requested by applications before the applications can make privacy- or security-relevant API calls. However, recent studies have shown that users often do not understand permission requests and lack a notion of typicality of requests. As a first step towards simplifying permission systems, we cluster a corpus of 188,389 Android applications and 27,029 Facebook applications to find patterns in permission requests. Using a method for Boolean matrix factorization for finding overlapping clusters, we find that Facebook permission requests follow a clear structure that exhibits high stability when fitted with only five clusters, whereas Android applications demonstrate more complex permission requests. We also find that low-reputation applications often deviate from the permission request patterns that we identified for high-reputation applications suggesting that permission request patterns are indicative for user satisfaction or application quality.
1 Introduction
Open development platforms like Android and the Facebook Platform have resulted in the availability of hundreds of thousands of third-party applications that end users can install with only a few clicks. Consequently, end users are faced with a large and potentially bewildering number of choices when looking for applications. Users’ installation decisions have privacy and security ramifications: Android applications can access device hardware and data, and Facebook applications can access users’ profile information and social networks. As such, it is important to help users select applications that operate as the user intends.
Android and Facebook use permission systems to control the privileges of
applications. Applications can only access privacy- and security-relevant
resources if the user approves an appropriate permission request. For example, an Android application can only send text messages if
it has the SEND_SMS permission; during installation, the user will see a
warning that the application can “Send SMS messages” if the installation is
completed. These permission systems are intended to help users avoid privacy- or
security-invasive applications. Unfortunately, user research has demonstrated
that many users do not pay attention to or understand the permission
warnings [5, 10]. A major problem here is that users do not know what permission combinations are typical for applications.
Our work is a first step in the direction of simplifying permission systems by means of statistical methods. We propose to identify common patterns in permission requests so that applications that do not fit the predominant patterns can be flagged for additional user scrutiny. Towards this goal, we apply a probabilistic method for Boolean matrix factorization to the permission requests of Android and Facebook applications. We find that while applications with good reputations (i.e., many ratings and a high average score) typically correspond well to a set of permission request patterns, applications with poor reputations (i.e., less than 10 ratings) often deviate from those patterns.
The primary contribution of this paper is the first analysis of permission request patterns with a statistically sound model. Our technique captures the concept of identifying “unusual” permission requests. Our evaluation demonstrates that our technique is highly generalizable, meaning that the found clustering is stable over different random subsets of the data. We find that permission request patterns can indicate user satisfaction or application quality.
2 Background and Related Work
Android and the Facebook Platform support extensive third-party application markets. They use permission systems to limit applications’ access to users’ private information and resources.
2.1 Android
The Android Market is the official (and primary) store for Android
applications. The Market provides users with average user ratings, user
reviews, descriptions, screenshots, and permissions to help them select applications.
Android applications can access phone hardware (e.g., the
microphone) and private user information (e.g., call history) via Android’s API. Permissions
restrict applications’ ability to use the API. For example, an application can
only take a photograph if it has the CAMERA permission. Developers select
the permissions that their applications need to function, and these permission
requests are shown to users during the installation process.
The user must approve all of an application’s
permissions in order to install the application.
Several studies have examined Android applications’ use of permissions. Barrera et al. surveyed the most popular applications and found that applications primarily request a small number of permissions, leaving most other permissions unused [1]. They used self-organizing maps (a dimensionality reduction technique) to visualize the relationship between application categories and permission requests; based on this analysis, they concluded that categories and permissions are not strongly related. Their focus was on visualization and their findings are not applicable to identifying unusual permission request patterns; they relied on the minimization of a Euclidian cost function to find a low dimensional visualization of the data, whereas we use a generative probabilistic model to learn request patterns. Felt et al. and Chia et al. surveyed Android applications and identified the most-requested permissions [2, 4]. Chia et al. also found several correlations between the number of permissions and other factors: a weak positive correlation with the number of installs, a weak positive correlation with the average rating, a positive correlation with the availability of a developer website, and a negative correlation with the number of applications published by the same developer. We expand on these past analyses, and our analysis of permission requests is by far the largest study to date.
Other research has focused on using machine learning techniques to identify malware. Sanz et al. applied several types of classifiers to the permissions, ratings, and static strings of applications to see if they could predict application categories, using the category scenario as a stand-in for malware detection [13]. Shabtai et al. similarly built a classifier for Android games and tools, as a proxy for malware detection [14]. Zhou et al. found real malware in the wild with DroidRanger, a malware detection system that uses permissions as one input [17]. Although our techniques are similar, our goal is to understand the difference between high-reputation and low-reputation applications rather than to identify malware. Applications may be of low quality or act in undesirable ways (i.e., be risky) without being malware. Additionally, our approach only relies on permission requests; unlike these past approaches, we do not statically analyze applications to extract features, which makes our technique applicable to platforms where code is not available (such as the Facebook platform).
Enck et al. built a tool that warns users about applications that request blacklisted sets of permissions [3]. They manually selected the blacklisted patterns to represent dangerous sets of permissions. In contrast, we advocate a statistical whitelisting approach: we propose to warn users about applications that do not match the permission request patterns expressed by high-reputation applications. These two approaches could be complementary; human review of the statistically-generated patterns could potentially improve them.
2.2 Facebook
The Facebook Platform supports third-party integration with Facebook. Facebook lists applications in an “Apps and Games” market alongside information about the applications, including the numbers of installs, the average ratings, and the names of friends who use the same applications. Through the Facebook Platform, applications can read users’ profile information, post to users’ news feeds, read and send messages, control users’ advertising preferences, etc. Access to these resources is limited by a permission system, and developers must request the appropriate permissions for their applications to function. Applications can request permissions at any time, but most permission requests are displayed during installation as a condition of installation. Chia et al. surveyed Facebook applications and found that their permission usage is similar to Android applications: a small number of permissions are heavily used, and popular applications request more permissions [2].
3 Application Data Set
3.1 Data Collection
3.1.1 Android
We collected information about 188,389 Android applications from the official Android Market in November 2011111The data is available at http://www.mariofrank.net/andrApps/index.html. This data set encompasses approximately of the Android Market, which contained 319,161 active applications as of October 2011 [9]. To build our data set, we crawled and screen-scraped the web version of the Android Market. Each application has its own description page on the Market website, but the Market does not provide an index of all of its applications. To find applications’ description pages, we first crawled the lists of “top free” and “top paid” applications. These lists yielded links to 32,106 unique application pages. Next, we fed 1,000 randomly-selected dictionary words and all possible two-letter permutations (e.g., “ac”) into the Market’s search engine. The search result listings provided us with links to an additional unique applications. Once we located applications’ description pages, we parsed their HTML to extract applications’ names, categories, average rating score, numbers of ratings, numbers of downloads, prices, and permissions.
3.1.2 Facebook
Chia et al. provided us with a set of 27,029 Facebook applications [2]. They collected these applications by crawling SocialBakers [15], a site that aggregates statistics about Facebook applications. After following SocialBakers’s links to applications, they screen-scraped any permission prompts that appeared. They also collected the average ratings and number of ratings for each application. One limitation of this data set is that it only includes the permission requests that are shown to users as a condition of installation; they did not attempt to explore the functionality of the applications to collect secondary permission requests that might occur later. As such, our analysis only incorporates the permission requests that are shown to users as part of the installation flow.
3.2 Global Statistics of the Dataset
As an overview, we provide global statistics of the application datasets. We investigate overall application features, such as the price, ratings, and most popular permissions. The characteristics of these features play a role in our analysis of permission request patterns (Section 5).
Permission Requests.
Table 2 lists the 15 most frequently requested Android permissions, and Table 1 depicts the 15 most frequently requested Facebook permissions. As these indicate, a small number of permissions are widely requested, but most permissions are infrequently requested.
| requested | permission name |
|---|---|
| 67.35% | basic |
| 23.12% | publish_stream |
| 13.93% | |
| 3.38% | user_birthday |
| 2.47% | offline_access |
| 2.12% | user_photos |
| 1.79% | publish_actions |
| 1.52% | user_location |
| 1.32% | read_stream |
| 1.16% | user_likes |
| 1.05% | user_about_me |
| 0.95% | friends_photos |
| 0.75% | user_hometown |
| 0.69% | user_videos |
| 0.6% | friends_birthday |
| requested | permission name |
|---|---|
| 69.76% | Network communication : full Internet access |
| 43.24% | Network communication : view network state |
| 30.26% | Storage : modify/delete USB storage & SD card contents |
| 26.47% | Phone calls : read phone state and identity |
| 18.34% | Your location : fine (GPS) location |
| 16.89% | Your location : coarse (network-based) location |
| 16.16% | Hardware controls : control vibrator |
| 15.01% | System tools : prevent device from sleeping |
| 8.22% | Network communication : view Wi-Fi state |
| 8.11% | System tools : automatically start at boot |
| 6.71% | Services that cost money: directly call phone numbers |
| 6.27% | Your personal information : read contact data |
| 5.59% | Hardware controls : take pictures and videos |
| 4.61% | System tools : set wallpaper |
| 3.9% | System tools : retrieve running applications |
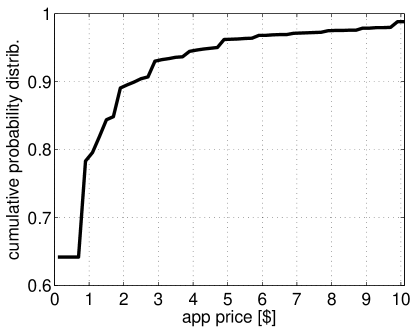
Price Distribution.
Figure 1a depicts the cumulative price distribution for Android applications. (Facebook applications are free, so we do not provide a price analysis for them.) Applications cost up to $200, and a majority of all applications are free. Globally, the price distribution has the most probability mass at low prices and a long tail at high prices. This is evident due to the almost monotonically decreasing slope of the cumulative distribution.
We find that developers are strategic in their pricing of applications. This is evidenced by a strong localized effect that manifests itself at prices just under each full dollar amount. This effect is the most noticeable at the $1 area: very few applications cost between $0.01 and $0.70, but many applications cost between $0.70 and $1. In the $2 area, this effect is apparent again, and this repeats on a dollar interval. The magnitude of this effect monotonically decreases with increasing price. An exception to this trend can be seen around $10, which may be a psychologically significant price due to its extra digit.
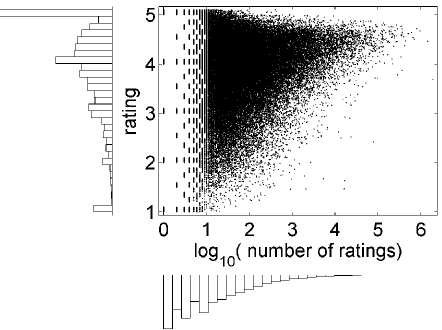
User Ratings.
In Figure 1b, we plot the average user rating score against the number of user ratings. The logarithm of the number of ratings has a long-tail distribution, which shows that most applications have very few ratings whereas only a few applications have more than ratings. Except for two significant peaks at scores of 1 and 5, the distribution of average ratings follows a Gaussian distribution centered at a score of 4. The peaks are due to the large number of applications that only have a few ratings, all of which are either 1 or 5 stars.
By examining the relationship between average score and the number of ratings, we can see that applications with higher scores tend to have more ratings. This suggests that high-quality applications are downloaded and rated more often than low-quality applications. Additionally, extreme average scores (1 or 5) are only obtained for applications with a small number of ratings, typically less than ten. These two observations indicate that the score alone is an insufficient measure of quality; one also must take the number of ratings into account.
4 Pattern Mining Technique
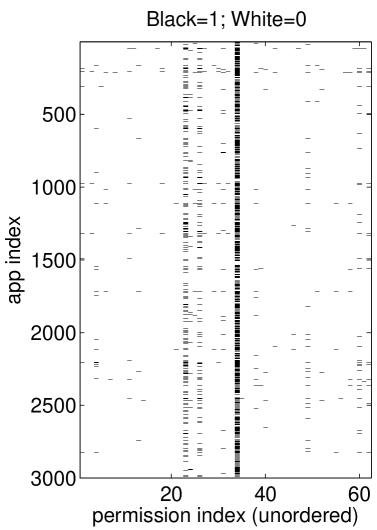
Our goal is to infer statistically significant permission request patterns from the set of all applications’ permission requests. Let be the number of applications, and let be the total number of possible permissions. We can then represent the dataset of applications’ permission requests as a binary matrix . The entry means that application requests permission . The row represents all permission requests of application .
Given this matrix as an input, we want to find the two following binary matrices: the matrix that encodes which permissions are frequently requested together (the permission request patterns), and the matrix that encodes which applications share the same permission request patterns. Let be the number of patterns found, then and .
These two matrices represent an approximate factorization of the input matrix via the Boolean matrix product, where the Boolean product of two matrices and is defined as (see [8] for more detailed introduction):
| (1) |
Having introduced these concepts, we can rephrase our goal as finding a factorization that approximates the permission request matrix up to such residuals that exhibit no statistically significant pattern, i.e.,
4.1 Model and Algorithm
We employ a probabilistic model for binary matrix factorization [8]. This model takes a binary matrix and computes the likelihood that a given factorization represents the statistically significant patterns of . We then tweak the entries of to maximize the likelihood of . The outcome is a factorization that does not necessarily provide an exact representation of . This model was originally derived as an approach to the role mining problem [11, 16], where the goal is to identify roles to configure role-based access control (RBAC) [6]. Sets of permission requests can be equated to roles.
The likelihood function in [8] explicitly models the data as a probabilistic mixture of signal and noise. In the context of mining permission requests, signal corresponds to significant patterns of permission requests, and noise corresponds to the residuals when fitting these patterns to the data. Each permission request of each application is assumed to follow either the signal distribution with probability , or a random Bernoulli distribution with probability . The signal distribution is
| (2) |
Here, the Boolean permission requests assigning permission to pattern are modeled by the probability that they are , i.e. . Assuming that the individual entries are independent, (2) is a modified Bernoulli distribution with Bernoulli parameter .
The noise distribution is a Bernoulli distribution . This means that if an application’s permission request is generated from the noise distribution, then it is sampled from a biased coin flip and with probability application requests permission .
Finally, the complete likelihood function is a mixture of the noise probability distribution and the signal probability distribution:
The parameters of this distribution can be optimized by an annealed expectation-maximization algorithm [8]. This algorithm alternates between updating the individual parameters and, after each iteration, reducing the computational temperature, ultimately forcing the probabilistic parameters towards or . The algorithm terminates when the parameter updates become negligible or when a predefined temperature is reached.
The optimization procedure outputs the set of parameters . The Boolean matrix product of and provides an approximation of the input matrix, i.e. . The two Bernoulli parameters and model the residuals. Here is the probability that a permission request is not determined by , and is the probability that such a permission request is 1. (A Boolean 1 means that the permission is requested by the particular application.)
The factorization can be interpreted in several ways. The matrix provides the assignment of permissions to permission request patterns, where one permission can appear in multiple patterns. The matrix assigns these patterns to applications. The disjunction of all permission request patterns of an application constitutes the set of permissions that an application requests. At the same time, is a clustering of applications into groups of applications that request the same set of permission patterns.
4.2 Selecting the Number of Patterns
The number of patterns must be provided as an input to the algorithm described in Section 4.1. This is an important parameter. For a simple dataset, a small number of patterns might suffice to capture all relevant information, whereas an overly high number of patterns could lead to overfitting. On the contrary, a complicated dataset might require a large number of different patterns; too few patterns could lead to missing significant individual permissions.
There are several related heuristics for this model-order selection problem [7, 12] and we approach it by carrying out an instability analysis [12]. The instability measure is based on the requirement that a clustering solution is reproducible. This means that a model should ideally find the same patterns or clusters in different random subsets of the data. To quantify the degree to which this requirement is satisfied, we subdivide into two independent and identically distributed data sets and . Then we run the factorization algorithm on both datasets, resulting in two clusterings of the applications: and . A good clustering algorithm will produce two similar clusterings. If the clusterings are exactly the same, then the algorithm is able to precisely find the patterns in the data that are significant (i.e., repeatable over the two subsets). If the clusterings differ a lot, then the algorithm has learned patterns that are random noise (i.e., they do not repeat over random subsets of the data).
It is difficult to compare clustering results for two different datasets. The solution taken in [12] is to train a classifier on the first data set and the cluster assignments and then to predict the cluster assignment of each object from the second dataset . Thereby, the binary vector indicates the assignment to all clusters (the placeholder index runs from to ) and the object can be assigned to multiple clusters at once (the sum can be larger than 1).
The numbering of clusterings is arbitrary and could incidentally differ between the solutions. Therefore, one must find the permutation that minimizes the deviation. Taking this into account, the instability is defined as
| (3) |
The predicate holds if the cluster assignment vectors of object and differ with respect to at least one cluster. The factor is needed to compare clustering solutions with different numbers of clusters in a fair way. This can be seen by considering completely random clusterings which should ideally lead to the same instability for different numbers of clusters. Let be the number of possible assignment vectors ( in the case of patterns), then randomly assigning data items with the assignment vectors yields a stability of .
As an example, Figure 3 depicts the outcome of the instability analysis of Android permission requests. We computed the instability for different numbers of permission request patterns between and . For each number of patterns , we computed the instability based on five random partitions of the dataset into two subsets and . We then plotted the median instability along with error bars that account for the standard deviation. As one can see, the instability is minimized at 30 permission request patterns. In the underfitting phase (), the instability is higher because the significant patterns that have been left out are randomly assigned to some of the existing patterns. This division of patterns is arbitrary, and thus not reproducible over the two random datasets. In the overfitting phase (), the extra patterns are fitted to random data-structures resulting from noise that do not reproduce over and , thus leading to a higher instability. In this phase, the variance of the instability also increases, since misinterpreting the random structures strongly depends on the particular noise realizations of the two subsets of the data. Following the results of this analysis, we selected patterns to fit the Android dataset and patterns to fit the Facebook dataset.

5 Experiments
We mine patterns of permission requests from high-reputation Android and Facebook applications. Section 5.1 details our methodology and provides an overview of the permission request patterns that we found. We then consider how permission request patterns differ between high- and low-reputation applications (Section 5.2) and find that the patterns can be used as part of a risk metric for new, unknown applications. We also consider whether request patterns are related to Android categories (Section 5.3).
5.1 Overview of the Permission Request Patterns
We apply the techniques described in Section 4 to the permission requests of high-reputation Android and Facebook applications.
5.1.1 Methodology
We train our model on high-reputation applications, defined as applications with average ratings of 4 or higher and at least 100 user ratings. As discussed in Section 3.2, our reputation metric must combine average ratings and the number of reviews because the average rating by itself is an unreliable measure. This quality criterion yields 11,554 Android applications and 1,998 Facebook applications. For Android, we reserved applications to use as a test set and trained on the remaining 9,554 high-reputation applications. For Facebook, we reserved test applications and trained on 1,598 applications.
In order to perform the instability analysis (Section 4.2), we randomly subdivided the training sets into halves. The outcome of this analysis led us to select patterns for the Android dataset and for Facebook. We then used the entire training set to fit the probabilistic model.
5.1.2 Results
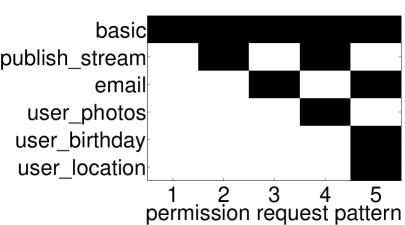
The Facebook dataset has a simple and clean structure. We found five permission request patterns (PRPs) for Facebook, which suffice to cover the requested permissions of most Facebook applications. Figure 4a depicts the five PRPs. This simple structure might be due to the fact that the permissions requested after installation are not accounted for in the data, as explained in Section 3.1.
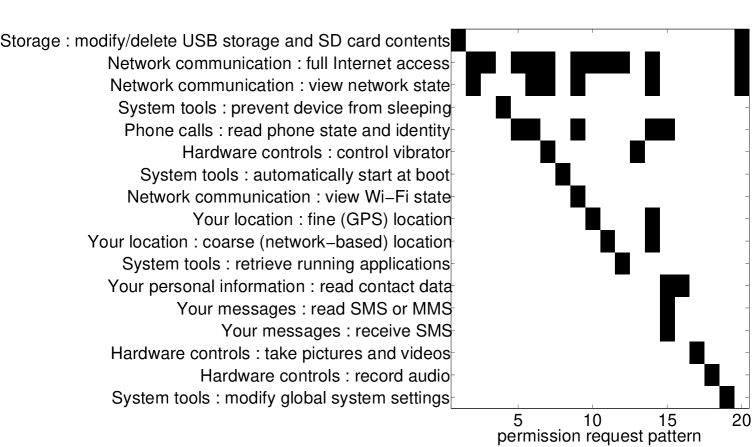
The Android dataset is more complex: our mining technique identified 30 PRPs for Android. The most common PRPs for Android are shown in Figure 5 and Table 3. Following the notation used in Section 4.1, Figures 4a and 5 are the transposed matrices that assign permission patterns to permissions. We sorted the patterns by frequency such that PRP1 is the most common pattern, PRP2 is the second most-requested pattern, etc.
PRPs are not disjoint: permissions can be members of multiple patterns, and applications can request multiple patterns. Consequently, most patterns only include a small number of permissions. A PRP with only one permission reflects the fact that the permission is requested very frequently, but not always together with the same other permissions.
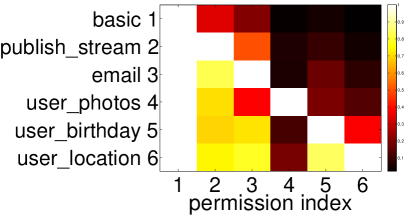
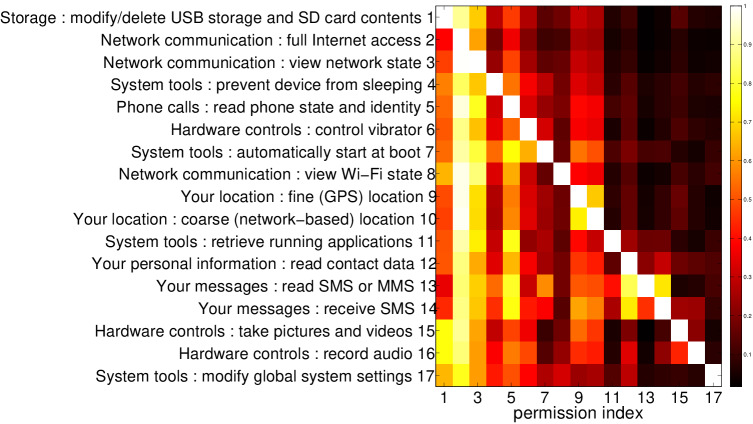
In order to explain why particular permissions appear in the same pattern, we can consider the pairwise conditional probabilities. For two permissions and , the conditional probability is empirically estimated as
| (4) |
If , then is requested whenever is requested. This score is not symmetric, i.e., is not necessarily true. We plot these scores for Android and Facebook in the heatmaps in Figure 4b and Figure 6, respectively. The brighter the color, the higher the conditional probability. It is apparent that pairs of permissions with a high conditional probability often end up in the same pattern. We found that clusters of permissions with a high pairwise conditional probabilities can not emerge by chance. We detail this analysis in Section 6.

5.1.3 Evaluation
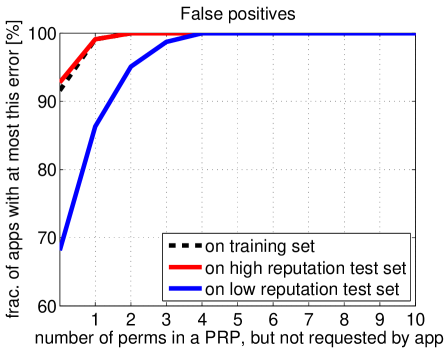
We evaluate how well the permission request patterns generalize and fit the data by considering the false positive and false negative rates. Ideally, the patterns should yield low false positive and false negative rates for both the training sets and the test sets. A false positive occurs when an application is assigned to a PRP without having all of the permissions associated with the PRP, and a false negative occurs when an application’s permission requests are not covered by any of the PRPs that the application is assigned to. Consequently, we define the false positive rate as the average number of permissions that are incorrectly assigned to applications, and the false negative rate as the average number of permissions per application that are not covered by PRPs. Given the reconstruction matrix and an indicator that is 1 if the predicate is true and 0 otherwise:
| (5) | |||||
| (6) |
We depict the cumulative false positive and false negative rates in Figures 7 and 8. (Please note that we cut off the y-axis at different values to best resolve the dynamic range for each experiment.) Our evaluation focuses on the error rates for the training set and high-reputation test set in Figures 7 and 8; we discuss the error rates for the low-reputation test set in Section 5.2.
Among the Facebook applications, 2% of high-reputation applications have at least one false positive (), and just under 20% of all high-reputation applications have false negatives (). Thereby, the residuals are very small: there are almost no applications with more than one false positive () and only 7% with more than one false negative (). The error rates are higher for Android applications, which reflects the greater complexity of the Android dataset. Approximately of high-reputation applications have at least one false positive, and have false negatives. For both platforms, the false negative rate is significantly higher than the false positive rate. The false negative rate can be partially attributed to the very large number of infrequently-requested permissions; these unpopular permissions cannot be placed in PRPs, so the applications that request them cannot be fully fitted with PRPs.
For both platforms, the error rate for the high-reputation test set closely matches the error rate for the high-reputation training set. This demonstrates that we have likely discovered the true statistical structure of the permission requests for high-reputation applications.


5.2 Reputation and Risk
Our goal is to determine whether permission request patterns can help identify low-quality applications that users should be cautious about installing. We trained on high-reputation applications with the assumption that high-reputation applications are trustworthy, high-quality applications. If this is true, PRPs could be incorporated into a risk metric for new applications: new applications could be considered riskier or lower-quality if their permission requests cannot be fitted to high-reputation PRPs.
We can evaluate the suitability of PRPs for a risk metric by comparing the false positive and false negative rates for the high-reputation training set, the high-reputation test set, and a low-reputation test set that includes applications with fewer than 10 user ratings (regardless of the score). Figures 7 and 8 display all three datasets. We find that low-reputation applications significantly differ from high-reputation applications in how they request permissions, as evidenced by the false positive and negative rates. While the reputable test applications have an error rate that is close to the training error, the unpopular applications have significantly higher residuals, both false positives and false negatives. This does not indicate that the low-reputation applications are fraudulent, but it does suggest that permission requests can be used to help classify an application as high- or low-reputation. Consequently, we recommend that permission request patterns be used as part of a risk metric for newly-uploaded applications. For example, this could be incorporated into a search result ranking algorithm.
5.3 Android Categories
In the Android Market, applications are grouped into 27 application categories and 8 game categories based on their primary purpose, such as “Books & Reference,” “Photography,” and “Weather.” Since categories are roughly indicative of functionality, we consider whether there exists a relationship between categories and permission request patterns. If such a relationship were to exist, then certain patterns would be strongly associated with certain categories.
For example, Figure 9 illustrates the relationship between PRP1 and categories. Applications that fit PRP1 are more likely to be in certain categories than general applications are: disproportionately few PRP1 applications are classified as “Entertainment” or “Tools,” whereas disproportionately many PRP1 applications are in the “Communication” category. Most of the applications that fit PRP1 fall in ten categories. This indicates that certain categories are more likely than others to contain applications that request this set of permissions.
To quantify the difference between the distribution of categories across all applications () and the distribution of categories across applications that fit a certain PRP (), we compute the Kullback-Leibler divergence . The depicted example for PRP 1 has . The KL-divergences of all other PRPs are reported in Table 3. Particular patterns are always assigned to applications of many categories; i.e., we do not find a one-to-one relationship between any categories and patterns. However, we do find that the patterns are informative for the categories of the applications.

5.4 Sanity Check: Simulated Applications
In this section, we carry out a sanity check based on simulated permission request data. We want to find out if a set of hypothetical applications that randomly request permissions can exhibit many pairs of permissions that by chance are often co-requested and thus can be misinterpreted as patterns. If this is true, it is invalid to believe that our found patterns reflect true functionality of the applications, as the patterns could as well just occur by chance.
As discussed in Section 5.1 the permission request patterns in the data are due to pairs of permissions that have a significantly higher conditional probability of being requested than other pairs. This pairwise conditional probability (PCP), defined in Eq. (4), quantifies how likely it is that an application requesting one permission also requests the other.
In order to test the hypothesis that random permission requests can lead to random structures, we carry out the following experiment. For each permission of the Android dataset, we compute the empirical probability that the permission is requested: with . We simulate the permission requests of hypothetical applications. For each application and each permission , we request with probability . Then, we compute the PCP of all pairs of permissions from Eq. (4).

In Figure 10, we depict the number of permission pairs that have a particular PCP for the real Android dataset and the simulated dataset, respectively. Please note that both axes are logarithmic. Also, we centered the histogram bins at logarithmically spaced positions. All permission pairs with a PCP have been accounted to the lowest bin.
The plot illustrates that, overall, the PCPs of the simulated applications are significantly lower than those of the real applications. While the difference for PCPs less or equal than 2% is small, it grows from this point with increasing PCP. For large PCPs, i.e. with over 50%, the difference is one order of magnitude large. Please note that the total number of permission pairs equals for both datasets. Overall, we compute an average PCP of 8.7% for the real applications and 1.2% for the simulated applications. This result suggests that the found patterns do not randomly arise but might reflect some underlying structure of the Android marketplace.
6 Discussion
We provide a critical discussion of our approach and potential future directions.
How could this information be conveyed to users? Applications that do not fit high-reputation PRPs could be ranked lower in search results, unless they receive enough favorable reviews to override the risk metric. Another possibility is to alter the permission request UI so that permissions that deviate from PRPs are highlighted, so that the user’s attention is focused on the “unusual” permission requests. This would help provide the user with a relative notion of risk. However, such a design would need to be subject to user research.
Is this technique suitable for detecting malware? We do not aim to provide a malware detector. Applications may be untrustworthy, low-quality, buggy, or otherwise risky without being malware. We found that applications that receive favorable reviews from large numbers of users request permissions differently than applications with few ratings. Consequently, we designed our approach to identify user satisfaction rather than application maliciousness.
Why not use supervised learning? Our approach uses unsupervised learning to find permission request patterns. An alternative approach is to manually analyze and label applications based on the characteristics of their permissions or code. In this way, one could create a classifier that discriminates between “good” and “bad” applications. However, the obvious drawback with this approach is that manually-generated labels are expensive: manual analysis of applications is time-consuming, and there are hundreds of thousands of diverse applications. Consequently, only a very small set of labels would be available, and the labels might not be representative of all “good” or “bad” applications. The approach that we propose is fully unsupervised and can automatically learn from the huge corpus of all available applications.
How indicative for the quality of apps are permissions? The difference between high-reputation and low-reputation applications is significant, which we attribute to a difference in application quality. However, other factors could at least partially influence the results. The low-reputation applications could be newer applications, and permission request patterns might change over time. This could be accounted for by computing PRPs for chronologically-similar applications. Some of the low-reputation applications might become high-reputation applications in the future; if they were excluded, the difference between the two sets might be more pronounced. Additionally, low-reputation applications might be highly specialized, leading both to exceptional permission requests and few interested users. However, we believe that a real difference in applications is the most likely and predominant reason for the disparity in ratings.
Some permission patterns are requested by only a few applications. How can they be significant? Even if only few applications request a pattern, it is still significant if it can be found in different random subsets of applications. We test for this criterion by the stability analysis described in Section 4.2. In essence, significance means reproducibility or stability and does not necessarily require that a high fraction of applications request the pattern.
7 Conclusion
We used a probabilistic model to mine permission request patterns from Android and Facebook applications. For both platforms, we found a set of patterns that fits well to the data. We found that the permission requests of low-reputation applications differ from the permission request patterns of high-reputation applications. This indicates that permission request patterns can be used as part of a risk metric or soft prediction of the quality of new applications. For Android, we find that there is a relationship between permission request patterns and categories. In future work, we will extend the analysis with application categories in order to achieve greater precision.
Acknowledgment
This research was supported by Intel through the ISTC for Secure Computing and by the Swiss National Science Foundation (SNSF), grant no. 138117.
References
- [1] David Barrera, H. G üne ş Kayacik, Paul C. van Oorschot, and Anil Somayaji. A methodology for empirical analysis of permission-based security models and its application to android. In Proceedings of the 17th ACM conference on Computer and Communications Security, CCS, 2010.
- [2] Pern Hui Chia, Yusuke Yamamoto, and N. Asokan. Is this App Safe? A Large Scale Study on Application Permissions and Risk Signals. In Proceedings of the World Wide Web Conference, WWW, 2012.
- [3] William Enck, Machigar Ongtang, and Patrick McDaniel. On Lightweight Mobile Phone Application Certification. In Proceedings of the ACM conference on Computer and communications security, CCS, 2009.
- [4] Adrienne Porter Felt, Kate Greenwood, and David Wagner. The effectiveness of application permissions. In Proceedings of the USENIX Conference on Web Application Development, WebApps, 2011.
- [5] Adrienne Porter Felt, Elizabeth Ha, Serge Egelman, Ariel Haney, Erika Chin, and David Wagner. Android Permissions: User Attention, Comprehension, and Behavior. Technical Report UCB/EECS-2012-26, EECS Department, University of California, Berkeley, 2012.
- [6] David F. Ferraiolo and D. Richard Kuhn. Role Based Access Control. In 15th National Computer Security Conference, pages 554–563, 1992.
- [7] Mario Frank, Morteza Chehreghani, and Joachim M. Buhmann. The minimum transfer cost principle for model-order selection. In ECML PKDD ’11, volume 6911 of Lecture Notes in Computer Science, pages 423–438. Springer Berlin / Heidelberg, 2011.
- [8] Mario Frank, Andreas P. Streich, David Basin, and Joachim M. Buhmann. Multi-assignment clustering for Boolean data. Journal of Machine Learning Research, 13:459–489, Feb 2012.
- [9] Leslie Horn. Report: Android market reaches 500,000 apps. http://www.pcmag.com/article2/0,2817,2395188,00.asp.
- [10] Jennifer King, Airi Laminen, and Alex Smolen. Privacy: Is there an app for that? In Proceedings of the Symposium on Usable Privacy and Security, SOUPS, 2011.
- [11] Martin Kuhlmann, Dalia Shohat, and Gerhard Schimpf. Role mining – revealing business roles for security administration using data mining technology. In SACMAT, pages 179–186, New York, NY, USA, 2003.
- [12] Tilman Lange, Volker Roth, Mikio L. Braun, and Joachim M. Buhmann. Stability-based validation of clustering solutions. Neural Computation, 16:1299–1323, 2004.
- [13] B. Sanz, I. Santos, C. Laorden, X. Ugarte-Pedrero, and P.G. Bringas. On the automatic categorisation of android applications. In Proceedings of the 9th IEEE Consumer Communications and Networking Conference (CCNC), 2012.
- [14] Asaf Shabtai, Yuval Fledel, and Yuval Elovici. Automated static code analysis for classifying android applications using machine learning. In Proceedings of the 2010 International Conference on Computational Intelligence and Security, CIS, 2010.
- [15] SocialBakers – Applications on Facebook. http://www.socialbakers.com/facebook-applications.
- [16] Jaideep Vaidya, Vijayalakshmi Atluri, and Qi Guo. The role mining problem: A formal perspective. ACM Trans. Inf. Syst. Secur., 13(3):27:1–27:31, July 2010.
- [17] Yajin Zhou, Zhi Wang, Wu Zhou, and Xuxian Jiang. Hey, You, Get off of My Market: Detecting Malicious Apps in Official and Alternative Android Markets. In Proceedings of the Network and Distributed System Security Symposium, NDSS, 2012.
| PRP 1; requested by 21.46% of apps; 1.52 bits KL-divergence |
|---|
| Storage : modify/delete USB storage contents & SD card contents |
| PRP 2; requested by 18.05% of apps; 1.59 bits KL-divergence |
| Network communication : full Internet access |
| Network communication : view network state |
| PRP 3; requested by 15.91% of apps; 1.49 bits KL-divergence |
| Network communication : full Internet access |
| PRP 4; requested by 12.41% of apps; 1.43 bits KL-divergence |
| System tools : prevent device from sleeping |
| PRP 5; requested by 10.01% of apps; 1.46 bits KL-divergence |
| Network communication : full Internet access |
| Phone calls : read phone state and identity |
| PRP 6; requested by 8.81% of apps; 1.57 bits KL-divergence |
| Network communication : full Internet access |
| Network communication : view network state |
| Phone calls : read phone state and identity |
| PRP 7; requested by 8.62% of apps; 1.68 bits KL-divergence |
| Hardware controls : control vibrator |
| Network communication : full Internet access |
| Network communication : view network state |
| PRP 8; requested by 8.55% of apps; 1.61 bits KL-divergence |
| System tools : automatically start at boot |
| PRP 9; requested by 8.43% of apps; 1.42 bits KL-divergence |
| Network communication : full Internet access |
| Network communication : view Wi-Fi state |
| Network communication : view network state |
| Phone calls : read phone state and identity |
| PRP 10; requested by 8.4% of apps; 1.57 bits KL-divergence |
| Network communication : full Internet access |
| Your location : fine (GPS) location |
| PRP 11; requested by 7.65% of apps; 1.53 bits KL-divergence |
| Network communication : full Internet access |
| Your location : coarse (network-based) location |
| PRP 12; requested by 6.82% of apps; 1.61 bits KL-divergence |
| Network communication : full Internet access |
| System tools : retrieve running applications |
| PRP 13; requested by 6.34% of apps; 1.4 bits KL-divergence |
| Hardware controls : control vibrator |
| PRP 14; requested by 5.76% of apps; 1.32 bits KL-divergence |
| Network communication : full Internet access |
| Network communication : view network state |
| Phone calls : read phone state and identity |
| Your location : coarse (network-based) location |
| Your location : fine (GPS) location |