IRAS 19520+2759: a 105 massive young stellar object driving a collimated outflow
Abstract
The theory of massive star formation currently suffers from a scarce observational base of massive young stellar objects to compare with. In this paper, we present interferometric 12CO (1–0), 13CO (1–0), C18O (1–0), and 2.6 mm continuum images of the infrared source IRAS 19520+2759 together with complementary single-dish observations of CS (1–0), obtained with the 34 m antenna DSS-54 at the Madrid Deep Space Communications Complex, as well as archive images at different wavelengths. As a result from our work, IRAS 19520+2759, with a controversial nature in the past, is firmly established as a massive young stellar object associated with a strong and compact millimetre source and driving a collimated outflow. In addition, a second fainter millimetre source is discovered about 4 arcsec to the south, which is also driving an outflow. Furthermore, the two millimetre sources are associated with C18O clumps elongated perpendicularly to the outflows, which may be related to rotating toroids. The masses of gas and dust of the millimetre sources are estimated to be around 100 and 50 . MM1, the dominant source at all wavelengths, with a total luminosity of (1–2) at 9 kpc, is however not associated with 6 cm emission down to a rms noise level of 0.1 mJy. We propose that IRAS 19520+2759 could be an example of the recent theoretical prediction of ‘bloated’ or ‘swollen’ star, i. e., a massive young stellar object whose radius has increased due to effects of accretion at a high-mass accretion rate.
keywords:
Stars: formation – ISM: individual objects: IRAS 19520+2759 – ISM: molecules1 Introduction
 |
Although high-mass ( ) stars are clue pieces in the Universe and galaxy evolution, many questions remain open concerning their formation process. The root of the problem is that the Kelvin-Helmholtz timescale for a high-mass star is much shorter than the free-fall timescale of the natal core, and thus the star reaches the main-sequence while still accreting matter. The important amounts of UV radiation emitted by the nascent massive star should halt at some point further accretion onto the star, limiting its final mass to a certain value which is currently not well established. From a theoretical point of view, there are a number of studies showing that it is possible to form a 40–50 star through disc-mediated accretion (e. g., Yorke & Sonnhalter 2002; Krumholz et al. 2009), and even it seems possible to form stars of up to 140 (e. g., Kuiper et al. 2010, 2011). However, from an observational point of view, a clear picture of the different evolutionary stages that a massive star undergoes until reaching the main-sequence is lacking, mainly due to the fast evolution of massive stars. Beuther & Shepherd (2005) and Keto (2007) suggest an observational sequence for massive star formation, where the O-type stars progenitors are B-type objects embedded in large amounts of dust and gas and accreting at large mass infall rates (10-4–10-3 yr-1). In this scenario, the B-type object drives a collimated molecular outflow, and while progressively moving from early-B to late-O and finally early-O, the opening angle of the outflow progressively increases. Thus, the earliest stages in the formation of an O-type star should be characterized by a central B-type object, driving a collimated outflow, and embedded in an infalling envelope massive enough to provide the B-type object with the required mass to become an O-type object. Typically, the massive young stellar objects (YSOs) in the earliest evolutionary stages also present emission from complex organic molecules (the so-called hot molecular cores, e. g., Cesaroni et al. 2010) and a lack of strong centimetre emission (e. g., Beuther et al. 2002; Molinari et al. 1998; Mottram et al. 2011). A possible reason for the lack of an HII region is the quenching and/or trapping of the ionized gas by the infalling dense envelope (e. g., Walmsley 1995; Molinari et al. 1998; Keto 2002, 2003), or, as recently proposed by Hoare & Franco (2007), an increase of stellar radius as accretion proceeds onto the star due to trapped entropy (the so-called ‘swollen’ or ‘bloated’ stars), which produces a decrease of the stellar effective temperature and of the UV radiation emitted by the nascent star (e. g., Yorke & Bodenheimer 2008; Hosokawa, Yorke, & Omukai 2010).
Thus, the study of outflow and accretion signatures in massive YSOs is essential to progress in the understanding of massive star formation. However, there are only a few O-type YSO candidates (i. e., with bolometric luminosities ) associated with disc-like structures or toroids of dense gas and possibly undergoing infall (e. g., Zhang, Ho, & Ohashi 1998; Pestalozzi et al. 2004; Sollins & Ho 2005, Sollins et al. 2005a; Beltrán et al. 2006; Beuther et al. 2007a,b; Beuther & Walsh 2008; Franco-Hernández et al. 2009; Cesaroni et al. 2011; Furuya et al. 2011; Qiu et al. 2012; Jiménez-Serra et al. 2012; Wang et al. 2012), and it is not clear if these massive YSOs harbor true single O-type objects or a multiple system of early-B objects (e. g., Naranjo-Romero et al. 2012). This cannot be easily elucidated because most of the aforementioned massive YSOs undergoing infall are not detected at optical wavelengths and their spectral type cannot be assessed. On the other hand, YSOs with luminosities and detected in the optical/NIR have been found associated with accreting disks through near-infrared observations (e. g., Jiang et al. 2008; Davies et al. 2010; de Wit et al. 2010; Kraus et al. 2010; Wheelwright et al. 2012), but their number is also scarce. Thus it is extremely necessary to enlarge the sample of O-type YSOs undergoing infall and actively accreting, and simultaneously detected in the optical/NIR to characterize not only the infalling envelope but also the central object. The results obtained from the joint analysis of multiwavelength data presented in this paper indicate that one new actively accreting O-type (luminosity ) candidate is IRAS 19520+2759 (R.A. (J2000)=19h54m059 and Dec. (J2000)=28°07′41′′).
The status of IRAS 19520+2759 (hereafter, I19520) has been controversial: it was originally suggested to be an OH/IR star based on its infrared colors (Habing & Olnon 1984). However, Arquilla & Kwok (1987) examined the InfraRed Astronomical Satellite (IRAS) images towards this region and found the far-infrared emission to be extended. This, together with its spectral energy distribution (nearly flat from NIR to 100 m), led these authors to conclude that this object was likely a young star embedded in an extended molecular cloud. In addition, Arquilla & Kwok (1987) present a single-dish 12CO spectrum with broad wing emission (FWZI 30 km s-1), similar to the line wings associated with outflows in star-forming regions, and Gledhill (2005) reports the detection of a polarized reflection nebula in the near-infrared. H2O and OH maser emission with single-peaked profiles (i. e., unlike double-peaked profiles in evolved stars) lends additional credence to the identification of this source as a YSO (Engels et al. 1984, Lewis et al. 1985). Moreover, the non detection of SiO maser emission (Nakashima & Deguchi 2003) is also consistent with the YSO nature (e. g., Zapata et al. 2009b).
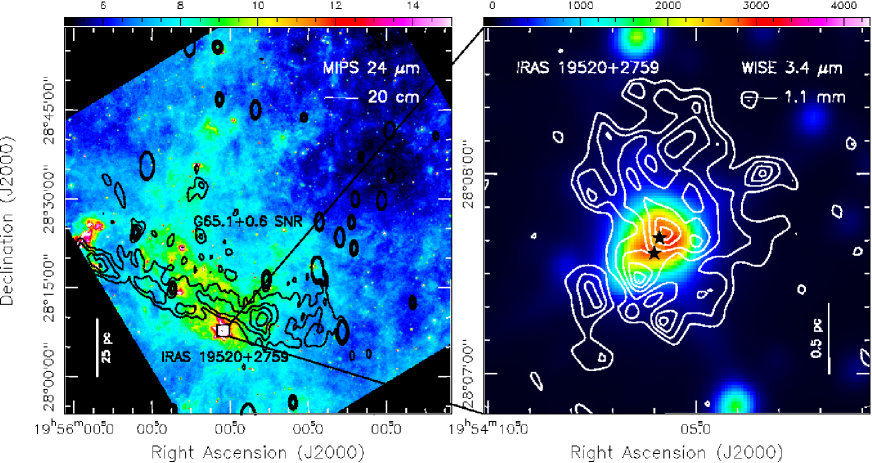
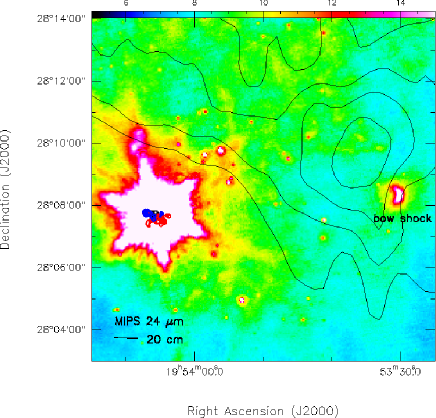
I19520 stands out in the infrared as the brightest and reddest object within a field of view of arcmin. A recent image from the Spitzer MIPSGAL survey (Multiband Imaging Photometer for Spitzer Inner Galactic Plane Survey, Carey et al. 2009) at 24 m shows a very bright, compact source coincident with the IRAS source and surrounded by a much more extended (), diffuse emission tracing a large molecular cloud (see Fig. 1). Cold dust emission from this large molecular cloud is traced by Bolocam observations at 1.1 mm (Rosolowsky et al. 2010; Aguirre et al. 2011), which reveal an extended ( arcsec) source, of about 0.7 Jy of flux density, where I19520 is embedded (Fig. 1). Interestingly, I19520 is located at the boundary of the supernova remnant G 65.1+0.6 in a region where the remnant is probably interacting with the surrounding interstellar medium (Fig. 1; Landecker et al. 1990; Tian & Leathy 2006).
Hrivnak et al. (1985) identified an optical counterpart candidate of I19520, which appears as a bright, point-like source as observed with the Hubble Space Telescope (GO 9463, PI: R. Sahai). Recently, Sánchez Contreras et al. (2008) report echelle long-slit 3900–10900 Å spectroscopy of I19520111Due to its similar IRAS colors, I19520 was included in the list of pre Planetary Nebula candidates by these authors., and show that the optical spectrum is dominated by emission lines consistent with the presence of a compact, photoionized region around an early-type (B or ealier) star (an in depth study of the optical spectrum is in preparation by Sánchez Contreras et al.). Finally, the intense H emission detected toward the nebular core shows broad wings (2600 km s-1) and a remarkable P-Cygni profile with two blue-shifted absorption features, suggesting multiple stellar winds with (projected) expansion velocities of up to 800 km s-1.
As already noted by Arquilla & Kwok (1987), the galactic longitude and negative VLSR of I19520 indicate that this object is very remote. We estimate a value for its kinematic distance of kpc, determined from the target radial velocity (VLSR16.5 km/s) and its galactic coordinates (=64.8131°, =+00.1744°) by assuming a simple galactic rotation law and adopting a value for the A Oort constant of 14.4 km s-1 kpc-1 and a galactocentric radius of 8.5 kpc (Kerr & Lynden-Bell, 1986). As indicated by Arquilla & Kwok (1987), this value of the distance is consistent with the non-kinematic distances, 8–10 kpc, of two H II regions in the catalog of Blitz et al. (1982) that are likely to occupy approximately the same region of the Galaxy (given their similar and radial velocities). The range of radial velocities displayed by the H I 21 cm-line emission profile, VLSR=[20:26 km/s], at the boundary of the SNR G65.1+0.6, next to which I19520 and the surrounding molecular cloud are located (Fig. 1), consistently yield a kinematic distance for the SNR of 9–10 kpc (Landecker et al. 1990; Tian & Leahy 2006). In view of these results, we adopt a distance of 9 kpc for I19520.
The rest of this paper is organized as follows. In Section 2, we describe the observations, in Section 3 we give the main results from the OVRO 2.6 mm, and 12CO(1–0), 13CO(1–0) and C18O(1–0), in Section 4 we derive the main physical properties of the molecular gas, outflow and central object in I19520, and in Section 5 we discuss a possible interpretation for I19520 within the massive star formation framework.
2 Observations and data reduction
2.1 OVRO observations
Interferometric mapping of the 12CO, 13CO, and C18O =10 line emission at 108–115 GHz of I19520 was carried out using the six 10.4-m antennas millimetre array of the Owens Valley Radio Observatory (OVRO), which is now part of The Combined Array for Research in Millimeter-wave Astronomy (CARMA222http://www.mmarray.org). Observations were performed in different runs between 2002 and 2004 using the compact (C), equatorial (E), and high (H) array configurations, with baselines ranging between 4.01 and 93.3 k in the plane. The coordinates of the tracking center are R.A. (J2000)=19h54m0592 and Dec. (J2000)=28°07′415, and the total on-source time was 18 hr.
| Array | Beam size | P.A. | rmsa/rmsb | |
|---|---|---|---|---|
| Maps | Config. | (″″) | (°) | (mJy beam-1) |
| 12CO (1–0) | CEH | 85.5 | 17/63 | |
| 13CO (1–0) | CEH | 72.7 | 12/25 | |
| C18O (1–0) | CEH | 76.7 | 10/12 | |
| 2.6 mm cont. | CEH | 83.6 | 0.5 | |
| 2.6 mm cont. | H | 81.8 | 0.7 |
-
a
As measured in 1 MHz-wide channels with no signal
-
b
As measured in the central 1 MHz-wide channel where the CO brightness distribution peaks
| Positiona | Dec. ang. size | Dec. P.A. | a | a | Massb | ||
|---|---|---|---|---|---|---|---|
| Source | (∘) | (m) | (mJy) | () | |||
| MM1 | 19:54:05.87 | 28:07:40.9 | 110 | ||||
| MM2 | 19:54:06.00 | 28:07:36.3 | - | 48 | |||
| MM2 W | 19:54:05.82 | 28:07:36.3 | - | 20 | |||
| Allc | 19:54:05.87 | 28:07:41.1 | 52 | 140 | |||
-
a
Position, peak intensity and flux density are derived by fitting a Gaussian in the image domain (double gaussian for the case of MM2 and MM2W). Uncertainty in the peak intensity is the rms noise of the cleaned image, . Error in flux density has been calculated as (Beltrán et al. 2001), where and are the size of the source and the beam respectively, and is the error in the flux scale, which takes into account the uncertainty on the calibration applied to the flux density of the source ().
-
b
Masses derived assuming a dust temperature of 50 K (from a grey-body fit to the SED at wavelengths m), and a dust (and gas) mass opacity coefficient of 0.003 cm2 g-1 (obtained by extrapolating the tabulated values of Ossenkopf & Henning 1994, see Section 3.1). The uncertainty in the masses due to the dust temperature and opacity law is estimated to be a factor of 4.
-
c
Parameters derived from the image built using C+E+H configurations. For this case the peak intensity and flux density are derived by computing statistics in a region of 12 arcsec of diameter.
Observations of the 12CO, 13CO, and C18O (=1–0) transitions were performed simultaneously. The digital spectral line correlator was configured to provide a total bandwidth of 332 MHz ( 250 km s-1) with a channel spacing of 1 MHz ( 2.6 km s-1) in the 12CO and 13CO lines. For C18O, the units of the cross-correlator were set to bandwidths of 32 MHz (85 km s-1) with channel spacing of 1 MHz (2.7 km s-1). The 2.6 mm continuum emission was observed simultaneously using the dual-channel analog continuum correlator. Although the continuum correlator provides a total bandwidth of 4 GHz after combining both IF bands, our continuum maps have a bandwidth of 3 GHz since one of the 1 GHz bands, which contained the 12CO emission line, has not been used to generate the final maps.
Data calibration was performed using the MMA software package (Scoville et al. 1993). Gain-calibration was done against a nearby quasar, J2025+337, which was observed at regular time intervals of 20 minutes before and after each target observation. The bright quasar 3C 454.3 was observed at the beginning or end of the track for passband calibration. Absolute flux calibration was obtained by observing Uranus and 3C 454.3 as primary and secondary flux calibrators, respectively. Flux calibration errors could be of up to 20–30%, and absolute positional accuracies are estimated to be arcsec.
Reconstruction of the maps from the visibilities was done using standard tasks of the Multichannel Image Reconstruction, Image Analysis and Display (MIRIAD) software (Sault et al. 1995). After Fourier transforming the measured visibilities with natural weighting, data were cleaned and maps restored. For the continuum, we have separately obtained two sets of maps, one set using all the data available from all three, C+E+H, configurations, and another one using only data from the H configuration; the later provides maps with improved spatial resolution but lower S/N. For the line emission, imaging of the H configuration data suffers from an important decrease of S/N and missing flux, and for this reason we only show here the C+E+H configuration data for the line. The size and orientation of the synthesized clean beam together with the noise in our maps are given in Table 1.
2.2 Single-dish observations with DSS-54 of Madrid DSCC
We have used the DSS-54 antenna of NASA’s Madrid Deep Space Communications Complex (DSCC) in Robledo de Chavela, under the ‘Host Country’ program. The antenna is a beam-wave-guide paraboloid, with a Coudé focus, and has a diameter of 34 m. The observations were done using the dual-polarization Q-band High Electron Mobility Transistor (HEMT) receiver attached to the antenna. We have observed both circular polarizations using the new wideband backend (Rizzo et al. 2012a).
The CS (1–0) line (48.990955 GHz) was observed using two spectral windows having bandwidths of 500 MHz and 16,384 channels, which provide a spectral resolution of 30.5 kHz (0.19 km s-1 at the line frequency). Both 500-MHz bands were centred at 48.82 GHz in order to profit the wideband capabilities of the backend, and search for other molecular lines. Pointing was regularly checked, and was found to be better than 6 arcsec. The Half Power Beam Width (HPBW) of the antenna at the observed frequency is 44 arcsec. Observations were done in position-switching mode, with a reference located 3.6 arcmin in azimuth.
Data were gathered on April 25, 2012, under good weather conditions; atmospheric opacity at the observed frequency was close to 0.1. The total on-source integration time was 46 minutes, and the system temperature was less than 180 K. Estimated rms noise level was 40 mK, on a main-beam temperature scale. Control of the wideband backend and synchronization of the whole observing processes were done using the SDAI software (Rizzo et al. 2012b). The gathered data were written into FITS files by SDAI, and were subsequently read and further processed using the CLASS software333CLASS is part of the GILDAS software, developed by the Institute de Radioastronomie Millimetrique (IRAM). See http://www.iram.fr/IRAMFR/GILDAS..
 |
 |
2.3 VLA archive data
We searched the VLA444The Very Large Array (VLA) is operated by the National Radio Astronomy Observatory (NRAO), a facility of the National Science Foundation operated under cooperative agreement by Associated Universities, Inc. archive for centimetre continuum observations toward I19520. I19520 was observed at 6 cm (4.8 GHz) on 27 November 2003 with the array in the B configuration (project AH832, Urquhart et al. 2009555The results of project AH832 are published in Urquhart et al. (2009), who report no detection in the field of I19520, with a rms noise of 0.16 m. However, in the cleaning process Urquhart et al. (2009) used a robust parameter of 0 and did not apply any tapering to the data. Thus, with the aim of recovering possible faint and extended structure we re-did the calibration and imaging using a robust parameter of 5 (to improve the sensitivity) and tapering the data.), and at 2 cm (14.9 GHz) on 17 September 1986 with the array in the CnB configuration (project AP121). For project AH832, the phase center of the observations was RA (2000)=19h54m0590 and Dec (J2000)=280741. The absolute flux scale was set by observing the quasar 1331+305 (3C286), for which we adopted a flux of 7.5 Jy at 6 cm. The quasar 2048+431, with a bootstrapped flux of 0.42 Jy, was observed regularly to calibrate the gains and phases. The total on-source time was 2.5 minutes. For project AP121, the phase center was RA (2000)=19h54m0540 and Dec (J2000)=2807376. The absolute flux scale was set by observing 3C286, with and adopted flux of 3.5 Jy at 2 cm; while the quasar 1923+210, with a bootstrapped flux of 1.8 Jy, was used to calibrate the gains and phases. The source was observed for 3.5 minutes. In both cases, the data reduction followed the VLA standard guidelines for calibration of high-frequency data (or high-angular resolution data), using the NRAO package AIPS. Final images were produced with the robust parameter of Briggs (1995) set to 5, corresponding to natural weighting, and applying a taper at 50 k with the aim of recovering faint extended emission. The final 1 rms noise levels are 0.1 mJy beam-1 at 6 cm, and 0.6 mJy beam-1 at 2 cm. The synthesized beams of the resulting images are with PA=89° at 6 cm, and with PA=82° at 2 cm.
 |
3 Results
3.1 OVRO 2.6 mm and VLA 6 cm continuum
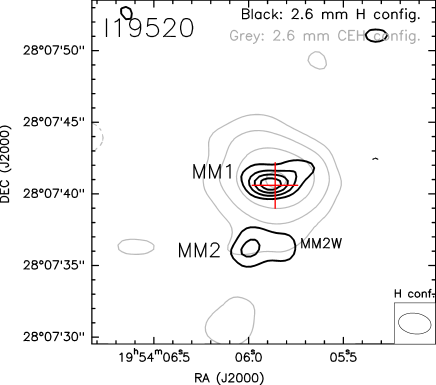
The 2.6 mm continuum emission toward I19520, after combining data from the 3 OVRO configurations, reveals one source in the field of view, which is slightly resolved, and whose peak position is coincident with the position of the infrared source (see Fig. 2 and Table 2). Imaging using only the H configuration data (providing the highest angular resolution) shows that the continuum emission splits up into at least two unresolved sources: one strong source detected at 14 (MM1) and one fainter source (MM2) about 4 arcsec to the south detected at , which has an elongation to the west (MM2W, Fig. 2). The parameters of the millimetre sources are listed in Table 2. For MM1, we measured a deconvolved size of AU, at PA=°. As for MM2, a double-gaussian fit for MM2 and MM2W was required to obtain a residual map with no excess of emission to the south of MM1, and both sources are unresolved.
The total mass of gas and dust from thermal continuum emission, assuming that the emission is optically thin, is:
| (1) |
where is the flux density at the frequency , is the distance to the Sun, is the Planck function at the dust temperature , and is the absorption coefficient per unit of total (gas+dust) mass density. Writing Eq. (1) in practical units:
| (2) |
where is in K, is in GHz, and is in cm2g-1. For the absorption coefficient at 115.27 GHz we used the extrapolated value from the tables of Ossenkopf & Henning (1994), for the case of thin ice mantles and density of 106 cm-3, of 0.003 cm2 g-1. Assuming of 50 K, the total mass estimated from the 2.6 mm continuum emission is around 100 for MM1, and 50, and 20 for MM2 and MM2W, respectively. The global properties of the millimetre source (from the C+E+H configuration) are listed in the last row of Table 2 and, by adopting a mean molecular weight of 2.8 mH, and a size (radius) of 13500 AU, we obatined an average density (of H2 molecules) of cm-3, H2 column density of cm-2, and mag666Note that among the 440 mag of visual extinction (derived from millimetre continuum data), only the half ( mag) are affecting the stellar light emitted towards the observer. (following Frerking, Langer, & Wilson 1982).
 |
 |
Concerning the VLA centimetre emission, we only detected one unresolved source at 9 about 40 arcsec to the southwest of MM1, as shown in Fig. 3. The flux density of this source (labeled ‘VLA1’) is mJy. At 2 cm we detected no source in the field shown in Fig. 3, preventing us from drawing any conclusion on the nature of VLA1. We also downloaded the most recent image at 6 cm of I19520, taken in 2008 within the framework of the CORNISH777http://www.ast.leeds.ac.uk/cornish/public/index.php survey (Hoare et al. 2012). In the I19520 region, the rms of the 6 cm image is 0.2 m, and we confirmed again the absence of any strong centimetre source associated with I19520.
3.2 OVRO 12CO, 13CO and C18O emission
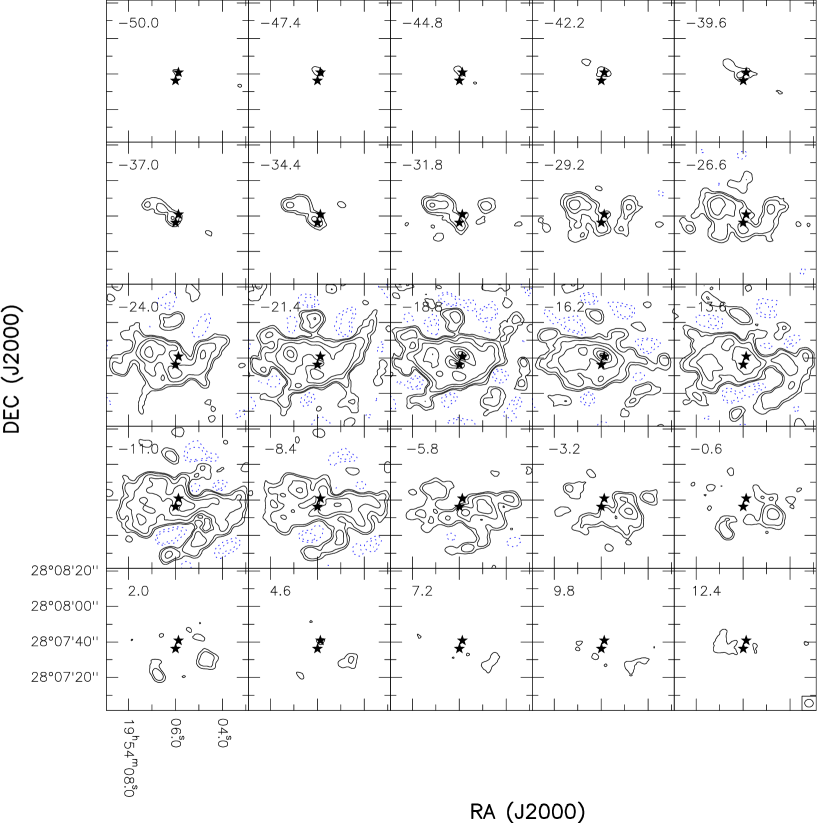
Fig. 4 shows the channel map of the 12CO(1–0) emission, spanning 60 km s-1 in total. The emission at high velocities is compact, mainly found to the northeast or to the southwest of MM1, while the emission around the systemic velocity ( km s-1) is much more complex and extends about arcmin, being mainly elongated in the east-west direction. In particular, channels at and km s-1 show an X-shape structure to the west of MM1 which could be tracing the cavity walls of an outflow.
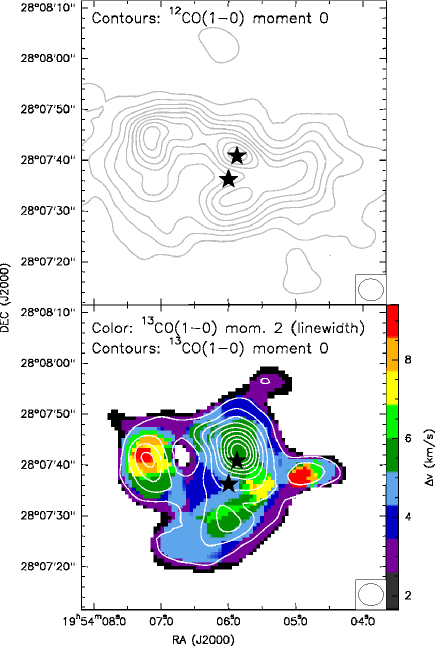
We computed the zero-order moment (integrated intensity) of the 12CO (1–0) emission for the entire velocity range (Fig. 5-top), which reveals three main 12CO clumps surrounded by extended emission: one associated with MM1, one about arcsec to the south, and the other arcsec to east (there is also a possible fourth clump to the west of MM1). These three clumps are well separated in the zero-order moment of the 13CO(1–0) emission, presented in Fig. 5-bottom. The 13CO moment-zero map (integrated over all the channels where 13CO is detected, from to km s-1) indicates that the strongest clump is the one associated with MM1, which was not obvious in the 12CO map probably due to opacity effects. The other fainter 13CO clumps show however the broadest linewidths, of up to 10 km s-1.
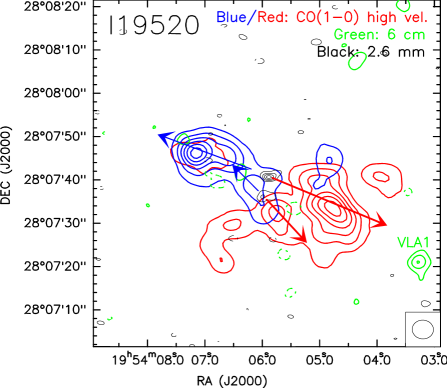
We additionally computed the zero-order moment for 12CO in the high velocity range, integrating from to km s-1 for the blueshifted emission, and from to 9.8 km s-1 for the redshifted emission, and the result is presented in Fig. 3. The figure shows that the emission is bipolar and elongated roughly in the east-west direction, consistent with a bipolar flow driven by MM1. Note that to the south of MM1 there is one blueshifted and one redshifted lobe to each side of MM2, suggesting that MM2 is driving also an outflow elongated in the southwest-northeast direction. Since the clumps detected in 13CO to the south, east and west of MM1 span a broad velocity range, they could be associated with outflow emission as well. It is worth noting that the polarized reflection nebula detected by Gledhill (2005) is located about 2 arcsec to the east of I19520, where the blueshifted high-velocity 12CO lobe is located, indicating that possibly the CO bipolar outflow is creating a cavity which is seen in polarized light. This is found in other YSOs where outflows have excavated bipolar cavities (e. g., Beckford et al. 2008).
 |
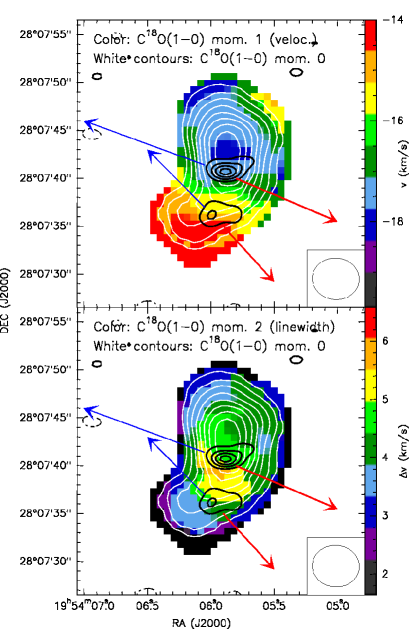
Finally, the C18O (1–0) emission, detected in the same velocities approximately as 13CO, is concentrated in one clump centred on MM1, with no clumpy emission in its surroundings. The zero-, first- (velocity field), and second-order (linewidth) moments for C18O are shown in Fig. 6. The integrated C18O emission is elongated roughly in the north-south direction, with the southern part slightly tilted to the east, suggesting that we are observing the superposition of two cores (one north-south, and another one smaller and elongated in the southeast-northwest direction). It is interesting to note that MM1 and MM2 lie at the center of these two C18O cores, and that the elongation of each of the two C18O cores is perpendicular to the corresponding outflows. The velocity field of C18O reveals that MM1 and MM2 are shifted by km s-1.
 |
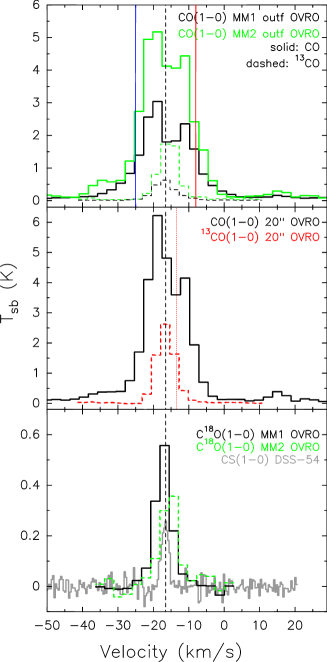 |
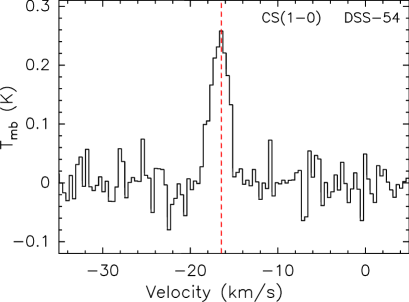
3.3 CS (1–0) with DSS-54 of Madrid DSCC
The CS (1–0) line was detected using the DSS-54 antenna of Madrid DSCC (see Fig. 7), and the results of a Gaussian fit to the line are listed in Table 3. The linewidth of the line is km s-1, which is completely dominated by non-thermal motions, even if we assume that the dense core is at 50 K. This broad linewidth could be produced either by turbulence injected by the outflow or by systemic motions such as rotation and/or infall. In fact, the line profile is asymmetric, with the blueshifted side being slightly stronger than the redshifted side. This is the expected profile for an optically thick line tracing an infalling envelope (e. g., Torrelles et al. 1995; Tsamis et al. 2008).
3.4 Spitzer at 24 m
We downloaded the Spitzer (Infrared Array Camera (IRAC) + MIPS) images of the I19520 field of view from the MIPSGAL (Carey et al. 2009) database888http://irsa.ipac.caltech.edu/data/SPITZER/MIPSGAL/. In Fig. 8 we show a superposition of the 12CO high-velocity OVRO emission on the 24 m colorscale of Spitzer/MIPS. The MIPS image reveals a structure with a bow-shock morphology about 7 arcmin to the west of I19520, whose tail is pointing towards I19520, suggesting wind/jet activity in the east-west direction as suggested also by the high-velocity 12CO outflow. Such a wind/jet activity is consistent with the P-Cygni profile seen in the H line of I19520, from which a maximum expansion velocity between 400 and 800 km s-1 is inferred (Sánchez Contreras et al. 2008). Using an average velocity of 600 km s-1, we estimate that the ejection event producing the bow shock took place about tan() yr ago (with the inclination with respect to the plane of the sky).
4 Analysis
4.1 Physical parameters from 12CO, 13CO, C18O for MM1 and MM2
In Fig. 9 we show the 12CO (1–0), 13CO (1–0), and C18O (1–0) spectra averaged in different regions. The results from a Gaussian fit for all but the 12CO transition are listed in Table 3 (corresponding to the spectra in the middle and bottom panels of Fig. 9), together with the derived opacities, , and column densities, . Opacities for 13CO and C18O were estimated from equation:
| (3) |
where is the intensity at the line center, is the excitation temperature, is the background tamperature (adopted 2.7 K), and (with being the Boltzmann constant, the temperature and the frequency). , of around 9 K, was estimated from 12CO assuming optically thick emission, and was found to be slightly smaller than the temperature obtained by Arquilla & Kwok (1987, 13 K). This difference is reasonable if we take into account the flux calibration uncertainties and the fact that Arquilla & Kwok (1987) observed with a single-dish antenna (with a HPBW of 45 arcsec) while we used the OVRO interferometer, being thus sensitive to different spatial scales (see below).
We derived the 12CO column density (from the 20 arcsec averaged spectrum) following Palau et al. (2007), and using the opacity derived from 13CO (1–0). The 13CO (1–0) column density was estimated with the equation:
| (4) |
which can be used for C18O(1–0) as well. The obtained column densities were around cm-2 for 13CO(1–0), and (2–3) cm-2 for C18O(1–0). As for the mass, we used the size listed in Table 3, adopted a mean molecular weight of 2.8, and abundances of (12CO)=, (13CO)=, and (C18O)= (Solomon, Sanders, & Scoville et al. 1979; Frerking, Langer, & Wilson 1982; Scoville et al. 1986). The final masses are around 80 including both MM1 and MM2 (from 13CO), and about 40 and 20 for MM1, and MM2, respectively (from C18O, for which we could separate the emission from MM1 and MM2).
The systemic velocity is found at km s-1 (measured from 13CO and CS), with MM2 being about 2 km s-1 redshifted with respect to MM1. The velocity is similar to that derived from H2O and OH maser (Engels et al. 1984; Lewis et al. 1985). The 12CO spectrum (Fig. 9-middle) shows a double-peaked profile which could be due in part to the filtering of emission at systemic velocities and/or self-absorption of the cold foreground cloud. This is expected because 12CO (1–0) is optically thick and traces gas of relatively low density ( cm-3). However, for opacity/filtering effects one would expect to see the maximum absorption at the systemic velocity, while this is not observed. In fact, the 12CO profile could be well explained if the material is infalling towards the central object, as the blueshifted 12CO peak (and wing) is stronger than the redshifted one, and the dip is redshifted by about 3 km s-1 with respect to the systemic velocity. Using the infall velocity derived from the 12CO absorption dip, an approximate range of radii associated with this infall velocity (3000–36000 AU, from the measured size of the millimetre source and the C18O clump, Tables 2 and 3), and the H2 column density derived from 13CO (Table 3), we estimated, following Beltrán et al. (2006), a mass infall rate of (0.8–2.6) yr-1.
| Area | b | Sizec | Mass | ||||||
|---|---|---|---|---|---|---|---|---|---|
| Transition | (K) | (km s-1) | (km s-1) | (K km s-1) | a | (cm-2) | (cm-2) | (arcsec) | () |
| 13CO(1–0) MM1+MM2 | 0.56 | 11 | 75 | ||||||
| C18O(1–0) MM1 | 0.10 | 8 | 36 | ||||||
| C18O(1–0) MM2 | 0.06 | 7 | 18 | ||||||
| CS (1–0) MM1+MM2 |
-
a
Opacity estimated from the intensity at the line center, and using an excitation temperature of 9.3 K (derived from 12CO for the optically thick case).
-
b
The adopted abundances are X(13CO)= (Solomon, Sanders, & Scoville 1979), and X(C18O)= (Frerking, Langer, & Wilson 1982).
-
c
FWHM.
| size | a | a | a | a | a | a | a | ||
|---|---|---|---|---|---|---|---|---|---|
| Lobe | (yr) | (arcsec) | (cm-2) | () | ( yr-1) | ( km s-1) | ( km s-1 yr-1) | (erg) | () |
| MM1-Red | 39000 | 0.54 | 13 | 0.45 | |||||
| MM1-Blue | 24000 | 0.38 | 13 | 1.1 | |||||
| MM1-All | 32000 | - | 0.92 | 26 | 1.6 | ||||
| MM2-Red | 20000 | 0.28 | 4 | 0.11 | |||||
| MM2-Blue | 9000 | 0.21 | 3 | 0.14 | |||||
| MM2-All | 14000 | - | 0.49 | 6 | 0.26 |
-
a
Parameters are calculated following Palau et al. (2007), for an inclination with respect to the plane of the sky equal to 45°, and are corrected for opacity using the 13CO spectrum (see main text). For MM1 we estimated an intensity in the line wings of 13CO of about 0.05 K (implying an opacity of 12CO of 0.02 and a correction of ). From the line peak of the 12CO spectrum, K, we estimated and excitation temperature of K, assuming optically thick emission. For MM2 we estimated an intensity in the line wings of 13CO of about 0.1 K (implying an opacity of 12CO of 0.03 and a correction of ). From the line peak of the 12CO spectrum, K, we estimated an excitation temperature of K, assuming optically thick emission. See Section 4.1.1 for further details.
4.1.1 Parameters of the 12CO outflows
Table 4 lists the parameters estimated for the MM1 and MM2 12CO(1–0) outflows, computed following Palau et al. (2007; see also notes in the table; we used the 12CO spectra shown in Fig. 9-top) and correcting for opacity effects. For the outflow inclination (with respect to the plane of the sky), , we adopted an intermediate angle of 45°, consistent with the bipolar outflow morphology.
The dynamical times of the MM1 and MM2 outflows are in the range 14000–32000 yr. In particular, the dynamical time of the outflow driven by MM1, of around 32000 yr, is very similar to the estimated timescale for the ejection event which produced the bow shock seen at 24 m about 7 arcmin to the west of I19520 (see Fig. 8 and Section 3.4), reinforcing that I19520 probably had a recent and powerful ejection event. In fact, if the bow-shock is indeed driven by I19520, this would be one of the longest jets known to date, extending for cos() pc, similar to or even larger than the recently published updated length of the HH80-81 jet (Masqué et al. 2012). As for the other outflow parameters, they are slightly smaller than the single-dish outflow parameters derived by Arquilla & Kwok (1987, see their Table 2). This was expected because the interferometer filters out the most extended emission. For the case of our OVRO observations, using the minimum -distance (see Section 2) and following Palau et al. (2010), we estimated that OVRO was filtering structures larger than . From the 12CO(1–0) single-dish observations, Arquilla & Kwok (1987) estimate a total flux integrated over all the velocity range (single-point observations) of 1890 Jy km/s, and for the OVRO data we estimate (integrating both spectrally and spatially) 870 Jy km s-1. Thus OVRO is recovering 46% of the single-dish flux, or missing a flux of 54%.
In order to estimate the collimation factor of the outflow driven by MM1 (i. e., excluding the outflow lobes of MM2), we followed the method used in Bally & Lada (1983) and Wu et al. (2004), where the collimation factor is the ratio of the major to minor radii of the outflow considered as an ellipsoid. By fitting a Gaussian to the redshifted lobe and another Gaussian to the blueshifted lobe, we obtained the minimum radius, of about 7 arcsec (deconvolved minor size of the gaussian fit), and the maximum radius was estimated from the total length of arcsec. This yields a collimation factor of 5.7, which is among the most high collimation factors measured in outflows driven by very luminous ( ) YSOs, either using single-dish telescopes (e. g., Wu et al. 2004; Qiu et al. 2011) or interferometer arrays (e. g., Cesaroni et al. 1999; Gibb et al. 2003; Beuther, Schilke, & Gueth 2004; Kumar, Tafalla & Bachiller 2004; Brooks et al. 2007; Zhang et al. 2007; Qiu et al. 2007; 2009, 2012; Zapata et al. 2009a, 2011; Masqué et al. 2012).
 |
4.2 Spectral Energy Distribution
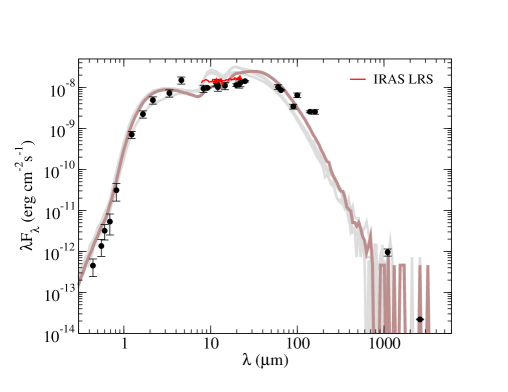
We built the Spectral Energy Distribution (SED) by compiling data from 2MASS (Skrutskie et al. 2006), WISE (Wright et al. 2010), Akari (Murakami et al. 2007), IRAS (Neugebauer et al. 1984), Midcourse Space EXperiment (MSX, Egan et al. 2003), Bolocam (Rosolowsky et al. 2010, Aguirre et al. 2011), and OVRO (this work). The global SED, shown in Fig. 10, has a flat spectrum from 3 to 100 m. In addition, we included optical photometry at 0.6 and 0.8 m extracted from Hubble Space Telescope images of I19520999I19520 was imaged with the ACS/HRC instrument in the F606W and F814W broad band filters as part of a survey for candidate pre-planetary nebulae (GO 9463: Sahai et al. 2007), and appeared to be starlike in these images., and we also downloaded the IRAS Low Resolution Spectrometer (LRS) spectra101010IRAS Science Team (1986); for further deatils on LRS spectra, see http://irsa.ipac.caltech.edu/IRASdocs/exp.sup/; to download the spectrum we used VizieR, Ochsenbein et al. (2000). of I19520 (7.7–22.6 m). The LRS spectrum of I19520 is classified by Kwok, Volk, & Bidelman (1997) as ‘unusual’, indicating a flat continuum spectrum with unusual features. The spectrum is quite noisy from 11 m on, and shows no evidence of any silicate feature, apart from a very faint possible absorption at 9.7 m, with a weak peak at shorter wavelengths. A weak silicate absorption with a weak peak at 8.5 m has also been found in other massive YSOs (e. g., Chen, Wang, & He 2000; Campbell et al. 2006). New higher sensitivity observations should be carried out to properly study the spectral features of I19520 in this wavelength range.
We have fitted the I19520 SED using the online tool provided by Robitaille et al. (2007), which computes least-squares fits of pre-computed models of YSOs having discs and rotationally-flattened infalling envelopes (with biconical outflow cavities), to user-defined SEDs. We note that the parameters of the best-fit models of the online tool must be regarded with caution, as recent work confronting the online tool results with spatial information data (e. g., Linz et al. 2009; de Wit et al. 2010, 2011) indicate that the spatial information is required to break the degeneracy inherent to some of the online tool output parameters and to overcome the limited sampling of the parameter space (see Robitaille 2008; Linz et al. 2009; Offner et al. 2012). Thus, we use the on-line SED fitting tool of Robitaille et al. (2007) as a first approach to the main properties of I19520.
We set the input distance range to kpc. The input interstellar extinction range was set to , based on our estimate of using the numerical algorithm provided by Hakkila et al. (1997), which computes the 3-dimensional visual interstellar extinction and its error from inputs of Galactic longitude, latitude, and distance, from a synthesis of several published studies. The best-fit model has D=8.7 kpc, , a central star with mass , effective temperature K, luminosity , and age yr; a central disc mass , and an envelope mass . In this model, the (half) opening angle of the bipolar outflow cavity is °, and the outflow cavity axis is inclined at an angle of ° to the plane of the sky. See Table 5 for the ranges of fitted values for the next three best-fit models. These models provide a good fit of the SED out to the far-infrared wavelengths. But at millimetre wavelengths, the models (based on a Monte Carlo code) do not have enough S/N, hence we are not able to make a comparison of the model and data for these wavelengths. The circumstellar extinction is in the best fit model, and lies in the range 3.1–4.1 for the next three best-fit models. This makes a total (foreground + circumstellar) of mag for the best fit model.
| Best fit | Range of | |
| Parameter | values | valuesa |
| Distance (kpc) | 8.7 | 8.7–9.5 |
| b (mag) | 4.4 | 3.0–3.8 |
| () | 29 | 26–33 |
| (K) | 39990 | 38650–41500 |
| () | (1.0–1.9) | |
| Age (yr) | 61000 | (1.1–2.2) |
| () | 0.3 | 0.5–2 |
| () | 138 | 52–82 |
| Envelope outer radius (AU) | 105 | 105 |
| Outflow opening angle (°) | 31 | 13–27 |
| Outflow inclination (°)c | 59 | 59–72 |
-
a
Range of values for the three next best fits.
-
b
Foreground interstellar extinction.
-
c
Outflow inclination with respect to the plane of the sky.
5 Discussion
5.1 Comparison of the molecular gas and dust envelope properties of IRAS 19520+2759 with other massive YSOs
In previous sections we have shown that the OVRO observations reveal a strong dust condensation, referred to as MM1, with a total mass of around 100 , and which is driving a high-velocity collimated 12CO (1–0) outflow. The parameters of the outflow driven by MM1, if compared to those of outflows driven by high-mass YSOs, fit reasonably well the value expected for a massive YSO of (e. g., Wu et al. 2004; López-Sepulcre et al. 2009), after applying a factor of to account for the 54% of flux filtered out by OVRO (the works reporting correlations of outflow parameters use single-dish data and thus are sensitive to the most extended emission, which has been filtered out by OVRO).
To further compare the I19520 envelope properties with previous works, we estimated the mass of the cloud associated with I19520 by using the Bolocam image (Rosolowsky et al. 2010; Aguirre et al. 2011, see Fig. 1), for which we measured a flux density at 1.1 mm of 0.7 Jy, corresponding to 360–610 , for a dust temperature in the range 20–30 K and using the opacity law of Ossenkopf & Henning (1994, cm2 g-1 at 1.1 mm). This cloud mass and the CS (1–0) linewidth that we have measured (Table 3) are consistent with the correlation found by Beuther et al. (2002) for a sample of high-mass protostellar objects. Similarly, the 13CO(1–0) linewidth that we have measured follows the correlation with the bolometric luminosity found by Liu et al. (2010) for a sample of 98 massive YSOs.
Finally, we plotted the values of the cloud mass and the measured bolometric luminosity on the mass-luminosity plot of Sridharan et al. (2002) and Molinari et al. (2008), and the values follow well the trend for massive YSOs. In particular, figure 9 of Molinari et al. (2008) indicates that I19520 probably is in a transition stage between actively accreting objects and the ‘envelope clean-up’ phase. This is consistent with the fact that different methods used to estimate yield significantly different results, suggesting a non-homogenous density structure in the envelope and possibly the presence of holes and cavities. From the millimetre continuum emission we derived, assuming an homogeneous density distribution, mag (Section 3.1). This is about one order of magnitude larger than the estimated from the fit to the SED (total is , Section 4.2), and from the optical spectrum (ratio of H to H yields mag, Sánchez Contreras, in prep.), which are both along the line of sight. Overall, I19520 is probably in a phase of main accretion and simultaneous start of envelope disruption as the jet interacts with the envelope creating a cavity. Examples of massive YSOs reported in the literature driving outflows and with hints of simultaneous envelope disruption are IRAS 05506+2414 (Sahai et al. 2008) and V645 Cyg (Hamann & Persson 1989; Clarke et al. 2006; Miroshnichenko et al. 2009), with I19520 being more luminous, and embedded in a one order of magnitude more massive envelope.
5.2 The central star of IRAS 19520+2759
The agreement between the position of the optical/infrared source and the millimetre source suggests that they are tracing the same object. The position of the 2MASS source is RA(J2000): 19:54:05.86, Dec (J2000): +28:07:40.6. The position of MM1 (Table 2) is offset with respect to the 2MASS position by (+0.15, +0.27) arcsec, which falls well within the OVRO ( arcsec) and 2MASS ( arcsec, Skrutskie et al. 2006) positional uncertainties. In addition, the preliminary analysis of the optical spectrum of I19520 presented in Sánchez Contreras et al. (2008) points to a hot object photoionizing the circumstellar gas and driving a dense and compact wind. Thus, the properties of both the optical source and the millimetre source indicate that we are dealing with a young and massive object.
Further hints on the nature of the optical source may come from the non-detection of centimetre emission: if the central star was a (main-sequence) O9 star with a typical ionizing flux s-1 (e. g., Panagia 1973; Smith, Norris & Crowther 2002), the expected 6 cm flux density from an optically thin HII region, with an electron temperature of K and placed at a distance of 9 kpc, would be mJy, which should have been well detected with the VLA observations (Section 2.3)111111If we assume optically thick emission, the 6 cm upper limit can only be reproduced with an O-type star if the free-free emission comes from a region of very small size ( AU) and large electron density ( cm-3), which is very unlikely because such a small size (typical of hyper-compact HII regions, e. g., Kurtz 2005) would require a very dense envelope strongly infalling and quenching the ionized gas (e. g., Walmsley 1995; Molinari et al. 1998), preventing the object to be detected in the optical (e. g., G10.60.4: Sollins & Ho 2005; G28.200.05: Sollins et al. 2005; NGC 7538-IRS1: Sandell et al. 2009).. If the spectral type is B1 (or later), the non-detection of the 6 cm emission is naturally explained, as the flux of ionizing photons in this case is smaller than for the O9 case by one–two orders of magnitude.
5.3 IRAS 19520+2759: a B-type star becoming an O-type star?
As discussed above, the centimetre properties of I19520 are most consistent with an early-B type classification for the central star; however, the spectral type inferred from its high luminosity, , assuming it is a zero-age-main-sequence star, is significantly earlier, O6–O7 (e. g., Bernasconi & Maeder 1996; Martins et al. 2005). The properties of I19520 can be reconciled if the object is accreting, which is strongly suggested by several observational facts: i) the infrared source is associated with a compact and dusty envelope, MM1, of ; ii) MM1 is driving a high-velocity collimated outflow with a dynamical timescale of yr; and iii) the OVRO C18O(1–0) emission, with a size of AU, is elongated perpendicular to the outflow, similar to the molecular toroids found in other massive star-forming regions (e. g., Beltrán et al. 2005, 2011; Beuther et al. 2007b; Zapata, Tang, & Leurini 2010; Furuya et al. 2011), which usually show a rotation velocity pattern. All this suggests that I19520 has been recently undergoing active accretion.
Hoare & Franco (2007) have proposed, and numerical simulations have shown (e. g., Yorke & Bodenheimer 2008; Hosokawa & Omukai 2009; Hosokawa, Yorke, & Omukai 2010), that the main effect of accretion onto a massive star (with mass accretion rates up to 10-3 yr-1), regardless of the geometry of the accretion, is an increase of the stellar radius, giving rise to the so-called ‘swollen’ or ‘bloated’ stars. The ‘swollen-star’ scenario naturally explains the low ionizing flux observed in I19520, even though with a bolometric luminosity of . In this scenario, the stellar radius attains its maximum value when the star has accreted (Hosokawa, Yorke, & Omukai 2010). Assuming that this is the current value of the stellar mass of I19520, and given the mass measured for the envelope of (Section 3), the total mass which could still be accreted onto the star, for a star formation efficiency of about –20%, is 10–20 , implying a final stellar mass of 20–30 , which corresponds to an O-type star.
The ‘swollen-star’ scenario has also been proposed for other massive YSOs. Davies et al. (2011) require a ‘swollen-star’ phase to reproduce the observed luminosity distribution of massive YSOs in the sample of the Red MSX Source survey (RMS, e. g., Urquhart et al. 2008; see also Mottram et al. 2011); Simpson et al. (2012) and Bik et al. (2012) explain the low effective temperatures or offsets from main-sequence in the Hertzsprung Russell diagram by invoking a ‘swollen-star’ phase for the massive YSOs of G333.2 or W3 Main complexes. Finally, individual objects studied in detail within the ‘swollen-star’ scenario are B275 (Ochsendorf et al. 2011), M8E-IR (Linz et al. 2009), CRL 2136 (de Wit et al. 2011), and Orion KL IRc2 (Morino et al. 1998; Testi, Tan, & Palla 2010). I19520, with a bolometric luminosity around 105 , would be the most luminous of the four aforementioned ‘swollen-star’ candidates. Accurate spectral type classification of the central star through, e. g., optical spectroscopy in the 4000–5000 Å range, is needed to firmly establish the ‘swollen’ star hypothesis proposed for I19520.
6 Conclusions
We present the results of OVRO observations at 2.6 mm and 12CO (1–0), 13CO (1–0), and C18O (1–0) transitions, as well as observations of CS (1–0) with the 34 m antenna DSS-54 of Madrid DSCC, towards IRAS 19520+2759, a very bright infrared object embedded in a massive cloud. Our main conclusions can be summarized as follows:
-
-
The 2.6 mm continuum emission is dominated by one strong millimetre source, MM1, clearly associated with the bright infrared source, and which is only barely resolved, with a size of AU, PA=°, and a mass of . About 4 arcsec to the south there is a fainter and unresolved source, MM2, of about .
-
-
Both MM1 and MM2 are driving high-velocity 12CO outflows, with outflow parameters typical of massive YSOs, and the outflow driven by MM1 shows a high collimation factor. In addition, both MM1 and MM2 are associated with 13CO and C18O emission, whose structure, especially for C18O, is elongated perpendicularly to the outflow directions, similar to toroids seen in other massive star-forming regions.
-
-
The CS line profile indicates that the object is embedded in dense gas with important contributions of non-thermal motions.
-
-
We fitted the SED of MM1 using the SED fitting tool of Robitaille et al. (2007). The best fit yields a foreground extinction of 4.4 mag, an envelope mass of 140 , and a bolometric luminosity of . For this bolometric luminosity one would expect that the star should emit an ionizing flux high enough to detect the free-free emission at centimetre wavelengths. However, no source associated with IRAS 19520+2759 is detected at 6 cm, with a rms noise of 0.1 mJy, which could be due to on-going accretion onto the star.
Thus, we present evidence that IRAS 19520+2759 is a luminous YSO embedded in a massive and dense envelope, which is driving a collimated outflow and does not show strong centimetre emission. We propose that this could be an example of a ‘swollen’ or ‘bloated’ star as proposed by Hosokawa, Yorke, & Omukai (2010), where accretion produces an increase of the stellar radius, and a decrease of effective temperature and ionizing flux. Overall, IRAS 19520+2759 seems to be an excellent accreting massive YSO candidate which could form an O-type star in the future.
Acknowledgments
The authors are grateful to the anonymous referee for valuable comments significantly improving the quality of the paper. AP is grateful to Tom Landecker and Roland Kothes for kindly providing the 21 cm CGPS images, and to Josep Miquel Girart for insightful comments on the paper; RS acknowledges useful discussions with Harold Yorke and Takashi Hosokawa. The Madrid DSCC observations have been done under the Host Country program; the authors acknowledge the kind support of the Robledo staff during such observations. AP is supported by the Spanish MICINN grant AYA2008-06189-C03 (co-funded with FEDER funds) and by a JAE-Doc CSIC fellowship co-funded with the European Social Fund. This work has been partially performed at the Astrophysics Department of the Astrobiology Center (CAB, CSIC/INTA) and the California Institute of Technology and has been partially supported by the Spanish MICINN through grants AYA2009-07304 and CONSOLIDER INGENIO 2010 for the team ‘Molecular Astrophysics: The Herschel and Alma Era – ASTROMOL’ (ref.: CSD2009-00038). Ongoing development and operations for OVRO and CARMA are supported by the National Science Foundation under a cooperative agreement (grant AST 08-38260). RS thanks NASA for partially funding this work by NASA LTSA and ADP awards (nos. NMO710651/ 399-20-40-06 & 399-20-40-08); RS also received partial support for this work from HST/GO awards (nos. GO-09463.01, 09801.01, and 10185.01) from the Space Telescope Science Institute (operated by the Association of Universities for Research in Astronomy, under NASA contract NAS5-26555). This research has made use of the SIMBAD database, operated at CDS, Strasbourg, France, the NASA’s Astrophysics Data System, Aladin, AKARI observations, a JAXA project with the participation of ESA; the Wide-field Infrared Survey Explorer, which is a joint project of the University of California, Los Angeles, and the Jet Propulsion Laboratory/California Institute of Technology, funded by NASA; the Two Micron All Sky Survey, which is a joint project of the University of Massachusetts and the Infrared Processing and Analysis Center/California Institute of Technology, funded by NASA and the National Science Foundation (NSF); the Midcourse Space Experiment, for which processing of the data was funded by the Ballistic Missile Defense Organization with additional support from NASA Office of Space Science; the NASA/ IPAC Infrared Science Archive, which is operated by the Jet Propulsion Laboratory, California Institute of Technology, under contract with NASA; and the Bolocam Galactic Plane Survey, made using Bolocam on the Caltech Submillimeter Observatory, operated by Caltech under a contract from the NSF. Support for the development of Bolocam was provided by NSF grants AST-9980846 and AST-0206158.
References
- [\citeauthoryearAguirre et al.2011] Aguirre J. E., et al., 2011, ApJS, 192, 4
- [\citeauthoryearArquilla & Kwok1987] Arquilla R., Kwok S., 1987, A&A, 173, 271
- [\citeauthoryearBally & Lada1983] Bally J., Lada C. J., 1983, ApJ, 265, 824
- [Beckford et al.(2008)] Beckford A. F.,Lucas P. W., Chrysostomou A. C., Gledhill T. M., 2008, MNRAS, 384, 907
- [\citeauthoryearBeltrán et al.2001] Beltrán M. T., Estalella R., Anglada G., Rodríguez L. F., Torrelles J. M., 2001, AJ, 121, 1556
- [\citeauthoryearBeltrán et al.2005] Beltrán M. T., Cesaroni R., Neri R., Codella C., Furuya R. S., Testi L., Olmi L., 2005, A&A, 435, 901
- [] Beltrán, M. T., et al. 2006, Nature, 443, 427
- [\citeauthoryearBeltrán et al.2011] Beltrán M. T., Cesaroni R., Neri R., Codella C., 2011, A&A, 525, A151
- [\citeauthoryearBernasconi & Maeder1996] Bernasconi P. A., Maeder A., 1996, A&A, 307, 829
- [Beuther & Shepherd (2005)] Beuther H., Shepherd D. in Cores to Clusters: Star Formation with Next Generation Telescopes, M.S. Nanda Kumar, M. Tafalla, P. Caselli eds. Astrophysics and Space Science Library, Vol. 324, pp. 105-119, 2005 Springer New York
- [\citeauthoryearBeuther & Walsh2008] Beuther H., Walsh A. J., 2008, ApJ, 673, L55
- [\citeauthoryearBeuther, Schilke, & Gueth2004] Beuther H., Schilke P., Gueth F., 2004, ApJ, 608, 330
- [\citeauthoryearBeuther et al.2002] Beuther H., Schilke P., Menten K. M., Motte F., Sridharan T. K., Wyrowski F., 2002, ApJ, 566, 945
- [\citeauthoryearBeuther et al.2007a] Beuther H., Zhang Q., Bergin E. A., Sridharan T. K., Hunter T. R., Leurini S., 2007a, A&A, 468, 1045
- [\citeauthoryearBeuther et al.2007b] Beuther H., Zhang Q., Hunter T. R., Sridharan T. K., Bergin E. A., 2007b, A&A, 473, 493
- [\citeauthoryearBik et al.2012] Bik A., et al., 2012, ApJ, 744, 87
- [\citeauthoryearBlitz, Fich, & Stark1982] Blitz L., Fich M., Stark A. A., 1982, ApJS, 49, 183
- [\citeauthoryearBriggs1995] Briggs, D. S. 1995, PhD Thesis, The New Mexico Institute of Mining and Technology
- [\citeauthoryearBrooks et al.2007] Brooks K. J., Garay G., Voronkov M., Rodríguez L. F., 2007, ApJ, 669, 459
- [\citeauthoryearCampbell et al.2006] Campbell M. F., et al., 2006, AAS, 38, 971
- [\citeauthoryearCarey et al.2009] Carey S. J., et al., 2009, PASP, 121, 76
- [\citeauthoryearCesaroni et al.1999] Cesaroni R., Felli M., Jenness T., Neri R., Olmi L., Robberto M., Testi L., Walmsley C. M., 1999, A&A, 345, 949
- [\citeauthoryearCesaroni et al.2010] Cesaroni R., Hofner P., Araya E., Kurtz S., 2010, A&A, 509, A50
- [\citeauthoryearCesaroni et al.2011] Cesaroni R., Beltrán M. T., Zhang Q., Beuther H., Fallscheer C., 2011, A&A, 533, A73
- [\citeauthoryearChen, Wang, & He2000] Chen P. S., Wang X. H., He J. H., 2000, Ap&SS, 271, 259
- [\citeauthoryearClarke et al.2006] Clarke A. J., Lumsden S. L., Oudmaijer R. D., Busfield A. L., Hoare M. G., Moore T. J. T., Sheret T. L., Urquhart J. S., 2006, A&A, 457, 183
- [\citeauthoryearDavies et al.2010] Davies B., Lumsden S. L., Hoare M. G., Oudmaijer R. D., de Wit W.-J., 2010, MNRAS, 402, 1504
- [\citeauthoryearDavies et al.2011] Davies B., Hoare M. G., Lumsden S. L., Hosokawa T., Oudmaijer R. D., Urquhart J. S., Mottram J. C., Stead J., 2011, MNRAS, 416, 972
- [\citeauthoryearde Wit et al.2010] de Wit W. J., Hoare M. G., Oudmaijer R. D., Lumsden S. L., 2010, A&A, 515, A45
- [\citeauthoryearde Wit et al.2011] de Wit W. J., Hoare M. G., Oudmaijer R. D., Nürnberger D. E. A., Wheelwright H. E., Lumsden S. L., 2011, A&A, 526, L5
- [\citeauthoryearEgan, Price, & Kraemer2003] Egan M. P., Price S. D., Kraemer K. E., 2003, AAS, 35, 1301
- [\citeauthoryearEngels et al.1984] Engels D., Habing H. J., Olnon F. M., Schmid-Burgk J., Walmsley C. M., 1984, A&A, 140, L9
- [\citeauthoryearFranco-Hernández et al.2009] Franco-Hernández R., Moran J. M., Rodríguez L. F., Garay G., 2009, ApJ, 701, 974
- [\citeauthoryearFrerking, Langer, & Wilson1982] Frerking M. A., Langer W. D., Wilson R. W., 1982, ApJ, 262, 590
- [\citeauthoryearFuruya, Cesaroni, & Shinnaga2011] Furuya R. S., Cesaroni R., Shinnaga H., 2011, A&A, 525, A72
- [\citeauthoryearGibb et al.2003] Gibb A. G., Hoare M. G., Little L. T., Wright M. C. H., 2003, MNRAS, 339, 1011
- [\citeauthoryearGledhill2005] Gledhill T. M., 2005, MNRAS, 356, 883
- [Habing & Olnon(1984)] Habing, H. J., and Olnon, F.M. 1984, , 308, 114
- [\citeauthoryearHakkila et al.1997] Hakkila J., Myers J. M., Stidham B. J., Hartmann D. H., 1997, AJ, 114, 2043
- [\citeauthoryearHamann & Persson1989] Hamann F., Persson S. E., 1989, ApJ, 339, 1078
- [\citeauthoryearHoare & Franco2007] Hoare M. G., Franco J., 2007, in Diffuse Matter from Star Forming Regions to Active Galaxies - A Volume Honouring John Dyson, Edited by T.W. Hartquist, J. M. Pittard, and S. A. E. G. Falle. Series: Astrophysics and Space Science Proceedings. Springer Dordrecht, 2007, p.61, arXiv 0711.4912
- [\citeauthoryearHoare et al.2012] Hoare M. G., et al., 2012, PASP, arXiv:1208.3351
- [\citeauthoryearHrivnak, Kwok, & Boreiko1985] Hrivnak B. J., Kwok S., Boreiko R. T., 1985, ApJ, 294, L113
- [\citeauthoryearHosokawa & Omukai2009] Hosokawa T., Omukai K., 2009, ApJ, 691, 823
- [\citeauthoryearHosokawa, Yorke, & Omukai2010] Hosokawa T., Yorke H. W., Omukai K., 2010, ApJ, 721, 478
- [] IRAS Science Team, 1986, A&AS, 65, 607
- [\citeauthoryearJiang et al.2008] Jiang Z., Tamura M., Hoare M. G., Yao Y., Ishii M., Fang M., Yang J., 2008, ApJ, 673, L175
- [\citeauthoryearJiménez-Serra et al.2012] Jiménez-Serra I., Zhang Q., Viti S., Martín-Pintado J., de Wit W.-J., 2012, ApJ, 753, 34
- [\citeauthoryearKerr & Lynden-Bell1986] Kerr F. J., Lynden-Bell D., 1986, MNRAS, 221, 1023
- [\citeauthoryearKeto2002] Keto E., 2002, ApJ, 580, 980
- [\citeauthoryearKeto2003] Keto E., 2003, ApJ, 599, 1196
- [Keto (2007)] Keto E., 2007, ApJ, 666, 976
- [\citeauthoryearKothes et al.2006] Kothes R., Fedotov K., Foster T. J., Uyanıker B., 2006, A&A, 457, 1081
- [\citeauthoryearKraus et al.2010] Kraus S., et al., 2010, Natur, 466, 339
- [\citeauthoryearKrumholz et al.2009] Krumholz M. R., Klein R. I., McKee C. F., Offner S. S. R., Cunningham A. J., 2009, Sci, 323, 754
- [\citeauthoryearKuiper et al.2010] Kuiper R., Klahr H., Beuther H., Henning T., 2010, ApJ, 722, 1556
- [\citeauthoryearKuiper et al.2011] Kuiper R., Klahr H., Beuther H., Henning T., 2011, ApJ, 732, 20
- [\citeauthoryearKumar, Tafalla, & Bachiller2004] Kumar M. S. N., Tafalla M., Bachiller R., 2004, A&A, 426, 195
- [\citeauthoryearKurtz2005] Kurtz S., 2005, in Cesaroni, R., Felli, M., Churchwell, E., Walmsley, M., eds., Proc. IAU Symp. 227, Massive star birth: A crossroads of Astrophysics. Cambridge University Press, Cambridge, p. 111
- [\citeauthoryearKwok, Volk, & Bidelman1997] Kwok S., Volk K., Bidelman W. P., 1997, ApJS, 112, 557
- [\citeauthoryearLandecker, Purton, & Clutton-Brock1990] Landecker T. L., Purton C. R., Clutton-Brock M., 1990, A&A, 232, 207
- [\citeauthoryearLewis, Eder, & Terzian1985] Lewis B. M., Eder J., Terzian Y., 1985, Natur, 313, 200
- [\citeauthoryearLinz et al.2009] Linz H., et al., 2009, A&A, 505, 655
- [\citeauthoryearLiu, Wu, & Wang2010] Liu T., Wu Y.-F., Wang K., 2010, RAA, 10, 67
- [\citeauthoryearLópez-Sepulcre et al.2009] López-Sepulcre A., Codella C., Cesaroni R., Marcelino N., Walmsley C. M., 2009, A&A, 499, 811
- [\citeauthoryearMartins, Schaerer, & Hillier2005] Martins F., Schaerer D., Hillier D. J., 2005, A&A, 436, 1049
- [] Masqué J. M., Girart, J. M., Estalella, R., Rodríguez L. F., Beltrán, M. T. 2012, ApJ, 758, L10
- [\citeauthoryearMiroshnichenko et al.2009] Miroshnichenko A. S., et al., 2009, A&A, 498, 115
- [Molinari et al. (1998)] Molinari S., Brand J., Cesaroni R., Palla F., Palumbo G. G. C., 1998, A&A, 336, 339
- [\citeauthoryearMolinari et al.2008] Molinari S., Pezzuto S., Cesaroni R., Brand J., Faustini F., Testi L., 2008, A&A, 481, 345
- [\citeauthoryearMorino et al.1998] Morino J.-I., Yamashita T., Hasegawa T., Nakano T., 1998, Natur, 393, 340
- [\citeauthoryearMottram et al.2011] Mottram J. C., et al., 2011, ApJ, 730, L33
- [\citeauthoryearMurakami et al.2007] Murakami H., et al., 2007, PASJ, 59, 369
- [\citeauthoryearNakashima & Deguchi2003] Nakashima J.-I., Deguchi S., 2003, PASJ, 55, 229
- [\citeauthoryearNaranjo-Romero et al.2012] Naranjo-Romero R., Zapata L. A., Vázquez-Semadeni E., Takahashi S., Palau A., Schilke P., 2012, ApJ, 757, 58
- [\citeauthoryearNeugebauer et al.1984] Neugebauer G., et al., 1984, ApJ, 278, L1
- [] Ochsenbein F., Bauer P., Marcout J. 2000, A&AS 143, 221
- [\citeauthoryearOchsendorf et al.2011] Ochsendorf B. B., Ellerbroek L. E., Chini R., Hartoog O. E., Hoffmeister V., Waters L. B. F. M., Kaper L., 2011, A&A, 536, L1
- [\citeauthoryearOffner et al.2012] Offner S. S. R., Robitaille T. P., Hansen C. E., McKee C. F., Klein R. I., 2012, ApJ, 753, 98
- [Ossenkopf & Henning(1994)] Ossenkopf, V., & Henning, Th. 1994, A&A, 291, 943
- [Palau et al.(2007b)] Palau, A., Estalella, R., Ho, P.T.P., Beuther, H., Beltrán, M.T. 2007, A&A, 474, 911
- [Palau et al.(2010)] Palau, A., Sánchez-Monge, Á., Busquet, G., et al. 2010, A&A, 510, A5
- [\citeauthoryearQiu et al.2007] Qiu K., Zhang Q., Beuther H., Yang J., 2007, ApJ, 654, 361
- [\citeauthoryearQiu et al.2009] Qiu K., Zhang Q., Wu J., Chen H.-R., 2009, ApJ, 696, 66
- [\citeauthoryearQiu et al.2011] Qiu K., Wyrowski F., Menten K. M., Güsten R., Leurini S., Leinz C., 2011, ApJ, 743, L25
- [\citeauthoryearQiu et al.2012] Qiu K., Zhang Q., Beuther H., Fallscheer C., 2012, arXiv, arXiv:1207.4817
- [\citeauthoryearRizzo et al.2012a] Rizzo J. R., et al., 2012a, A&A, 542, A63
- [\citeauthoryearRizzo et al.2012b] Rizzo, J. R., Gutiérrez, M., Kuiper, T. B. H., Cernicharo, J., Sotuela, I., and Pedreira, A., 2012b, in Radziwill, N. M. and Chiozzi, G., eds., Proc. SPIE 8451, Software and Cyberinfrastructure for Astronomy II. SPIE, Washington, p. 84512D
- [\citeauthoryearRobitaille2008] Robitaille T. P., 2008, ASPC, 387, 290
- [\citeauthoryearRobitaille et al.2007] Robitaille T. P., Whitney B. A., Indebetouw R., and Wood K. 2007, ApJS, 169, 328
- [\citeauthoryearRosolowsky et al.2010] Rosolowsky E., et al., 2010, ApJS, 188, 123
- [\citeauthoryearSahai et al.2007] Sahai R., Morris M., Sánchez Contreras C., Claussen M., 2007, AJ, 134, 2200
- [\citeauthoryearSahai et al.2008] Sahai, R., Claussen, M., Sánchez Contreras, C., Morris, M. & Sarkar, G. 2008, ApJ, 680, 483
- [\citeauthoryearSánchez Contreras et al.2008] Sánchez Contreras C., Sahai R., Gil de Paz A., Goodrich R., 2008, ApJS, 179, 166
- [\citeauthoryearSandell et al.2009] Sandell G., Goss W. M., Wright M., Corder S., 2009, ApJ, 699, L31
- [\citeauthoryearSault, Teuben, & Wright1995] Sault R. J., Teuben P. J., Wright M. C. H., 1995, ASPC, 77, 433
- [\citeauthoryearScoville et al.1986] Scoville N. Z., Sargent A. I., Sanders D. B., Claussen M. J., Masson C. R., Lo K. Y., Phillips T. G., 1986, ApJ, 303, 416
- [\citeauthoryearScoville et al.1993] Scoville N. Z., Carlstrom J. E., Chandler C. J., Phillips J. A., Scott S. L., Tilanus R. P. J., Wang Z., 1993, PASP, 105, 1482
- [\citeauthoryearSimpson et al.2012] Simpson J. P., Cotera A. S., Burton M. G., Cunningham M. R., Lo N., Bains I., 2012, MNRAS, 419, 211
- [\citeauthoryearSkrutskie et al.2006] Skrutskie M. F., et al., 2006, AJ, 131, 1163
- [\citeauthoryearSmith, Norris, & Crowther2002] Smith L. J., Norris R. P. F., Crowther P. A., 2002, MNRAS, 337, 1309
- [\citeauthoryearSollins & Ho2005] Sollins P. K., Ho P. T. P., 2005a, ApJ, 630, 987
- [\citeauthoryearSollins et al.2005] Sollins P. K., Zhang Q., Keto E., Ho P. T. P., 2005b, ApJ, 631, 399
- [\citeauthoryearSolomon, Sanders, & Scoville1979] Solomon P. M., Sanders D. B., Scoville N. Z., 1979, ApJ, 232, L89
- [\citeauthoryearSridharan et al.2002] Sridharan T. K., Beuther H., Schilke P., Menten K. M., Wyrowski F., 2002, ApJ, 566, 931
- [\citeauthoryearTesti, Tan, & Palla2010] Testi L., Tan J. C., Palla F., 2010, A&A, 522, A44
- [\citeauthoryearTian & Leahy2006] Tian W. W., Leahy D. A., 2006, A&A, 455, 1053
- [\citeauthoryearTorrelles, Gomez, & Anglada1995] Torrelles J. M., Gómez J. F., Anglada G., 1995, RMxAC, 1, 149
- [\citeauthoryearTsamis et al.2008] Tsamis Y. G., Rawlings J. M. C., Yates J. A., Viti S., 2008, MNRAS, 388, 898
- [\citeauthoryearUrquhart et al.2008] Urquhart J. S., Hoare M. G., Lumsden S. L., Oudmaijer R. D., Moore T. J. T., 2008, ASPC, 387, 381
- [\citeauthoryearUrquhart et al.2009] Urquhart J. S., et al., 2009, A&A, 501, 539
- [\citeauthoryearWalmsley1995] Walmsley M., 1995, RMxAC, 1, 137
- [\citeauthoryearWang, van der Tak, & Hogerheijde2012] Wang K.-S., van der Tak F. F. S., Hogerheijde M. R., 2012, A&A, 543, A22
- [\citeauthoryearWheelwright et al.2012] Wheelwright H. E., de Wit W. J., Oudmaijer R. D., Hoare M. G., Lumsden S. L., Fujiyoshi T., Close J. L., 2012, A&A, 540, A89
- [\citeauthoryearWright et al.2010] Wright E. L., et al., 2010, AJ, 140, 1868
- [\citeauthoryearWu et al.2004] Wu Y., Wei Y., Zhao M., Shi Y., Yu W., Qin S., Huang M., 2004, A&A, 426, 503
- [\citeauthoryearYorke & Sonnhalter2002] Yorke H. W., Sonnhalter C., 2002, ApJ, 569, 846
- [\citeauthoryearYorke & Bodenheimer2008] Yorke H. W., Bodenheimer P., 2008, ASPC, 387, 189
- [\citeauthoryearZapata et al.2009a] Zapata L. A., Ho P. T. P., Schilke P., Rodríguez L. F., Menten K., Palau A., Garrod R. T., 2009a, ApJ, 698, 1422
- [\citeauthoryearZapata et al.2009b] Zapata L. A., Menten K., Reid M., Beuther H., 2009b, ApJ, 691, 332
- [\citeauthoryearZapata, Tang, & Leurini2010] Zapata L. A., Tang Y.-W., Leurini S., 2010, ApJ, 725, 1091
- [\citeauthoryearZapata et al.2011] Zapata L. A., Rodríguez-Garza C., Rodríguez L. F., Girart J. M., Chen H.-R., 2011, ApJ, 740, L19
- [\citeauthoryearZhang, Ho, & Ohashi1998] Zhang Q., Ho P. T. P., Ohashi N., 1998, ApJ, 494, 636
- [\citeauthoryearZhang et al.2007] Zhang Q., Sridharan T. K., Hunter T. R., Chen Y., Beuther H., Wyrowski F., 2007, A&A, 470, 269