Source Region of the Decameter–Hectometric Type II Radio Burst: Shock–Streamer Interaction Region
Abstract
D–H type II radio bursts are widely thought to be caused by the coronal mass ejections (CMEs). However, it is still unclear where the exact source of the type IIs on the shock surface is. We identify the source regions of the decameter–hectometric (D–H) type IIs based on imaging observations from SOHO/LASCO and the radio dynamic spectrum from Wind/Waves. The analysis of two well–observed events suggests that the sources of these two events are located in the interaction regions between shocks and streamers, and that the shocks are enhanced significantly in these regions.
1 Introduction
Type II radio bursts, especially in the decameter–hectometric (D–H) and kilometer (km) wavelength range, are thought to be caused by the electron beam accelerated by CME–driven shocks [e.g. Sheeley et al., 1985; Reiner et al., 1998; Bale et al., 1999]. Assuming that the type II radio burst was excited at the shock front, the speed of the shock could be obtained from the observed frequency drift rate of the type II radio burst based on a coronal–density model [e.g. Vršnak et al., 2001; Gopalswamy and Kaiser, 2002; Vršnak et al., 2002; Reiner, Kaiser, and Bougeret, 2003; Vršnak, Magdalenic, and Zlobec, 2004]. This method is widely used to study and forecast the propagation of shocks [e.g. Dryer and Smart, 1984; Smith and Dryer, 1990; Fry et al., 2003; Reiner, Kaiser, and Bougeret, 2007]. Shen et al. [2007] established a method to derive shock strength from the observations based on the assumption that type II radio bursts were generated from the nose of shocks.
However, whether or not type II radio bursts originate from the nose of shocks is still an open question. As a high–density region, the streamer was thought to be a place where strong shocks easily form [Evans et al., 2008]. Thus, the shock–streamer interaction region was discussed as a possible source region of type II radio bursts [e.g. Cho et al., 2005, 2007, 2008, 2011]. Using the coronal–density distribution obtained from the Mauna Loa Solar Observatory ( MLSO ) MK4 polarization map, Cho et al. [2007] studied the relationship between a metric type II burst and a CME. They found that the metric type II burst was generated at the interface of the CME flank and the streamer. Further, Cho et al. [2008] checked the source regions of 19 metric type II radio bursts and found that both of the front and the CME–streamer interaction regions are the possible source regions for the metric type II radio bursts. In addition, the shock and streamer interaction could also affect the spectrum of the type II radio burst. Recently, Kong et al. [2012] and Feng et al. [2012b] reported two clear cases where the spectrum of type II radio bursts varied during the interaction between the shocks and the streamers.
However, the discussion of the source regions of the type II radio bursts in the decameter–hectometric (D–H) wavelength range is still lacking. The spectrum of RAD2 on Wind/Waves [Bougeret et al., 1995] is from 1 to 14 MHz corresponding to the corona region from 2 to 9 . The C2 camera of the Large Angle and Spectrometric COronagraph (LASCO; Brueckner et al. [1995]) onboard the SOlar and Heliospheric Observatory (SOHO; Domingo et al. [1995]) provides the imaging observations from 1.5 to 6 . Thus, the combination of Wind/Waves and SOHO/LASCO–C2 observations could be used to study the source regions and the variation of type II radio bursts at the D–H wavelength range. In this article, we check source regions of two well–observed D–H type II radio bursts. The method applied in this study is introduced in Section 2. In Sections 3 and 4, two typical D–H type II events and their source regions are studied. Conclusions and discussions are then given in the last section.
2 Method
In this work, the source region of the D–H type II radio burst is obtained from the combined analysis of the Wind/Waves and SOHO/LASCO observations. The detailed method is described as follows:
-
i)
Previous results suggest that type II radio bursts especially in the D–H and longer wavelength range are caused by the CME–driven shocks [Reiner et al., 1998; Bale et al., 1999]. Recently, Vourlidas et al. [2003] and Ontiveros and Vourlidas [2009] found that shocks could be directly observed in coronagraph images. We use SOHO/LASCO–C2 observations to identify the position of the shock front, called S hereafter. It is thought to be the possible source region of type II bursts.
-
ii)
The fundamental frequency of a type II burst is related to the background electron density by [Priest, 1982]:
(1) Therefore, the electron density of the source regions of the type II could be obtained from the radio burst dynamic spectrum. Using the pb_inverter.pro procedure in Solar Software (SSW111http://www.lmsal.com/solarsoft/), the polarized–brightness observations from SOHO/LASCO could be used to get the background electron density distribution. The pb_inverter.pro procedure uses the pB inversion derivation obtained by van de Hulst [1950]. A polynomial fit of the form r-n is applied to the pB image for a single position angle to get the electron density distribution (see the introduction of the ‘pb_inverter.pro’ in the SSW). Thus, the possible regions, called as Sρ, which can generate the type II radio bursts at the observed frequency range at the time of shock observed, can be determined. In addition, considering a 2% uncertainty in the brightness observations (Vourlidas, 2012, private communicate), a 2% uncertainty in the obtained electron density was applied to find the Sρ.
-
iii)
The overlap region of the shock front (S) and the derived density region (Sρ) is defined as the source region of the type II radio burst.
Based on the method described above, to determine the source region of a D–H type II radio burst, we need the polarized–brightness image and the direct imaging observations of the shock from SOHO/LASCO and the D–H type II radio–burst observation from Wind/Waves. Thus, we select events based on the following criteria:
-
i)
A clear type II radio burst was recorded by Wind/Waves.
-
ii)
The burst was caused by a limb CME with clear shock signatures in the LASCO–C2 field of view. We require limb CMEs because the polarized–brightness image represents the background coronal–density distribution near the plane of the sky, and the shock driven by a limb CME should have the most clear signatures in coronagraph.
Conforming to these two criteria, two well–observed events were found for study in this article.
3 7 March 2011 Event
Figure 1 shows the SOHO/LASCO observations before and after the onset of this CME. On 7 March 2011, a limb CME originating from N24W59 was first observed by SOHO/LASCO–C2 at 20:00 UT. The orange symbols in panel (b) of Figure 1 show the possible front positions of this CME at 20:00 UT. Using the GCS model [Thernisien, Howard, and Vourlidas, 2006; Thernisien, Vourlidas, and Howard, 2009; Thernisien, 2011], Shen et al. [2012] obtained the speed of this CME as 2115 136 km s-1 in the three–dimensional space. This is a very fast CME with a speed much faster than the local Alfvén speed, and therefore LASCO–C2 only captured three images of the CME. We can expect that this CME drove a shock when it propagated in the corona.
Seen from panel (c) and (d) in Figure 1, obvious shock signatures ahead of the main body of the CME could be identified. The orange symbols in panel (c) and (d) of Figure 1 mark the shock front at two instants of time. As we described in Section 2, the shock front, S, is thought to be the possible source region of the associated type II radio burst.
Figure 2 shows the Wind/Waves observations from 7 March 2011 19:50 UT to 21:00 UT. From Figure 2, an obvious type II radio burst could be identified. The vertical dotted–dashed white lines in Figure 2 indicate the times of the shock recorded by SOHO/LASCO–C2. Seen from this figure, the signature of the type II radio burst at 20:12 UT is very weak. Near 20:22 UT, this type II radio burst became stronger, and lasted for about ten minutes. The white asterisks show the minimum and maximum fundamental frequency of this D–H type II radio burst at the time of 20:24 UT, which are 4.6 and 7.4 MHz corresponding to the electron density of cm-3 and cm-3, respectively, based on Equation 1.
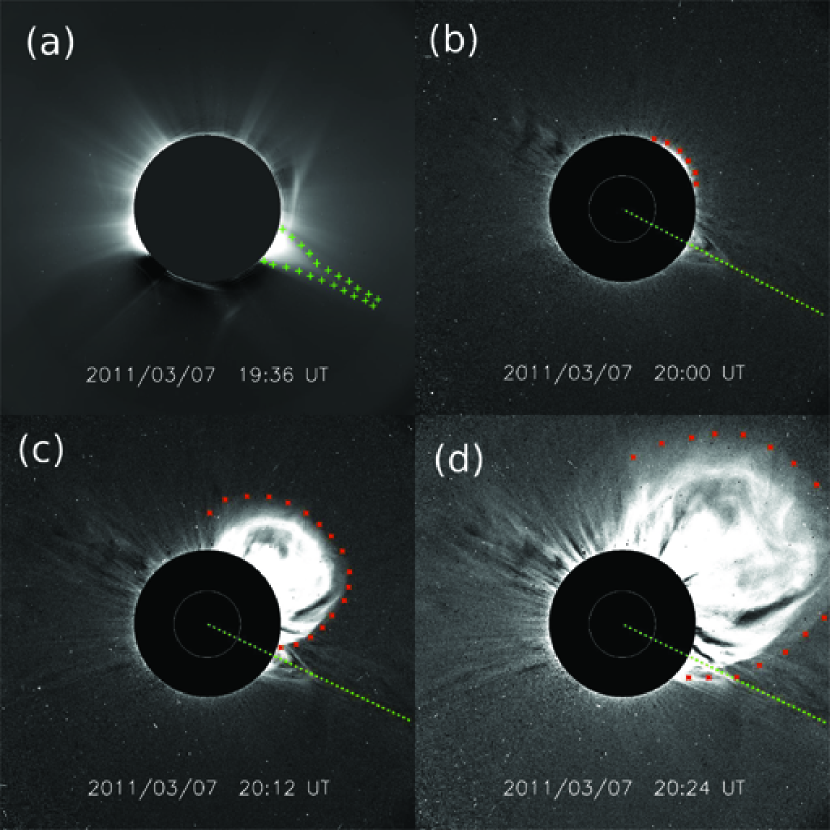
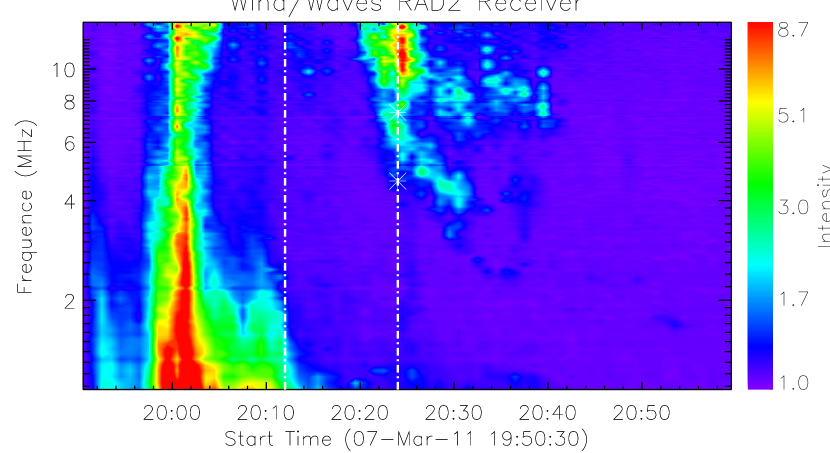
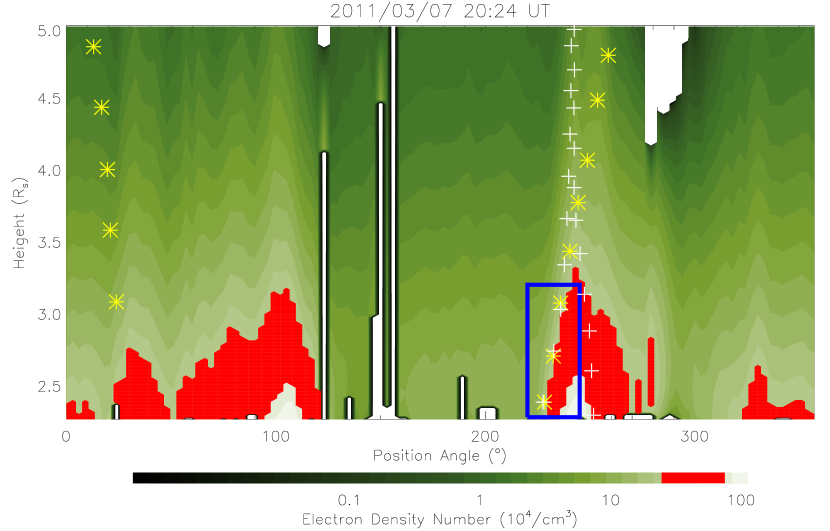
Figure 3 shows the background electron–density distribution obtained from the polarized image at 08:58 UT. The white regions in Figure 3 are caused by the unsuccessful determination of the density. It is clearly seen in the figure that the electron density varies significantly with position angle. This suggests that a simple one–dimensional density model may not reflect the real condition. The regions, i.e. Sρ, in which the electron density falls in the range from to cm-3, are indicated in red. The type II radio burst near 20:24 UT were probably generated from these region.
The position of S based on coronagraph observations is overplotted with yellow on Figure 3. As we discussed in Section 2, the source region of a type II radio burst is the overlap region between the S and Sρ. For this event at 7 March 2011 20:24 UT, the source region is located in the region indicated by the blue rectangle.
The white + symbols in Figure 3 show the boundary of the streamer, which is determined from the SOHO/LASCO image before the onset of the CME as indicated by the green + in Figure 1(a). It is found that the source of this type II radio burst is located at the shock–streamer interaction region. This result suggests that the type II radio burst at the D–H frequency range might also originate from the shock–streamer interaction region, similar to the metric type II radio bursts [Cho et al., 2007, 2008].
In addition, at 20:12 UT, the shock was also very clear in the SOHO/LASCO–C2 image (Figure 1c), but, the type II signature was much weaker than that near 20:24 UT. We suggest that such a difference is probably attributed to the degree of interaction between the shock and the streamer. From Figure 1(c), it seems that the shock did not fully interact with the streamer at 20:12 UT. But, at 20:24 UT as shown in Figure 1(d), a part of the CME–driven shock was propagating in the streamer obviously. The interaction between the streamer and the shock enhanced the shock and then the enhanced shock increased the intensity of the type II radio burst.
4 9 May 2011 event
This CME burst from the east limb of the solar disk. SOHO/LASCO–C2 observed it since 21:24 UT. It was a fast limb CME with a projected speed of 1318 km s-1. Figure 4 shows the SOHO/LASCO observations before and after the onset of this CME. It is found that the shock structure ahead of the CME could be well observed and identified at 21:24 UT, 21:36 UT and 21:48 UT based on SOHO/LASCO–C2 observations. The orange symbols in panels (b) – (d) show the shock front at three instants of time, which are defined as S.
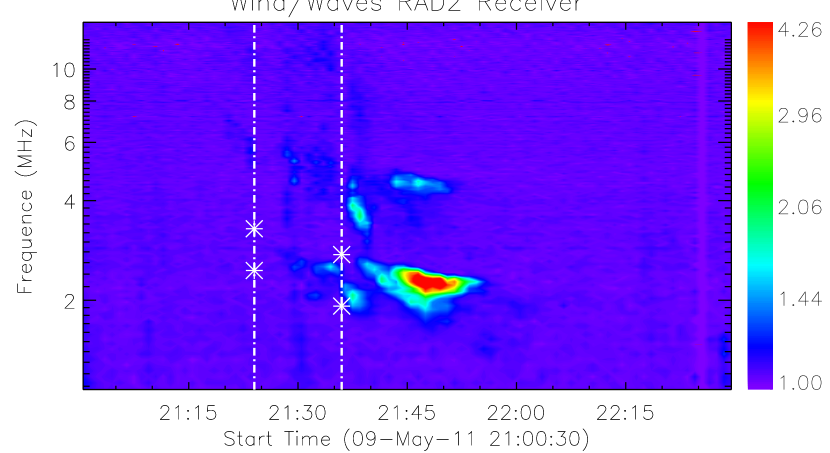
A D–H type II radio burst associated with this CME is shown in Figure 5. It started at 21:15 UT. At 21:24 UT, the type II radio burst was very weak and is difficult to identify. The half of the frequency of its harmonic component, which varied from 2.5 MHz to 3.3 MHz, is used as the fundamental frequency. After 21:24 UT, the strength of this D–H type II increased. This radio burst reached its strongest phase near 21:48 UT. At 21:36 UT, the fundamental frequency varied from 1.9 MHz to 2.7 MHz.
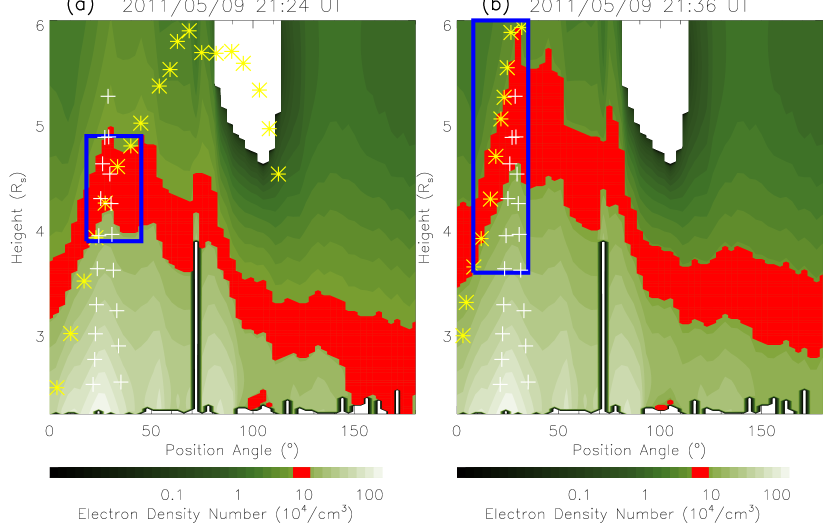
Figure 6 shows the electron–density distribution, which is derived from the polarized–brightness image recorded at 14:58 UT. The regions of Sρ at 21:24 UT and 21:36 UT are indicated by the red color in panels (a) and (b), respectively. Similar to Figure 3, the yellow symbols indicate S. The source regions of this type II event at the two instants of time were located in the regions enclosed by the blue rectangles in Figure 6.
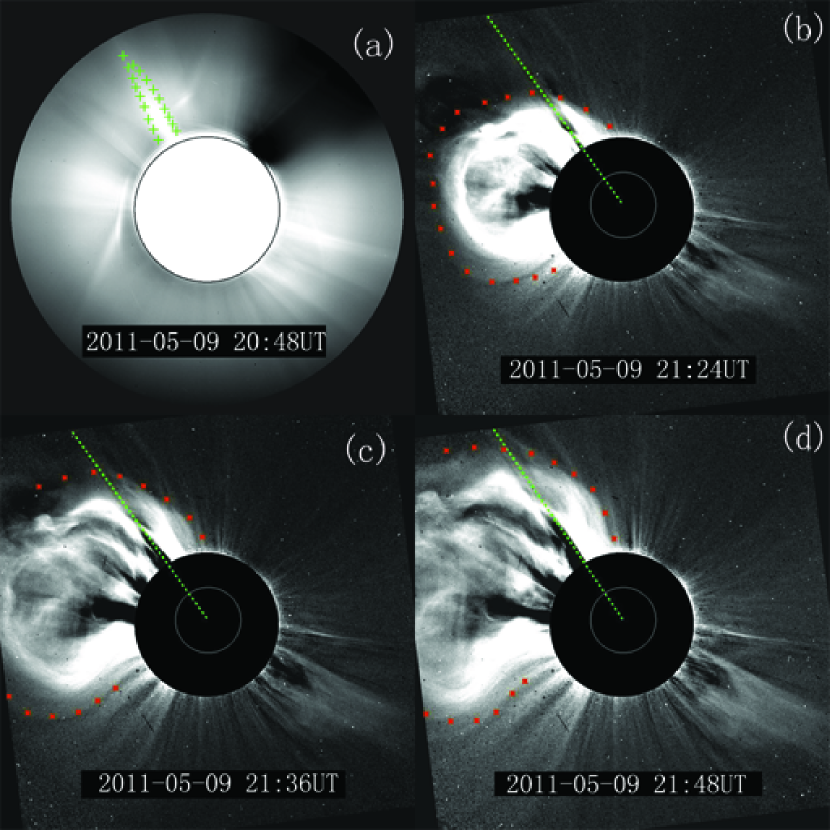
The white + symbols in Figure 6 show the boundary of the streamer as same as the green + in Figure 4(a). It is found that the source regions of this event at different time also located in the shock–streamer interaction regions. It confirms the conclusion that the shock–streamer interaction region might be the source region of a D–H type II radio burst. Seen from the Figure 4 (b) and (c), it is found that the interaction between the shock and the streamer may start near 21:24 UT. After that, the shock further interacted with the streamer. During this phase, the observed D–H type II radio burst enhanced continuously as shown in Figure 5. Thus, the increase of the intensity of this radio burst was probably caused by the enhancement of the shock during its interaction with the streamer.
5 Conclusion
In this work, the source regions of two well–observed D–H type II radio bursts are checked based on SOHO/LASCO–C2 and Wind/Waves observations. It is found that the source regions of these two D–H type II radio bursts probably located in the shock–streamer interaction regions, which is the same as the source regions of metric type II radio bursts [Cho et al., 2007, 2008, 2011]. In addition, by analyzing the intensity variation of these two D–H type II radio bursts, we suggest that the shocks were enhanced during their interaction with the streamer. Such enhancement of shocks would increase the intensity of the radio bursts.
These results indicate that the shock–streamer interaction region could also be one of the main source region of the D–H type II radio burst. It should be noted that the background density in a streamer (or the flank of a shock) is quite different from that near the nose of a shock. Thus, to calculate the shock speed based on the frequency drift rate of type II radio burst, a detailed analysis of where a radio burst is generated from should be done first.
As we described in Section 2, the background density obtained from the SOHO/LASCO polarized–brightness image is an important factor in our method. Unfortunately, there is only one polarized image taken each day in each telescope for most period of the SOHO mission222http://lasco-www.nrl.navy.mil/index.php?p=content/retrieve/products. Solar eruptions, especially the large CMEs, would significantly influence the background density. Thus, we choose only the events in which no large CME events occurred between the time of the polarized–brightness image recorded and the type II radio burst. In addition, clear type II radio–burst observations and clear shock signatures in SOHO/LASCO observations are needed in this method. Combined with these selection criteria, the number of events could be studied is limited. In a future work, the method developed by Hayes, Vourlidas, and Howard [2001] could be used to obtain the background electron density based on the total–brightness images, and more events could be studied.
It should be noted that only projection observations were used in this work. Recently, some methods were developed to obtain the CME’s parameters [e.g. Thernisien, Howard, and Vourlidas, 2006; 2009SoPh..256..111T;Thernisien:2011jy;2012arXiv1203.3261F], background electron density in the corona [e.g. Frazin et al., 2010] and the streamer structure [e.g. Morgan and Habbal, 2010] in three–dimensional space. Thus, the three–dimensional source region of the radio burst could be further checked by applying various three–dimensional models.
We acknowledge the use the SOHO/LASCO and Wind/Waves observations. The SOHO/LASCO data used here are produced by a consortium of the Naval Research Laboratory (USA), Max-Planck-Institut für Aeronomie (Germany), Laboratoire d’Astrophysique de Marseille (France), and the University of Birmingham (UK). SOHO is a mission of international cooperation between ESA and NASA. This work is supported by the CAS Key Research Program (KZZD-EW-01), grants from the 973 key project 2011CB811403, NSFC 41131065, 40904046, 41274173, 40874075, and 41121003, CAS the 100-talent program, KZCX2-YW-QN511 and startup fund, and MOEC 20113402110001 and the fundamental research funds for the central universities (WK2080000031 and WK2080000007).
References
- Bale et al. [1999] Bale, S.D., Reiner, M.J., Bougeret, J.L., Kaiser, M.L., Krucker, S., Larson, D.E., Lin, R.P.: 1999, The source region of an interplanetary type II radio burst. Geophys. Res. Lett. 26(1), 1573 – 1576. ADS:1999GeoRL..26.1573B, DOI:10.1029/1999GL900293.
- Bougeret et al. [1995] Bougeret, J.-L., Kaiser, M.L., Kellogg, P.J., Manning, R., Goetz, K., Monson, S.J., Monge, N., Friel, L., Meetre, C.A., Perche, C., Sitruk, L., Hoang, S.: 1995, Waves: The Radio and Plasma Wave Investigation on the Wind Spacecraft. Space Sci. Rev. 71, 231. ADS:1995SSRv…71..231B, DOI:10.1007/BF00751331.
- Brueckner et al. [1995] Brueckner, G.E., Howard, R.A., Koomen, M.J., Korendyke, C.M., Michels, D.J., Moses, J.D., Socker, D.G., Dere, K.P., Lamy, P.L., Llebaria, A., Bout, M.V., Schwenn, R., Simnett, G.M., Bedford, D.K., Eyles, C.J.: 1995, The Large Angle Spectroscopic Coronagraph (LASCO). Sol. Phys. 162, 357. ADS:1995SoPh..162..357B, DOI:10.1007/BF00733434.
- Cho et al. [2005] Cho, K.-S., Moon, Y.-J., Dryer, M., Shanmugaraju, A., Fry, C.D., Kim, Y.-H., Bong, S.-C., Park, Y.-D.: 2005, Examination of type II origin with SOHO/LASCO observations. J. Geophys. Res. 110(A12), A12101. ADS:2005JGRA..11012101C, DOI:10.1029/2004JA010744.
- Cho et al. [2007] Cho, K.-S., Lee, J., Moon, Y.-J., Dryer, M., Bong, S.-C., Kim, Y.-H., Park, Y.D.: 2007, A study of CME and type II shock kinematics based on coronal density measurement. A&A 461(3), 1121 – 1125. ADS:2007A&A…461.1121C, DOI:10.1051/0004-6361:20064920.
- Cho et al. [2008] Cho, K.-S., Bong, S.-C., Kim, Y.-H., Moon, Y.-J., Dryer, M., Shanmugaraju, A., Lee, J., Park, Y.D.: 2008, Low coronal observations of metric type II associated CMEs by MLSO coronameters. A&A 491(3), 873 – 882. ADS:2008A&A…491..873C, DOI:10.1051/0004-6361:20079013.
- Cho et al. [2011] Cho, K.-S., Bong, S.-C., Moon, Y.-J., Shanmugaraju, A., Kwon, R.Y., Park, Y.D.: 2011, Relationship between multiple type II solar radio bursts and CME observed by STEREO/SECCHI. A&A 530, A16. ADS:2011A&A…530A..16C, DOI:10.1051/0004-6361/201015578.
- Domingo et al. [1995] Domingo, V., Fleck, B., Poland, A. I., 1995, The SOHO Mission: an Overview. Sol. Phys. 162, 1 – 2. ADS:1995SoPh..162….1D, DOI:10.1007/BF00733425.
- Dryer and Smart [1984] Dryer, M., Smart, D.: 1984, Dynamical models of coronal transients and interplanetary disturbances. Adv. Space Res. 4(7), 291 – 301. ADS:1984AdSpR…4..291D, DOI:10.1016/0273-1177(84)90200-X.
- Evans et al. [2008] Evans, R.M., Opher, M., Manchester, W.B.I., Gombosi, T.I.: 2008, Alfvén Profile in the Lower Corona: Implications for Shock Formation. ApJ 687(2), 1355 – 1362. ADS:2008ApJ…687.1355E, DOI:10.1086/592016.
- Feng et al. [2012a] Feng, L., Inhester, B., Wei, Y., Gan, W.Q., Zhang, T.-L., Wang, M.Y.: 2012a, Morphological Evolution of a Three-dimensional Coronal Mass Ejection Cloud Reconstructed from Three Viewpoints . ApJ 751, 18. ADS:2012ApJ…751…18F, DOI:10.1088/0004-637X/751/1/18.
- Feng et al. [2012b] Feng, S.W., Chen, Y., Kong, X.L., Li, G., Song, H.Q., Feng, X.S., Liu, Y.: 2012b, Radio Signatures of Coronal–mass–ejection–Streamer Interaction and Source Diagnostics of Type II Radio Burst. ApJ 753(1), 21. ADS:2012ApJ…753…21F, DOI:10.1088/0004-637X/753/1/21.
- Frazin et al. [2010] Frazin, R.A., Lamy, P., Llebaria, A., Vásquez, A.M.: 2010, Three–Dimensional Electron Density from Tomographic Analysis of LASCO–C2 Images of the K–Corona Total Brightness. Sol. Phys. 265(1–2), 19 – 30. ADS:2010SoPh..265…19F, DOI:10.1007/s11207-010-9557-9.
- Fry et al. [2003] Fry, C., Dryer, M., Smith, Z., Sun, W., Deehr, C., Akasofu, S.: 2003, Forecasting solar wind structures and shock arrival times using an ensemble of models. J. Geophys. Res. 108(A2), 1070. ADS:2003JGRA..108.1070F, DOI:10.1029/2002JA009474.
- Gopalswamy and Kaiser [2002] Gopalswamy, N., Kaiser, M.L.: 2002, Solar eruptions and long wavelength radio bursts: The 1997 May 12 event. Adv. Space Res. 29, 307. ADS:2002AdSpR..29..307G, DOI:10.1016/S0273-1177(01)00589-0.
- Hayes, Vourlidas, and Howard [2001] Hayes, A.P., Vourlidas, A., Howard, R.A.: 2001, Deriving the Electron Density of the Solar Corona from the Inversion of Total Brightness Measurements. ApJ 548, 1081. ADS:2001ApJ…548.1081H, DOI:10.1086/319029.
- Kong et al. [2012] Kong, X.L., Chen, Y., Li, G., Feng, S.W., Song, H.Q., Guo, F., Jiao, F.R.: 2012, A Broken Solar Type II Radio Burst Induced by a Coronal Shock Propagating across the Streamer Boundary. ApJ 750(2), 158. ADS:2012ApJ…750..158K, DOI:10.1088/0004-637X/750/2/158.
- Morgan and Habbal [2010] Morgan, H., Habbal, S.R.: 2010, Observational Aspects of the Three–dimensional Coronal Structure Over a Solar Activity Cycle. ApJ 710(1), 1 – 15. ADS:2010ApJ…710….1M, DOI:10.1088/0004-637X/710/1/1.
- Ontiveros and Vourlidas [2009] Ontiveros, V., Vourlidas, A.: 2009, Quantitative Measurements of Coronal Mass Ejection–Driven Shocks from LASCO Observations. ApJ 693(1), 267 – 275. ADS:2009ApJ…693..267O, DOI:10.1088/0004-637X/693/1/267.
- Priest [1982] Priest, E.R.: 1982, Solar magneto–hydrodynamics. Geophys. Astrophys. Monogr. 21. Reidel, Dordrecht ADS:1982GAM….21…..P.
- Reiner et al. [1998] Reiner, M.J., Kaiser, M.L., Fainberg, J., Bougeret, J.L., Stone, R.G.: 1998, On the origin of radio emissions associated with the January 6–11, 1997, CME. Geophys. Res. Lett. 25(1), 2493 – 2496. ADS:1998GeoRL..25.2493R, DOI:10.1029/98GL00138.
- Reiner, Kaiser, and Bougeret [2003] Reiner, M.J., Kaiser, M.L., Bougeret, J.L.: 2003, On the Deceleration of CMEs in the Corona and Interplanetary Medium deduced from Radio and White–Light Observations. In: SOLAR WIND TEN: Proc. of the Tenth Internat. Solar Wind Conf. AIP Conf. Proc., 152 – 155. ADS:2003AIPC..679..152R, DOI:10.1063/1.1618564.
- Reiner, Kaiser, and Bougeret [2007] Reiner, M.J., Kaiser, M.L., Bougeret, J.L.: 2007, Coronal and Interplanetary Propagation of CME/Shocks from Radio, In Situ and White–Light Observations. ApJ 663(2), 1369 – 1385. ADS:2007ApJ…663.1369R, DOI:10.1086/518683.
- Sheeley et al. [1985] Sheeley, N.R. Jr, Howard, R.A., Koomen, M.J., Michels, D.J., Schwenn, R., Muehlhaeuser, K.H., Rosenbauer, H.: 1985, Coronal mass ejections and interplanetary shocks. J. Geophys. Res. 90(A1), 163 – 175. ADS:1985JGR….90..163S, DOI:10.1029/JA090iA01p00163.
- Shen et al. [2007] Shen, C., Wang, Y., Ye, P., Zhao, X.P., Gui, B., Wang, S.: 2007, Strength of coronal mass ejection-driven shocks near the sun and their importance in predicting solar energetic particle events. ApJ 670(1), 849 – 856. ADS:2007ApJ…670..849S, DOI:10.1086/521716.
- Shen et al. [2012] Shen, C., Wang, Y.-M., Liu, Y., Ye, P., Wang, S.: 2012, Three Dimensional Parameters and Geoeffectiveness of Full Halo Coronal Mass Ejections During the Ascending Phase of Solar Cycle 24. Geophys. Res. Lett., submitted.
- Smith and Dryer [1990] Smith, Z., Dryer, M.: 1990, MHD study of temporal and spatial evolution of simulated interplanetary shocks in the ecliptic plane within 1 AU. Sol. Phys. 129, 387 – 405. ADS:1990SoPh..129..387S, DOI:10.1007/BF00159049.
- Thernisien, Howard, and Vourlidas [2006] Thernisien, A.F.R., Howard, R.A., Vourlidas, A.: 2006, Modeling of Flux Rope Coronal Mass Ejections. ApJ 652, 763. ADS:2006ApJ…652..763T, DOI:10.1086/508254.
- Thernisien, Vourlidas, and Howard [2009] Thernisien, A., Vourlidas, A., Howard, R.A.: 2009, Forward Modeling of Coronal Mass Ejections Using STEREO/SECCHI Data. Sol. Phys. 256(1), 111 – 130. ADS:2009SoPh..256..111T, DOI:10.1007/s11207-009-9346-5.
- Thernisien [2011] Thernisien, A.: 2011, Implementation of the Graduated Cylindrical Shell Model for the Three–dimensional Reconstruction of Coronal Mass Ejections. ApJS 194, 33. ADS:2011ApJS..194…33T, DOI:10.1088/0067-0049/194/2/33.
- van de Hulst [1950] van de Hulst, H.C.: 1950, The electron density of the solar corona. Bulle. Astronom. Instit. Netherlands 11, 135. ADS:1950BAN….11..135V.
- Vourlidas et al. [2003] Vourlidas, A., Wu, S.T., Wang, A.H., Subramanian, P., Howard, R.A.: 2003, Direct Detection of a Coronal Mass Ejection–Associated Shock in Large Angle and Spectrometric Coronagraph Experiment White–Light Images. ApJ 598, 1392. ADS:2003ApJ…598.1392V, DOI:10.1086/379098.
- Vršnak et al. [2001] Vršnak, B., Aurass, H., Magdalenic, J., Gopalswamy, N.: 2001, Band–splitting of coronal and interplanetary type II bursts. I. Basic properties. A&A 377, 321 – 329. ADS:2001A&A…377..321V, DOI:10.1051/0004-6361:20011067.
- Vršnak et al. [2002] Vršnak, B., Magdalenic, J., Aurass, H., Mann, G.: 2002, Band–splitting of coronal and interplanetary type II bursts. II. Coronal magnetic field and Alfvén velocity. A&A 396, 673 – 682. ADS:2002A&A…396..673V, DOI:10.1051/0004-6361:20021413.
- Vršnak, Magdalenic, and Zlobec [2004] Vršnak, B., Magdalenic, J., Zlobec, P.: 2004, Band–splitting of coronal and interplanetary type II bursts. III. Physical conditions in the upper corona and interplanetary space. A&A 413, 753 – 763. ADS:2004A&A…413..753V, DOI:10.1051/0004-6361:20034060.