Probing the - relation in the non-local universe using red QSOs
Abstract
We describe a method to measure the - relation in the non-local universe using dust-obscured QSOs. We present results from a pilot sample of nine 2MASS red QSOs with redshifts . We find that there is an offset (0.8 dex, on average) between the position of our objects and the local relation for AGN, in the sense that the majority of red QSO hosts have lower velocity dispersions and/or more massive BHs than local galaxies. These results are in agreement with recent studies of AGN at similar and higher redshifts. This could indicate an unusually rapid growth in the host galaxies since , if these objects were to land in the local relation at present time. However, the AGN (including our sample and those of previous studies) have significantly higher than those of local AGN, so a direct comparison is not straightforward. Further, using several samples of local and higher- AGN, we find a striking trend of an increasing offset with respect to the local - relation as a function of AGN luminosity, with virtually all objects with log(L5100/erg s-1) falling above the relation. Given the relatively small number of AGN at for which there are direct measurements of stellar velocity dispersions, it is impossible at present to determine whether there truly is evolution in - with redshift. Larger, carefully selected samples of AGN are necessary to disentangle the dependence of - on mass, luminosity, accretion rates, and redshift.
1 Introduction
During the last decade, the astronomy community has come to realize that black hole (BH) activity plays an important role in galaxy formation, e.g., by regulating star formation through winds and outflows Scannapieco et al. (2005); Cattaneo et al. (2005). To understand how galaxies form, we therefore need to understand how supermassive BHs and galaxies co-evolve.
The most important observational tools for studying the co-evolution of BHs and galaxies are the empirical scaling relations between BH mass and global galaxy properties, such as the - relation Ferrarese and Merritt (2000); Gebhardt et al. (2000a), a particularly tight relation between BH mass, , and the central, stellar velocity dispersion, . The - relation suggests a causal connection between the BH and the bulge (although see e.g., Jahnke and Macciò, 2011, for a counter argument), and is believed to hold clues to understanding the galaxy formation process. By studying how the BH mass relates to the mass of the bulge (as measured by ), the galaxy evolution process can be examined across different redshift ranges and for different galaxy types.
Active galactic nuclei (AGN) have become instrumental in this work because they contain actively accreting black holes. Not only are they direct probes of the BH-galaxy co-evolution, but galaxies with AGN are the only galaxies in which we can measure black hole masses in the non-local universe. The method is referred to as the virial method, where the width of broad AGN emission lines such as H or H is used to measure (e.g., Vestergaard and Peterson, 2006). Whereas measuring virial BH masses in AGN through broad emission lines is relatively straightforward, measuring the host galaxy velocity dispersion is hampered by the presence of the very bright nuclei which can completely overpower the light from the underlying galaxy.
Attempts have been made to use the width of [OIII] lines as a proxy for the bulge potential Nelson (2000); Shields et al. (2003); Salviander et al. (2007), but these studies suffer from a large scatter due to non-gravitational influences on the [OIII] line width (such as outflows, radio luminosity, accretion rates, etc; see, e.g., Netzer and Trakhtenbrot, 2007). Studies of low-luminosity AGN at have shown that they follow the - relation of local, more massive spheroids (e.g., Gebhardt et al., 2000b; Nelson et al., 2004; Greene and Ho, 2006b; Woo et al., 2010; Bennert et al., 2011a), and there is evidence that higher redshift AGN show evolution with regard to the local - relation.
Woo et al. (2006, 2008) and Treu et al. (2007) studied two samples of Seyfert 1 galaxies at and and found an offset from the local relation suggesting that, for a fixed black hole mass, higher redshift spheroids have smaller velocity dispersions than local ones. This indicates that, in these objects, the galactic bulge is still forming around the black hole. Hiner et al. (2012) find a similar offset with respect to the local relation in a sample of six post-starburst AGN at . These results have serious implications and may provide important observational constraints for galactic evolution models which attempt to explain the co-evolution of black holes and bulges. The studies by Woo et al., Treu et al., and Hiner et al. suggest a very recent growth, within the last 56 billion years, of intermediate-mass bulges for a given black hole mass, in contrast to predictions made by detailed hydrodynamic simulations (e.g., Robertson et al., 2006b). On the other hand, Shen et al. (2008) study a large sample of AGN observed with the Sloan Digital Sky Survey (SDSS) at and find no evidence of evolution in the relation.
The study of the - relation has been severely limited in QSOs due to the observational challenges such a project poses. However, studying - in QSOs would be desirable since these are potentially the objects where the most rapid growth (in both BH and bulge) occurs. Studies of - at need to include QSOs in order to probe the higher end of the relation and, potentially, episodes when either the bulge or the BH is catching up in its growth.
Measuring velocity dispersions from absorption lines in QSO host galaxies is observationally challenging. The relatively few studies of host galaxy stellar absorption line spectroscopy in the literature (e.g., Canalizo and Stockton, 2001; Nolan et al., 2001; Jahnke et al., 2007; Wold et al., 2010) are not able to recover host spectra in the central regions of the galaxy. Using these spectra to measure velocity dispersions could lead to ambiguous results since it is difficult to determine whether the dispersions are being measured in the bulge of the galaxy or in the outskirts or some extended tidal feature where may not be representative of the mass of the bulge or that of the BH. Indeed, few attempts have been made to measure in the host galaxies of luminous QSOs (e.g., Wolf and Sheinis, 2008; Rothberg et al., 2012), but these studies have been in relation to the host structural properties rather than -. Therefore, it would be ideal to find a class of objects with a natural “coronagraph” that would occult the QSO nucleus when measuring , but one that we could remove in order to measure from the width of the broad lines. As described below, we have found that dust-reddened QSOs fit the bill.
Red QSOs have some of the same characteristics as their blue counterparts, such as (at least some of the) strong broad emission lines and high bolometric luminosities, but with much redder continua. At present, there is not a clear definition for red QSOs, so that the different objects that are cataloged as red QSOs do not form a homogeneous class. The majority of red QSOs discovered to date, however, appear to be reddened by dust, and thus they are considered the dust-obscured equivalent of the blue QSO population (e.g., Cutri et al., 2002; Marble et al., 2003; Hall et al., 2002; Glikman et al., 2004; White et al., 2003). Even then, there are cases where the dust is intervening rather than intrinsic to the QSO (e.g., Gregg et al., 2002). Here we focus on those objects where the dust is presumably near the nucleus.
The heavy extinction of the QSO nuclei at optical wavelengths makes dust reddened QSOs excellent candidates to study velocity dispersions and stellar populations in their host galaxies. The host galaxy spectrum suffers from much lower (if any) extinction than the nucleus, and stellar absorption features such as those around the Mg Ib and G-band regions are clearly visible in the blue region, being almost free of contamination from QSO light. At longer wavelengths, however, the contribution from the reddened QSO continuum increases and broad H is clearly visible. Thus, can be measured from features in the underlying host galaxy and can be estimated from the width of H using the same spectrum.
In this paper, we present a pilot study to test the feasibility of using these objects to measure -. In § 2 we describe the sample, imaging and spectroscopic observations, as well as the data reduction. In § 3 we describe our method to fit stellar velocity dispersions and to measure . In § 4 we present our results and consider potential biases in our sample, while in § 5 we discuss our results in the context of other studies of - that use AGN. Throughout the paper, we have assumed a cosmological model with km s-1Mpc-1, and (Spergel et al., 2003), except where noted. We use the Vega magnitude system unless otherwise specified.
2 Observations and Data Reduction
2.1 The Sample
Our sample is drawn from the sample of 29 red 2MASS QSOs studied by Marble et al. (2003), which in turn is drawn from the sample compiled by Cutri et al. (2002). We focused on the subsample from Marble et al. (2003) because these objects have Hubble Space Telescope () imaging observations that are useful to measure the nuclear luminosities and to study the properties of the host galaxies. The objects in this sample have , and detections in each of the three 2MASS bands, . They have a median redshift of and have been spectroscopically confirmed to contain an AGN (Smith et al., 2002).
A fraction of these objects have spectropolarimetry published by Smith et al. (2003). We avoided the objects that show a blue continuum, with broad emission features dominating the optical spectrum. Our final sample consists of nine of the remaining targets chosen at random within the observational constraints.
In Table 1 we list the final sample. The redshifts listed were measured from stellar absorption lines in our Keck spectra (§ 2.2). colors and absolute magnitudes are quoted from Marble et al. (2003), and the latter assume km s-1Mpc-1 and .
| Object | QSO | ESI Exposure | Extraction aperture | ||||
|---|---|---|---|---|---|---|---|
| ID | (2MASSi J) | Time (sec) | (arcsec) | (kpc) | |||
| 1 | 005055.7293328 | 0.1356 | 25.6 | 2.1 | 1800 | 0.21 | 0.50 |
| 2 | 015721.0171248 | 0.2139 | 27.0 | 2.7 | 7200 | 0.21 | 0.75 |
| 3 | 022150.6132741 | 0.1398 | 25.7 | 2.4 | 5400 | 2.86 | 6.96 |
| 4 | 034857.6125547 | 0.2112 | 26.7 | 3.3 | 3600 | 0.79 | 2.70 |
| 5 | 163736.5254302 | 0.2772 | 26.5 | 2.3 | 5400 | 0.21 | 0.88 |
| 6 | 165939.7183436 | 0.1709 | 26.5 | 2.2 | 5400 | 0.29 | 0.84 |
| 7 | 225902.5124646 | 0.1989 | 25.6 | 1.9 | 5400 | 0.42 | 1.36 |
| 8 | 230442.4270616 | 0.2370 | 25.4 | 2.1 | 7200 | 0.97 | 3.61 |
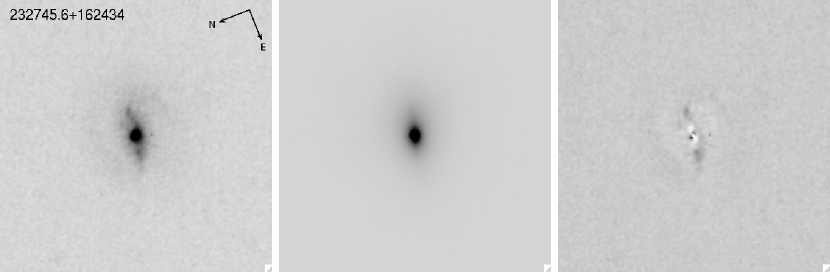
| 9 | 232745.6162434 | 0.3664 | 27.0 | 2.4 | 5400 | 1.29 | 6.51 |
2.2 Spectroscopy
We obtained deep, medium resolution spectroscopic observations with the Echellette Spectrograph and Imager (ESI; Sheinis et al., 2002) on the Keck II telescope during three separate nights in October 2003, July 2004 and September 2004. We observed in the echellette mode, which provides a wavelength coverage from 3900 to 11000 Å in 10 orders (6 through 15). We used a 1″ slit, which projected to 7 pixels (ranging from 8 pixels at the short-wavelength end to 6 pixels at the long-wavelength end) on the MIT-Lincoln Labs 20484096 CCD detector. The spectral resolution is 11.4 km s-1 pixel-1. We placed the slit through the center of the host galaxies to ensure that the velocity dispersions that we measure correspond to those of the host galaxy bulges.
All targets were observed under clear weather conditions and subarcsecond seeing ( in V), except for 230442.4270616 and 022150.6132741, which were observed through clouds, and 232745.6 162434, which was observed in high wind conditions. Exposure times for each target ranged from 1800 to 7200 s; specific times are listed in Table 1.
We also observed a suite of template stars with stellar types ranging from F0 to M6 (listed on Table 2) and several spectrophotometric standards.
| Star | Luminosity |
|---|---|
| class | |
| HD 218140 | F0 |
| SAO 90936 | F5 |
| HD 11851 | F8 |
| BD264556 | G0 |
| HD 10995 | G2IV |
| SAO 91026 | G5 V |
| SAO 090989 | K0 |
| SAO 91028 | K2 |
| HD 11326 | K2III |
| HD 218113 | K5III |
| SAO 90990 | K5 V |
| Ci20131 | M0 |
| HD 11729 | M6 |
| SAO 92712 | K0 |
| SAO 92718 | G0 |
The spectra were reduced using a combination of IDL and IRAF scripts written to meet the specific needs of our program. After bias subtraction and flat fielding, each order was rectified independently in both spatial and wavelength directions using a modified version of the WMKONSPEC package111http://www2.keck.hawaii.edu/inst/nirspec-old/wmkonspec/index.html. A star was observed at multiple positions across the slit in order to trace and rectify the spatial direction of the spectra. A wavelength solution, obtained from observations of a Cu-Ar lamp, was used to rectify the wavelength direction. Sky lines were removed by fitting the background in the two-dimensional spectra. The spectra were calibrated using spectrophotometric standards from Massey et al. (1988) observed with the slit at the parallactic angle. Each target had two or three individual exposures; we averaged the spatially corrected spectra using the IRAF task scombine.
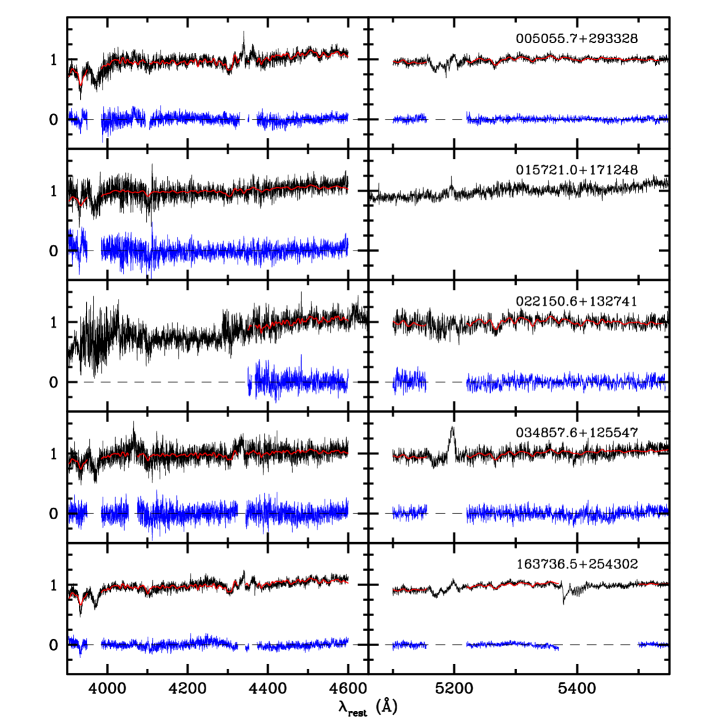
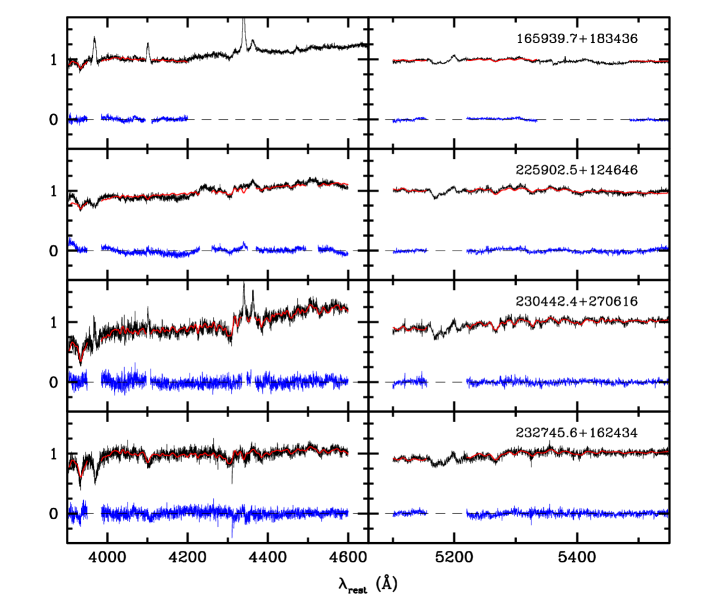
We extracted spectra from the central few kpc of each spectrum, adjusting the size of the aperture to match approximately the effective radius, , of each target (see § 3.2), as listed in Table 1. This corresponded to a slightly different aperture size for each echellette order, since the spatial scale varies for different orders. We then combined the spectra from all orders into a single spectrum for each target. We corrected the spectra for Galactic extinction, using the values given by Schlegel et al. (1998). Finally, we transformed the spectra to rest frame using redshifts measured from stellar absorption lines. The final spectra for the nine targets are shown in Figs. 1a and 1b.


2.3 Imaging
The imaging data were obtained from the data archive (SNAP-9057; PI: D. Hines) and were originally published by Marble et al. (2003). The targets were observed with the PC chip of the WFPC2 in the F814W filter. Each target had two 400 s exposures. We combined the images with multidrizzle, using standard procedures.
3 Analysis
3.1 Velocity Dispersion
The velocity dispersion in the host galaxies was measured by fitting broadened stellar templates to the galaxy spectra. A direct fitting algorithm based on that described by Barth et al. (2002) was used. The algorithm has been extensively tested and utilized for AGN host galaxies by, e.g., Greene and Ho (2006a) and Wold et al. (2007). The model spectrum which is fitted to the host galaxy is formed by convolving a stellar template with a line-of-sight velocity broadening function, assumed to be a Gaussian with dispersion , adding a power-law continuum and multiplying by a polynomial :
| (1) |
where is the stellar template convolved with the Gaussian, . The coordinate is defined as so that velocity shifts are linear in . The continuum is (note that this is a power-law as a function of wavelength), and was chosen to be a 3rd degree polynomial , where are Legendre polynomials. In order to find the best-fitting model, we varied the velocity dispersion and the six coefficients to using a downhill simplex method (Press and Spergel, 1988) until a global minimum of the function was found.
Our object spectra are combinations of QSO and galaxy features, and the featureless continuum describes the underlying AGN continuum. The polynomial accounts for reddening between the template and the object, so the factor which is added to the convolved stellar template describes the underlying reddened QSO spectrum. By comparing with an unobscured QSO spectrum, we were able to obtain an estimate of the amount of reddening for each QSO. This is described in § 3.3.2.
Stellar templates were formed from individual and various combinations of the 15 different stellar spectra observed with the same setup as the red QSOs (see Table 2). Average F, G, K and M spectra were made by normalizing to the flux in the 70007100 Å region and taking the average of all spectra within each of the four classes. Since the main source of uncertainty in measuring velocity dispersions typically comes from template mismatches (Barth et al., 2002; Greene and Ho, 2006a), we ran a series of tests to determine the best template to fit for each region and thus minimize systematic uncertainties, as described in detail below.
Based on previous experience and descriptions of similar analyses in the literature (Barth et al., 2002; Greene and Ho, 2006a; Wold et al., 2007) we chose to estimate velocity dispersions from fits to two different spectral regions: (1) a blue region at 39004600 Å including Ca K but excluding the Ca H line (the region 39503985 Å around Ca H was excluded because in some cases AGN contamination from H in emission complicated the fit), and (2) a red region at 51005550 Å with the Mg Ib absorption line complex 5167, 5173, 5184 masked out (51555220 Å). It is well-known that the correlation between [Mg/Fe] and velocity dispersion for elliptical galaxies (Jørgensen et al., 1999; Kuntschner et al., 2001) can cause problems with simultaneous fitting of the Mg Ib absorption and the region redward of it (Barth et al., 2002; Wold et al., 2007). The red region may also be affected by the AGN Fe II pseudo-continuum at 50505520 Å, affecting the fits to this region. This is seen in a couple of our objects, as well as emission from [N I] 5198, 5200. We therefore chose to mask out the region 51555220 Å from our fits. Apart from this, the chosen red and blue regions are the two most reliable regions in the optical with strong enough stellar features to be used for velocity dispersion measurements.
The region redward of the Mg Ib contains several iron absorption line features that are well fitted with our composite template. We also obtain good fits to the blue region, in particular to the Ca K line at 3933 Å, H-absorption at 4100 Å, and the G-band at 4300 Å. Generally, we do not see much AGN contamination in this region, except in one case (165939183436), which consequently has larger uncertainties in the velocity dispersion. Some narrow AGN emission lines, such as H, H, and [O III] 4363, had to be masked from some of the fits, as well as corrupt spectral regions in a couple of cases. In cases where we could not achieve a good fit to the 4000Å break, but there were enough features longward of the break to constrain the fit, we restricted our fit to a region from 40004600 Å.
The galaxy spectra were shifted to the rest frame of the stellar templates, and the fitting algorithm initiated with a reasonable set of parameters (we fit seven free parameters including the velocity dispersion). The parameters were varied freely using the downhill simplex routine until a best fit was found. To improve on the best fit and to ensure that a global minimum was found, the fitting routine was started again, with initial model parameters equal to the first solution but perturbed by 1020 % in random directions for each parameter. The confidence interval on was thereafter found by varying the velocity dispersion in steps of 10 km s-1 while letting the other six parameters float freely.
In order to minimize systematic uncertainties due to template mismatches, we used single stars as well as different combinations as stellar templates. For the red region, we find that, in general, we obtain the lowest reduced when using late stellar types as templates. Five of the objects were best fit in this region with a K 5 template. This is not surprising since this region is generally dominated by features from later stellar types. This also consistent with the results found by Hiner et al. (in preparation), who measure stellar velocity dispersions in local galaxies by using templates constructed from a large suite of stellar types, accurately mimicking stellar populations of different ages (see also Hiner et al., 2012). They find a one-to-one correlation in the velocity dispersions that they measure by using a single K star template versus more complex stellar templates in the Mg Ib region (equivalent to our “red region”). Only three of the objects in our sample (005055.7+293328, 034857.6+125547, 225902.5+124646) are best fit by including a contribution from earlier stellar types. Although these fits produced the smallest reduced , the resulting is within a few tens of km s-1 of that measured with a K star template. In fact, the standard deviation in the values of measured from different templates is typically smaller than 20 km s-1. Since we do not do a detailed analysis of the stellar populations in this work, we do not favor any particular composite template among those that yield the lowest reduced values. Therefore, for consistency, we chose to use the same composite template for these three objects as the one we used for the blue region, as described below. The remaining object, 015721.0171248, shows significant QSO contamination in the red region and we were not able to obtain a reliable fit in this region.
The spectra of our objects in the blue region show features from both early- and late-type stars. Therefore, fits using single stellar types as templates consistently resulted in significantly larger reduced values than those obtained from fits using composite stellar templates. This is also consistent with the results by Hiner et al., who find that using single stellar types as templates for this spectral region result in systematic uncertainties of several tens of km s-1. Thus, we tested a few templates consisting of combinations of stellar types with ratios by flux that would mimic intermediate-age populations (i.e., including features from older and younger populations) and chose the one that yield the lowest values of reduced . Although, in principle, we could do a minimization to determine the best combination of stellar types for each template, we chose use the same template for every host galaxy in order to reduce the number of free parameters (and degeneracies) in the fits. The flux contribution at 7000 Å of each stellar type for this composite template is 40% K, 40% G, 15% F and 5% M-star (Fig. 2).

The galaxy spectra in the red and the blue regions with the best-fit models overplotted are shown in Figs. 3a and 3b, and the velocity dispersions obtained from these fits are listed in Table 3. The reduced chi-squared, , for each fit is also listed.
The confidence intervals on give the uncertainty related to the fitting procedure, with smaller confidence intervals for higher signal-to-noise spectra and for spectra with minimal AGN contribution in the fitting regions. Typically, we obtain 68% confidence intervals with a width of 1020 km s-1.
| QSO | Blue region | Red region | Weighted | ||||
|---|---|---|---|---|---|---|---|
| (2MASSi J) | std. dev. | std. dev. | avg. | ||||
| 005055.7293328 | 1.71 | 15.4 | 0.69 | 18.3 | |||
| 015721.0171248 | 6.75 | 53.0 | |||||
| 022150.6132741 | 1.96 | 40.7 | 3.31 | 20.0 | |||
| 034857.6125547 | 6.16 | 26.1 | 2.99 | 17.9 | |||
| 163736.5254302 | 1.49 | 16.7 | 0.51 | 8.4 | |||
| 165939.7183436 | 0.50 | 22.1 | 0.20 | 16.8 | |||
| 225902.5124646 | 0.87 | 25.8 | 0.69 | 27.8 | |||
| 230442.4270616 | 1.53 | 35.3 | 0.76 | 3.1 | |||
| 232745.6162434 | 2.23 | 21.6 | 0.89 | 23.1 | |||
Note. — Velocity dispersion in units of km s-1 obtained for the blue and red fitting regions. The errors for the blue and red regions are 68% confidence intervals; is the reduced for the best fit. The standard deviation in km s-1 of a series of measurements using different stellar templates is given for each region; this is an estimate of the systematic uncertainty due to template mismatches. The last column is the average of the from the blue and red regions, weighted by their corresponding uncertainties. The errors given for the average values include the standard deviations added in quadrature. The blank spaces denote regions where a good fit was not obtainable. Note that the velocity dispersions in this table have not been aperture corrected.
In reality, the uncertainty in the velocity dispersion is larger than this because not all features in the stellar templates used match the host galaxy features equally well. In order to estimate the uncertainties related to template mismatches we fitted a range of stellar templates to the host galaxies and obtained a standard deviation of the measured values of . We list the standard deviations for each range of fits for each region in Table 3. As mentioned above, the systematic uncertainties due to template mismatches are generally much smaller in the red region than in the blue region, in agreement with the results of Hiner et al. (in preparation).
The velocity dispersions measured from the blue and red regions agree within the uncertainties. In order to get representative velocity dispersions for each object, we average the two values weighted by their uncertainties and the goodness of fit (as given by ). The weighted averages with their uncertainties (including systematic uncertainties added in quadrature) are listed in the last column of Table 3.
3.2 Galaxy Morphologies
We analyzed the imaging data with the two-dimensional modeling program GALFIT (Peng et al., 2002) to achieve three primary goals: (1) to obtain photometry of the nucleus to be used in the measurement of , (2) to determine the size and characteristics of the bulge component, if present, and (3) to search for signs of interaction in order to properly interpret our results.
It is imperative that the appropriate PSF is used when modeling galaxy morphologies. Empirical PSFs are ideal for this purpose, as they reflect the same instrumental conditions that were used for the observations. We searched the archive for high signal-to-noise stars (typical peak counts were ) that were observed with the same instrument and filter and that fell near the same CCD position as the QSOs. The input PSF image must be large enough to encompass the wings of the function, so we chose a large region and interpolated across extraneous sources within the region. Since the PSF is undersampled in the PC image, we broadened it with a Gaussian of pixels. This increased the full-width at half-maximum (FWHM) of the PSF to be greater than 2 pixels, while preserving the encompassed flux.
The science images need to be large enough to accurately estimate the background sky level. This is especially important, because the edges of galaxy profiles are sensitive to the background sky level, and can affect, for example, the Sérsic index, , of the profile fit to the galaxy. We cut each image to 15”.75 by 15”.75 (350 pixels x 0.045 arcsec pix-1) centered on the science target, which is several times the size of the targets themselves. This large region sometimes included other objects, which we either masked from the fit or fit with an extra component. To match the resolution of the PSF, we also broadened the science images with the same Gaussian used on the PSF.
We followed an iterative process while fitting the morphologies of the galaxies. Each fit included the point source (a scaled PSF) and background sky level estimated by GALFIT. We began with simple models of single bulge or disk components for the host galaxies and added complexity as necessary. All but one of the galaxies required two or more components to model the host. Where the image showed multiple objects in the field, the secondary object was fit with its own component or masked from the fit. We generally used free index Sérsic profiles to model the bulges, but in many cases, GALFIT did not converge on a reasonable Sérsic index. To fit these hosts, we ran several iterations of GALFIT holding the index constant at values 1, 2, 3, and 4. In each case the fit the image the best. We adopted the best-fit models based on the values and residuals of the model subtracted image.
We report magnitudes for the best fits of each of the targets. Visual inspection of the residual images indicates that the point source and PSF were slightly mismatched. In order to estimate the uncertainty in the magnitudes, we also performed a direct PSF subtraction and determined the upper and lower limits for which the PSF was clearly over- and under-subtracted, respectively. The magnitudes measured by direct subtraction were, in each case, within 0.1 mag of the value obtained from the GALFIT fits, except for 005055.7293328, for which the difference was 0.36 mag. Our measured magnitudes are systematically fainter than those reported by Marble et al. (2003), with the differences ranging from less than 0.1 mag to 1.1 mag in the most extreme case (165939.7183436). The differences likely arise from the fact that we fit simultaneously a PSF with the different components of the host galaxy (e.g., bulge and disk), so the nuclear fluxes that we measure are less likely to be contaminated by light from the host galaxy. Another reason for the differences in magnitudes may be the choice of PSFs: Whereas we selected empirical PSFs from the archive, Marble et al. (2003) used one of the QSOs in their sample as the PSF to subtract from all the other QSOs. They chose 222202.2195231 since it did not show significant extended emission after subtracting an artificial PSF created with the software package Tiny Tim (Krist and Hook, 2001).
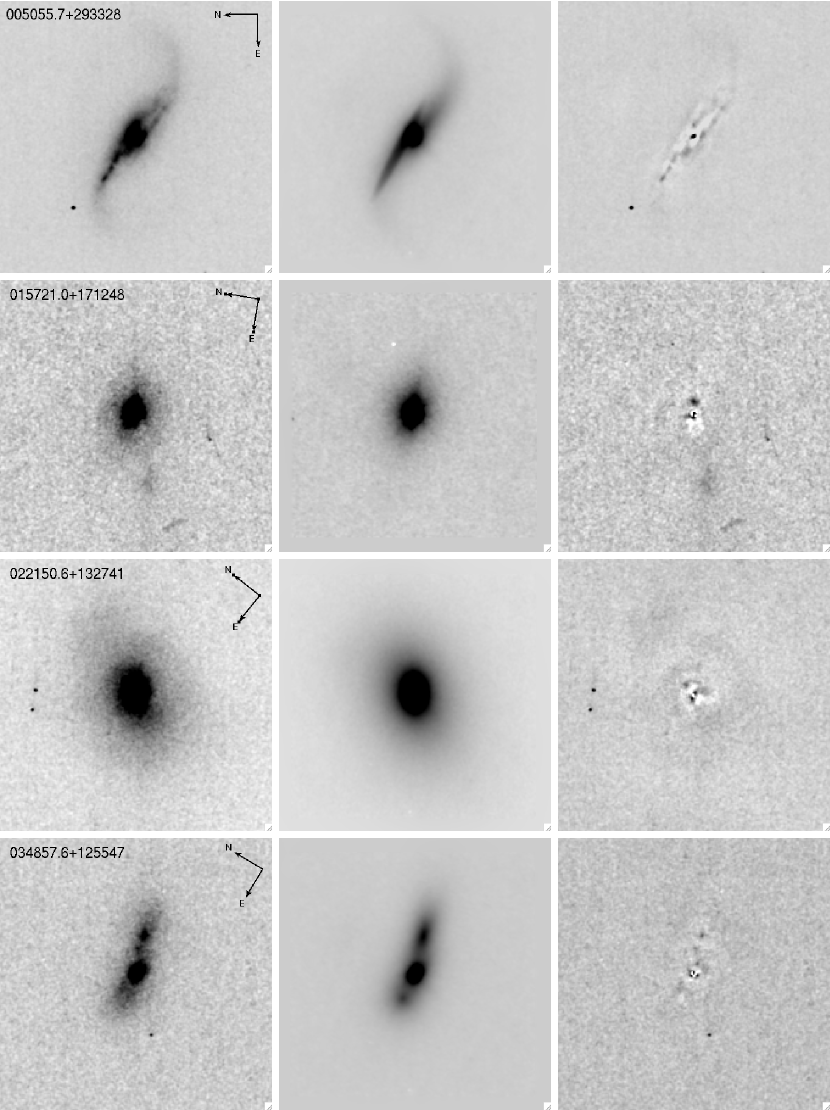
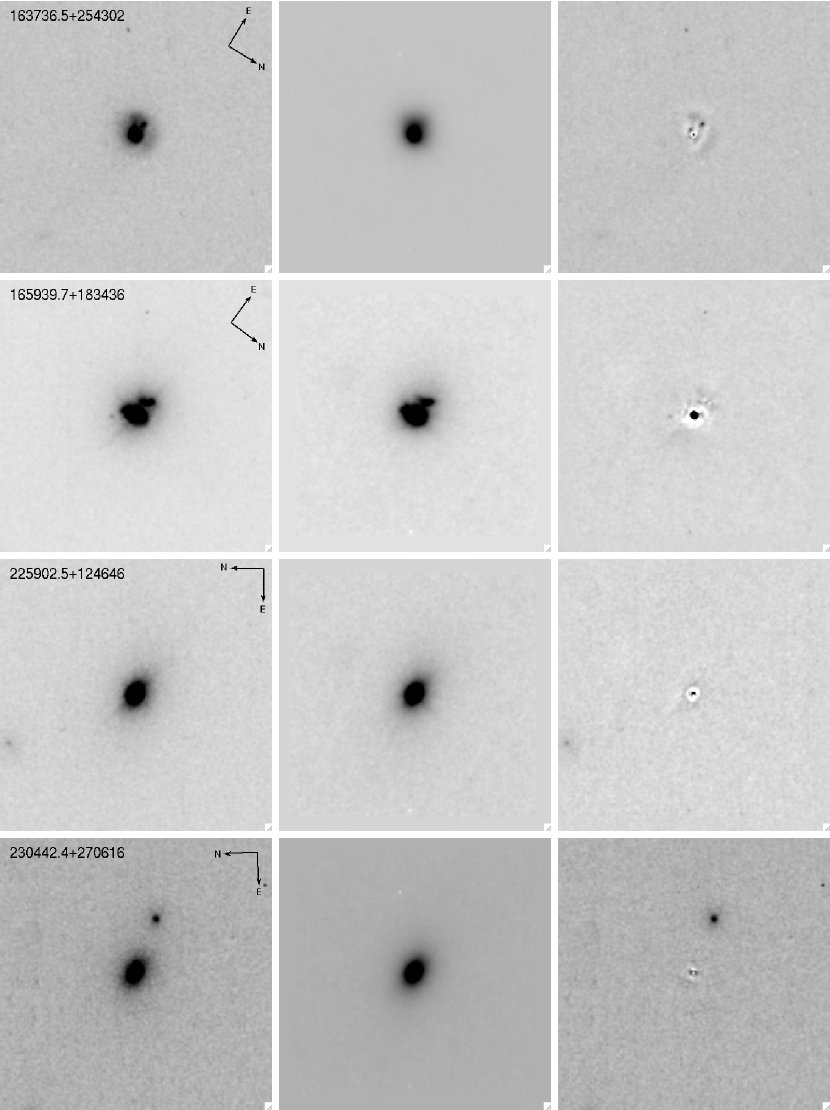
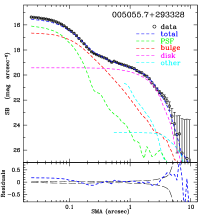
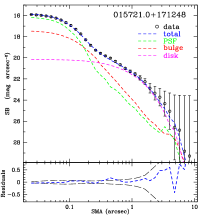
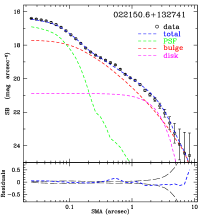
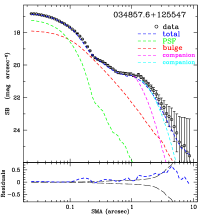
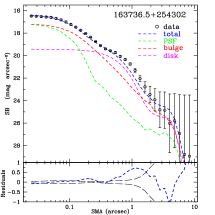
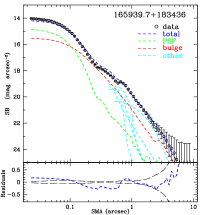
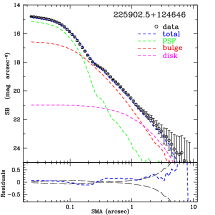
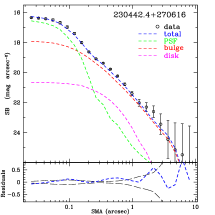
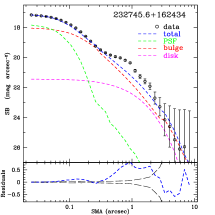
In Table 4 we list the magnitudes of the PSF and Sérsic components used to fit each object. The magnitudes are apparent F814W magnitudes, not corrected for Galactic extinction nor K-corrected, to allow for direct comparison with results published by Marble et al. (2003). Every object appears to have a clear bulge component. In Figs. 4a, 4b and 4c we show the image, the best fit model, and the residuals after subtraction of each of the targets. One-dimensional surface brightness profiles of each object, including all the components used to model them, are shown in Fig. 5.
| QSO | Component | Sérsic Index | |||
|---|---|---|---|---|---|
| (2MASSi J) | (mag)a | () | (kpc) | ||
| (1) | (2) | (3) | (4) | (5) | (6) |
| 005055.7293328 | PSF | 20.50 | |||
| bulge | 19.27 | 0.22 | 0.52 | 4 (fixed) | |
| disk? | 19.42 | 3.46 | 8.22 | 0.15 | |
| arms | 18.56 | 1.89 | 4.50 | 0.63 | |
| 015721.0171248 | PSF | 20.45 | |||
| bulge | 20.67 | 0.19 | 0.67 | 4 (fixed) | |
| disk | 19.86 | 0.72 | 2.50 | 1 (fixed) | |
| 022150.6132741 | PSF | 21.17 | |||
| bulge | 17.93 | 2.89 | 7.04 | 4 (fixed) | |
| disk | 18.88 | 2.13 | 5.19 | 0.5 | |
| 034857.6125547 | PSF | 21.57 | |||
| bulge | 19.80 | 0.79 | 2.70 | 5.8 | |
| companion | 20.88 | 0.44 | 1.51 | 1 (fixed) | |
| companion | 20.08 | 0.70 | 2.40 | 1 (fixed) | |
| 163736.5254302 | PSF | 21.37 | |||
| bulge | 19.88 | 0.22 | 0.92 | 4.7 | |
| disk | 19.87 | 0.49 | 2.04 | 0.6 | |
| 165939.7183436 | PSF | 19.11 | |||
| bulge | 18.21 | 0.26 | 0.76 | 4 (fixed) | |
| 225902.5124646 | PSF | 19.40 | |||
| bulge | 18.82 | 0.41 | 1.33 | 3.7 | |
| disk | 19.51 | 1.20 | 3.89 | 1 (fixed) | |
| 230442.4270616 | PSF | 20.70 | |||
| bulge | 19.23 | 0.98 | 3.65 | 4 (fixed) | |
| disk | 21.50 | 0.32 | 1.18 | 1 (fixed) | |
| 232745.6162434 | PSF | 22.12 | |||
| bulge | 19.20 | 1.30 | 6.56 | 4 (fixed) | |
| disk | 20.07 | 1.03 | 5.22 | 1 (fixed) |
Note. — a F814W magnitudes not corrected for Galactic reddening or for intrinsic reddening.
The object 005055.7293328 is hosted by a spiral galaxy and has a prominent dust lane in the central region. In order to obtain the best estimate for the nuclear flux we fit the host galaxy with multiple components so as to minimize the residuals after subtraction. The best fit included the spiral arms, disk, bulge, and an additional narrow Sérsic profile (not included in Table 4) to account for the asymmetric light distribution due to the dust lane. While fitting all these components allows us to obtain a good fit for the PSF, it is likely that we are underestimating the flux and the effective radius of the bulge, since we are splitting it into two components.
3.3 Black hole mass estimates
We estimated virial masses for the BHs in the sample by using the scaling relation for H given by Greene et al. (2010):
| (2) |
Greene et al. use the virial coefficient measured by Onken et al. (2004), i.e., = 5.5, which is a factor of 1.8 higher than the value assumed for a spherically symmetric broad line region (e.g., Kaspi et al., 2000). This value is also consistent with that found by Woo et al. (2010) from a sample of reverberation mapped AGN. Although Graham et al. (2011) find a lower virial factor (i.e., 2.8), we adopt = 5.5 since this allows us to compare our results directly with those of previous studies (see §4).
In the scaling relation for virial masses, the size of the broad line region is a function of the FWHM of the broad component of H, FWHMHα, and the AGN continuum luminosity at rest frame 5100 Å, . Here we describe our procedure to measure each of these two quantities.
3.3.1 Measuring FWHMHα
In order to measure the width of the broad H line, we first had to do a detailed decomposition of the narrow H component and the narrow N II 6548, 6583 lines. We performed all the line fits using the specfit task (Kriss, 1994) in the IRAF STSDAS package, and following the method outlined by Glikman et al. (2007) and Greene and Ho (2004), as described below.
First, we created a narrow line model by fitting the S II 6716, 6731 doublet. The line profiles often showed blue wings. Thus, we fit each line using two Gaussians, one of which was allowed to have skew (or asymmetry), although we found that skew was not needed in all cases. The continuum was fit simultaneously with a power law function. To ensure the same model fit for both lines, and to avoid unrealistic degeneracies, we constrained the model for each line of the doublet to be the same. This was done by matching the widths of each
component and the relative positions of the doublet. Because we used a two-Gaussian model, an extra constraint on the flux ratio was necessary to ensure the same total model for each line. Garstang (1952) calculates the transition probability and intensity ratio of the doublet 4S - 2D transition in S II. He finds it can range from 0.5 to 0.8 depending on the parameters used in the calculation. However, he also cites a reasonable observed value of 0.74 based on NGC 7662. We adopted this observed value for our S II fits, as it produced the most reasonable fit of the range.
In some cases the S II doublet was contaminated by the H broad emission or telluric absorption. In these cases we fit the [O III] 4959, 5007 doublet to create a narrow line model. Similar techniques as with the S II doublet were used to fit the [O III] doublet. In this case the doublet flux ratio was constrained to 2.87 (Osterbrock and Ferland, 2006), which was a good fit for our data.
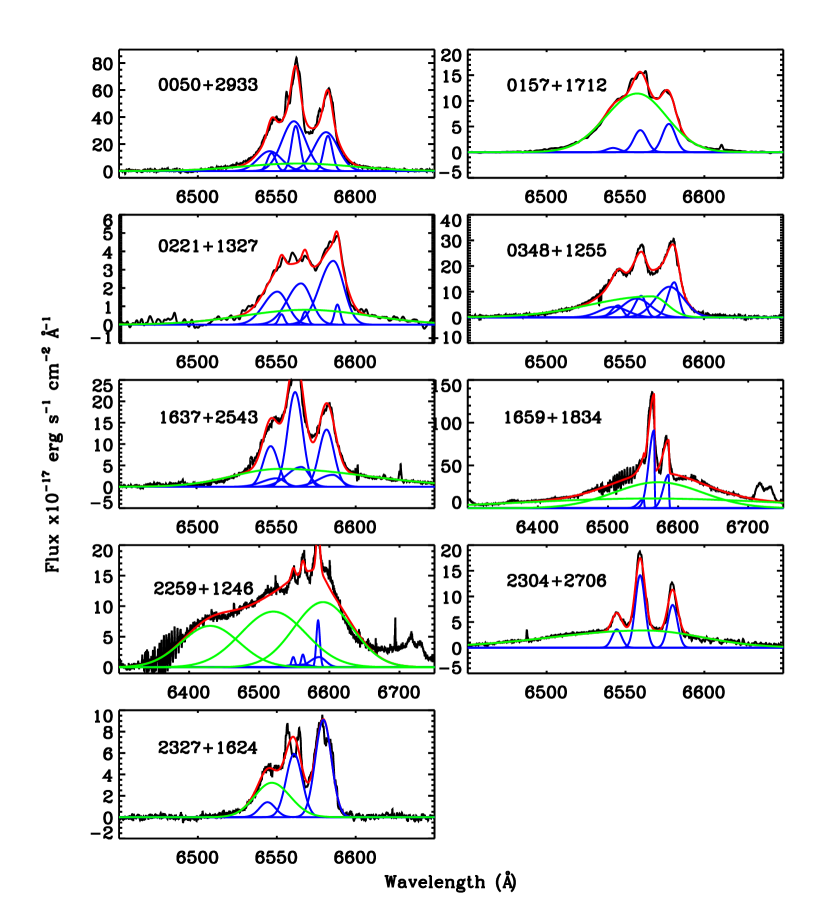
We then fit the region around H using the narrow line model for N II 6548 and N II 6583. We constrained the relative position of the N II lines using the laboratory wavelengths for these lines. While Glikman et al. (2007) constrained the N II flux ratio to a theoretical value of 2.96, we found better fits when we let the flux of each N II line be freely fit. This often resulted in a flux ratio greater than 2.96. In addition, we included a narrow line component of H using the fitted narrow line model and we used a power law to characterize the continuum. Finally, we included a broad Gaussian (with initial width of 5000 km s-1) to model the broad line H component. We first fixed the broad H line to be symmetric, then added skew after its centroid position had been located by the fitting routine. We show the best fits with each of their components in Fig. 6.
Specfit uses a simplex method to minimize . We adjusted input parameters and initial step sizes iteratively to probe different local minima and thus found the global minimum. The errors in the FWHMHα resulting from the fit are typically 15 km s-1. The true uncertainties, however, are much larger since they are dominated by the uncertainties in the modeling of the narrow component and the decomposition of the broad and narrow components.
In addition, although the AGN is much less extinguished in these wavelength regions than in the regions where we measure , there is still significant contribution from the host galaxy to the continuum around H. We found that subtracting different stellar H absorption lines (corresponding to different stellar templates or stellar populations) has no measurable effect on the value of FWHMHα. However, the shape of the stellar continuum around H is different for different stellar populations, and this can potentially affect the fitting of the broad component, especially for the objects with the broadest emission lines. Thus the choice of stellar template to subtract from the AGN spectrum introduces a systematic uncertainty. In order to estimate this uncertainty, we measured FWHMHα from the different template-subtracted emission lines and found the standard deviation for the different measurements. We added this uncertainty in quadrature to the fitting and systematic errors.
The final values for FWHMHα and their uncertainties are listed in Table 5. The FWHMHα we measure for 225902.5124646 is highly uncertain because H has a very asymmetric profile, with very extended emission on the blue side of the line. This is likely indicative of an outflow, so that the we derive from it may not be reliable. We attempted a variety of ways to separate the core of the line from the outflow, by fitting the latter with multiple Gaussians blueshifted with respect to the core. In order to ensure that we obtain a conservative measure of , we chose the smallest value of FWHMHα that would fit the line. The upper limit on the errors is given by the FWHM that would be obtained if a single Gaussian were used to fit the broad profile.
We note that some studies, including those of reverberation mapped AGN (e.g., Woo et al., 2010) use line dispersions rather than FWHM to calculate . However, these measurements are based on rather than H. For our study, we are unable to measure the line dispersion or FWHM of H, since the AGN is still highly obscured at those wavelengths. Instead, we must use H as a proxy for H. The relations between these two lines in the literature are currently much better constrained for FWHM than for line dispersions. For example, the relation between FWHMHα and FWHMHβ used by Greene et al. (2010) is derived by fitting 162 objects
(see Greene and Ho, 2005, for details), whereas McGill et al. (2008) derive their relation for H line dispersions from only 19 objects. Thus, we use the relation for FWHMHα rather than that for line dispersions. This choice does not affect our main results: if we were to use line dispersions rather than FWHMHα, the resulting would be, on average, 0.08 dex greater.
| Object | QSO | Weighted | FWHMHα | E() | ||
|---|---|---|---|---|---|---|
| ID | (2MASSi J) | avg. | (km s-1) | (1044 erg s-1) | (108 ) | |
| 1 | 005055.7293328 | 1.64 | 2.521.24 | |||
| 2 | 015721.0171248 | 2.13 | 18.742.05 | |||
| 3 | 022150.6132741 | 1.76 | 1.780.24 | |||
| 4 | 034857.6125547 | 1.68 | 4.160.95 | |||
| 5 | 163736.5254302 | 1.93 | 14.132.21 | |||
| 6 | 165939.7183436 | 0.39 | 0.940.24 | |||
| 7 | 225902.5124646 | 0.84 | 4.030.55 | |||
| 8 | 230442.4270616 | 0.99 | 1.710.47 | |||
| 9 | 232745.6162434 | 1.93 | 19.165.57 |
3.3.2 Measuring
The AGN continuum flux at rest frame 5100 Å cannot be measured directly from our ESI spectra for two primary reasons: (1) The continua of red QSOs suffer from significant extinction at short wavelengths, and this extinction needs to be properly measured. (2) The spectrum in this wavelength region has a large contribution from the host galaxy that also needs to be accounted for.
In order to obtain the unobscured QSO flux at 5100 Å, we first measured the extinction for each object by modeling its spectrum. As described in §3.1, we modeled the QSO continuum by including a polynomial (in space) in the fitting procedure to obtain . The resulting polynomial, , is then a good representation of the reddened QSO. In order to estimate E(), we compared the polynomial to the Sloan Digitized Sky Survey (SDSS) composite QSO spectrum (Vanden Berk et al., 2001) reddened with a Small Magellanic Cloud (SMC) reddening law (Prevot et al., 1984; Bouchet et al., 1985), with E() as a free parameter. The values of E() that we obtained using this procedure are listed in Table 5. Two thirds of our objects span a range of E() values comparable to those found by Urrutia et al. (2009) in a sample selected from the FIRST-2MASS Red Quasar Surveys (Glikman et al., 2007), i.e., E() . The remaining three objects, however have E() . Typical errors in E() derived from the fits are 0.1.
Whenever possible, we also estimated E() using H/H ratios. Naturally, the values for these ratios become more uncertain with increasing extinction, so we only estimated E() for the seven objects for which we could obtain reliable ratios. The resulting E() values were generally consistent with the values obtained from the fitting procedure, although the two could differ by as much as E()0.3. We found no trend in the way the two values differed; the average E() of the seven objects measured from the Balmer decrement was 1.49, compared to 1.45 as inferred from modeling the AGN continuum. Since there is no a priori reason why the continuum and broad emission lines should suffer the same amount of extinction, we only used the Balmer decrement estimates as a rough comparison to make sure the reddening estimates derived from the model were reasonable.
As a further test, we subtracted the corresponding reddened SDSS composite spectrum from the spectrum of each of our targets to recover the host galaxy spectrum. There were some QSO features that were over- or under-subtracted in the resulting host galaxy spectra. This is caused by the mismatches between the SDSS composite spectrum and the intrinsic spectra of our QSOs. Indeed, the greatest source of uncertainty in the final values of comes from such mismatches. However, the overall spectral energy distribution (SED) of each host galaxy matched the shape of the SED that would be expected for a galaxy with the given set of stellar absorption features observed in that galaxy.
Once we had determined the intrinsic reddening for each object, we scaled each continuum model, , to match the observed flux of the corresponding QSO nucleus, as measured from WFPC2 F814W images using GALFIT (see Table 4) and corrected for Galactic extinction using the values given by Schlegel et al. (1998). Thus we constructed continua of the reddened QSOs without galaxy contamination and taking into account flux loses due to the slit. Finally, we corrected these continua for intrinsic extinction (using the values listed in Table 5) and measured the the flux of each QSO at rest-frame 5100 Å. As mentioned above, the greatest source of uncertainty comes from measuring E() by making the assumption that the intrinsic continuum shape of our sources is equal to that of the SDSS composite QSO. The uncertainties for listed in Table 5 include the uncertainty in the intrinsic power-law index, (conservatively assumed to be 0.05; Vanden Berk et al. (2001)) as well as the uncertainty in measuring E() by the process we outline above.
The black hole masses derived from our measurements of FWHMHα and are listed in Table 5. For completion, we also repeat the values of from Table 3 in Table 5. As mentioned before, using line dispersions rather than FWHM to estimate black hole masses results in masses that are, on average, 0.08 dex greater than those presented in this table.
4 Results
Our results are summarized in Fig. 7, where the 2MASS red QSOs are plotted as black circles. We also plot objects from Woo et al. (2010), which include the 24 local AGN that have published and from reverberation mapping (green squares), as well as the - relation derived by Woo et al. from that sample (green dashed line). For reference, the - relation for inactive local galaxies measured by McConnell et al. (2011) is plotted as a blue dotted line.
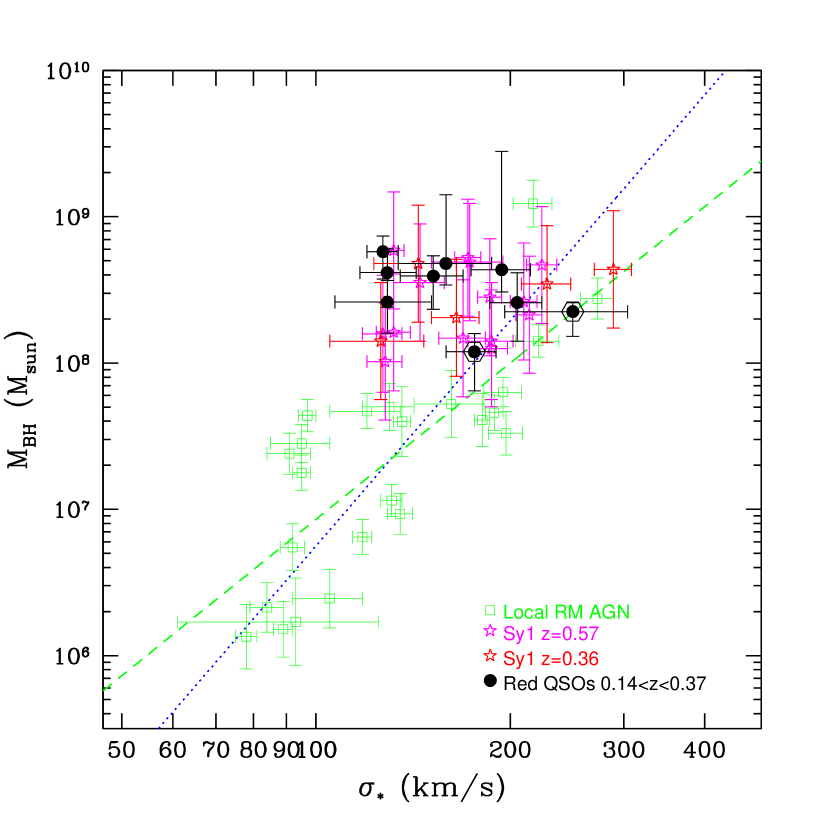
The majority of the red QSOs are clearly above the local relations. We have specifically compared our sample to AGN only to avoid any potential biases introduced by comparing active to quiescent galaxies (Lauer et al., 2007), and we have used a virial coefficient consistent with that found by Woo et al. (2010) from the reverberation mapped AGN sample. Woo et al. (2010) estimate an intrinsic scatter of 0.43 dex for their relation including all morphological types. In contrast, our objects are, on average, 0.80 dex above the Woo et al. relation, with six out of nine of them having log() above the intrinsic scatter. Comparison with the McConnell et al. relation for quiescent galaxies yields a similar, although smaller, discrepancy: our sample is, on average, 0.65 dex above the relation, and with five objects being above the intrinsic scatter.
When comparing our objects to those of Woo et al. (2010), it is pertinent to consider possible differences in the width of H when measured from single epoch (SE) spectra versus rms spectra from reverberation mapped objects. Park et al. (2012) find that H is broader in rms spectra than in SE spectra, although the difference between the two decreases as the intrinsic width of the broad lines increases. Park et al. present a prescription to correct for this effect in relatively narrow-lined (3000 km s-1 ) objects. To get an idea of how much this effect might impact our results, we can assume that the correction for H holds for H, and that it is a reasonable approximation for the objects in our sample with broader H as well. With those assumptions, if we apply equation (8) of Park et al. to correct the FWHMHα in Table 5, we find that the black hole masses of the objects in our sample decrease by 0.13 dex on average. This correction, however, is not enough to bring the objects to agreement with the local - relation, as they would still be, on average, 0.67 dex above the Woo et al. (2010) relation. Even if the correction for H and/or for objects with broader lines were greater, it is unlikely to be large enough to account for the offset we observe.
It is important to consider other potential biases that may be present in our sample. First, the morphology of the host galaxies could introduce a bias. It has been shown that the precise form of the - relation has a dependence on the morphology of the galaxies in question (e.g., Graham et al., 2011), and that pseudobulges do not follow the same relation (Kormendy et al., 2011). As can be seen in Table 4, every host galaxy in our sample has a bulge component that is best fit by a Sérsic of index . Although most of the galaxies also appear to have a disk component, the majority (7/9) are clearly dominated by the bulge. In order to investigate how the presence of the disk may affect our measurement of in the bulges, we tested whether they follow the Faber-Jackson relation (Faber and Jackson, 1976). In the left panel of Fig. 8, we plot velocity dispersions vs. absolute Cousins I magnitudes of the bulge components of the galaxies. The latter were obtained using the output magnitudes from GALFIT given in Table 4 corrected for Galactic reddening, applying k-corrections for the spectral type of each galaxy and passive evolution using the on-line calculator from van Dokkum and Franx (2001). The dashed line in the left panel of Fig. 8 is the Faber-Jackson relation from Nigoche-Netro et al. (2010). Nigoche-Netro et al. use a sample of 90,000 SDSS-DR7 early-type galaxies to calculate the Faber-Jackson parameters (i.e., A and B in log = A - BMr) for different magnitude ranges. Our objects span a magnitude range of , or (AB magnitudes, using the transformation equations given by Jester et al., 2005). In this magnitude range, Nigoche-Netro et al. (2010) find A = 0.1520.009 and B = 0.9760.193. Note that the relation of Nigoche-Netro et al. is measured in the SDSS r-filter, and we have simply transformed it to Cousins-I, without accounting for potential wavelength-dependent differences in the slope.
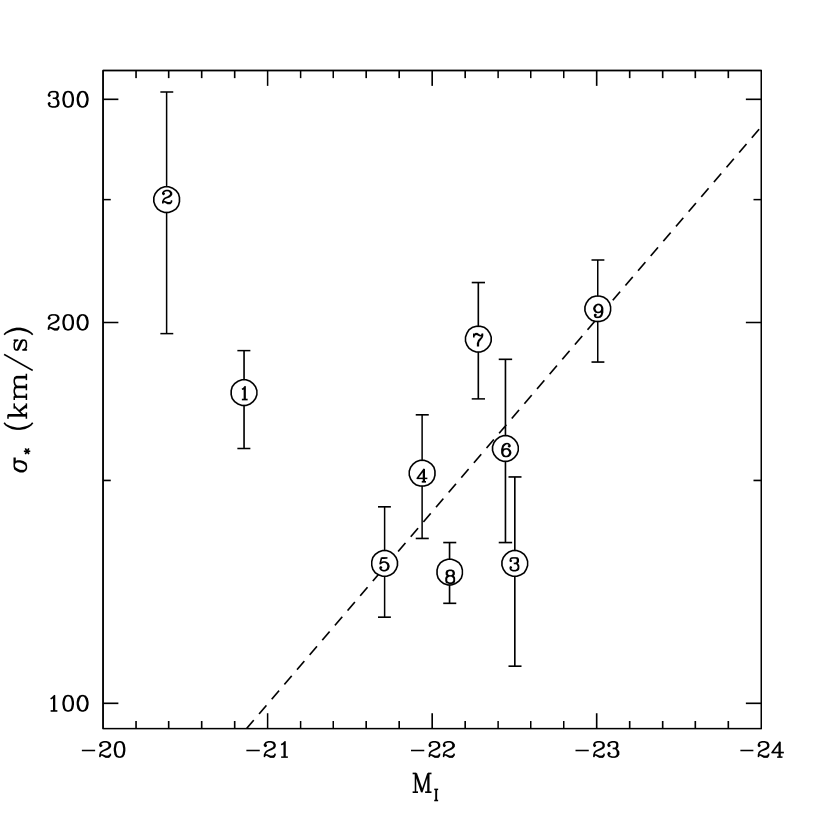
Two host galaxies fall clearly off the relation: those of 005055.7+293328 and 015721.0+171248 (objects # 1 and 2, respectively), both of which have disks with luminosities comparable to, or greater than, their corresponding bulges. As described in § 3.2, the host galaxy of 005055.7+293328 has prominent nearly edge-on disk with spiral arms and a dust lane that goes through the bulge. To mimic the dust lane, we fit this object with two separate components, so we almost certainly underestimate the flux contained in the bulge. Marble et al. (2003) fit a single component to the host galaxy of this object and find a MI = 22.3. This magnitude would bring the position of the object to agreement with the Faber-Jackson relation. The other object, 015721.0+171248, is the only one in the sample that has a disk that is more luminous than the bulge. The rotating component from a dynamically cold disk can bias toward higher values (when the disk is edge-on) or lower values (when the disk is face-on; see e.g., Bennert et al., 2011a). Although the disk of 015721.0+171248 has a lower inclination than that of 005055.7+293328, its velocity dispersion may still be somewhat increased by the dynamically cold component. More importantly, 015721.0+171248 is the only object for which there is significant QSO contamination in the stellar absorption line spectrum, so that we were not able to obtain a reliable fit of for the red region. We have marked both of these objects with hexagons in Figs. 7 and 11 to indicate that the measured in these objects may not be representative of normal bulges. Interestingly, these are the two objects that fall closest to the local AGN - relation, and removing them from the analysis only accentuates the offset of the red QSO sample with respect to the local relation.
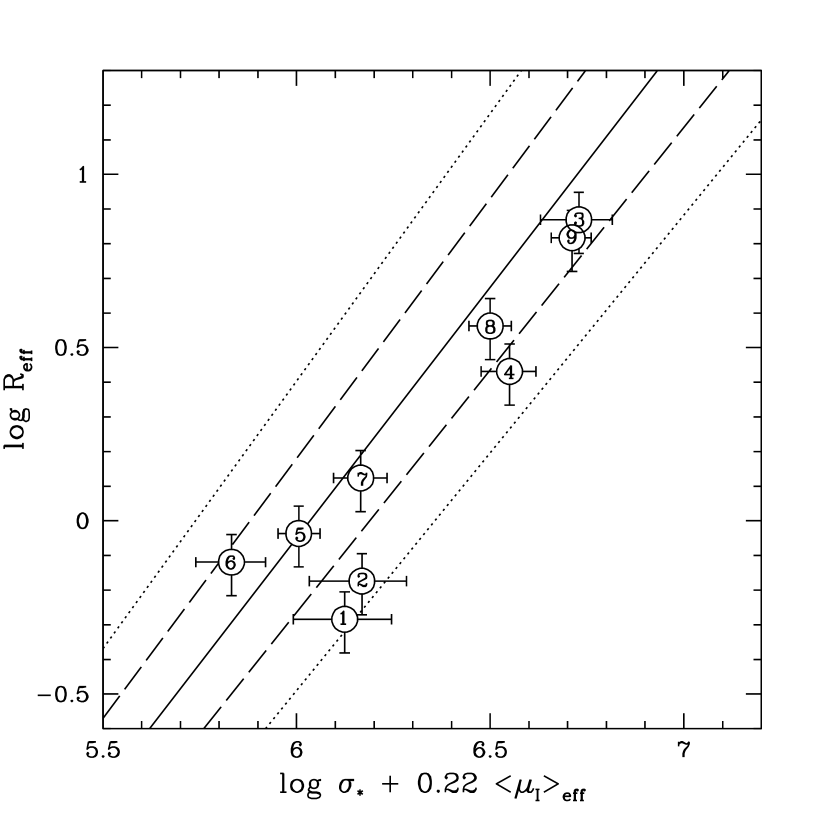
We also consider the position that the bulges in our sample occupy on the Fundamental Plane (FP; Djorgovski and Davis, 1987). We obtain as an output parameter from GALFIT, applying k-corrections and passive evolution to as above, as well as correcting from cosmological dimming. We compare it to the FP relation derived by Hyde and Bernardi (2009) from a sample of 50,000 SDSS-DR4 (with parameters from DR6) early-type galaxies at . Here we use their orthogonal fit to the plane in the SDSS band and we have transformed it to Cousins-I, using the corrections prescribed by Rothberg et al. (2012). The solid line in Fig. 8 (right panel) corresponds to the coefficients given in Table 2 of Hyde and Bernardi (2009), and the dashed and dotted lines correspond to the values that enclose 68% and 95% of their SDSS early-type galaxies, respectively. While, on average, our objects fall below the FP, they are consistent with the scatter in the relation. The two objects that are off the Faber-Jackson relation also appear to be the ones with the largest offset from the FP.
Besides the effects of a potential dynamically cold component on , we need to consider the possibility that we are measuring in systems that are not dynamically relaxed. At least a third of the host galaxies in our sample show clear signs of interactions (Figs. 4a, 4b, 4c). Many of the numerical simulations that are successful at reproducing the - relation presuppose that AGN activity is triggered by mergers (e.g., Robertson et al., 2006a, b; Hopkins et al., 2006). However, they predict the value after the system has reached dynamical equilibrium. To investigate the evolution of during mergers, Stickley and Canalizo (2012) use N-body simulations of merging galaxies to perform a flux-weighted measurement of through a diffraction slit. They find that, typically, tends to increase right after the first passage, followed by a period of oscillation about the value that eventually reaches once the system comes to dynamical equilibrium. Thus, the observed value of in our objects could potentially be different from their corresponding equilibrium value, depending on the precise merger stage at which we happen to be observing them. However, Stickley and Canalizo estimate that, even in extreme cases, the observed value of should fall between 70% and 200% of the quiescent value, and the probability that the observed value of will actually be far from the equilibrium value is rather small. Therefore, even in the highly unlikely case that our entire sample is caught during an oscillation stage when has a lower value, the predicted quiescent value would not be high enough to bring our sample to agreement with the local - relation. Moreover, using more sophisticated high-temporal resolution numerical simulations, Stickley and Canalizo (in preparation) find that the time at which the value of shows significant deviations from the equilibrium value preceeds the period of measurable accretion onto the black hole (i.e., the time when the object appears as a QSO).
Another possibility is that dust in the host galaxy may be obscuring a fraction of the stars and this may result in a biased measurement of . With the exception of 005055.7+293328, we find no clear evidence for significant amounts of dust in the host galaxies of the red QSOs. Their spectra show that, while the nucleus suffers from strong extinction, the host galaxies are not significantly reddened. As mentioned in § 3.3.2, after subtracting a reddened QSO spectrum, the overall SED of each host galaxy matches the shape of the SED that would be expected from the observed stellar absorption features. This indicates that there is no severe reddening in the host galaxies. Moreover, if the bulges of these galaxies were significantly reddened, they would not fall on the Faber-Jackson or FP relations (see Fig. 8). However, we cannot rule out the possibility that a modest amount of dust reddenning (E()0.1) could be present in the hosts. Therefore, it is important to consider the effects that dust in the host galaxy, particularly if located close to the central regions of the bulge, would have on the measurement of . The simulations of Stickley and Canalizo (2012) include a toy model for dust consisting of a slab of gray attenuating material, and show that a lower value of can be measured if the light from stars closer to the central regions is more extinguished than that of stars at larger radii. The specific toy model used by Stickley and Canalizo leads to a decrease on the measured value of 15%. Correcting for this factor would not bring the red 2MASS QSOs to the local - relation. While more realistic models for dust attenuation are needed to truly quantify the effect of dust on the measurement of , we repeat that there is no evidence indicating that our host galaxies suffer from significant dust extinction.
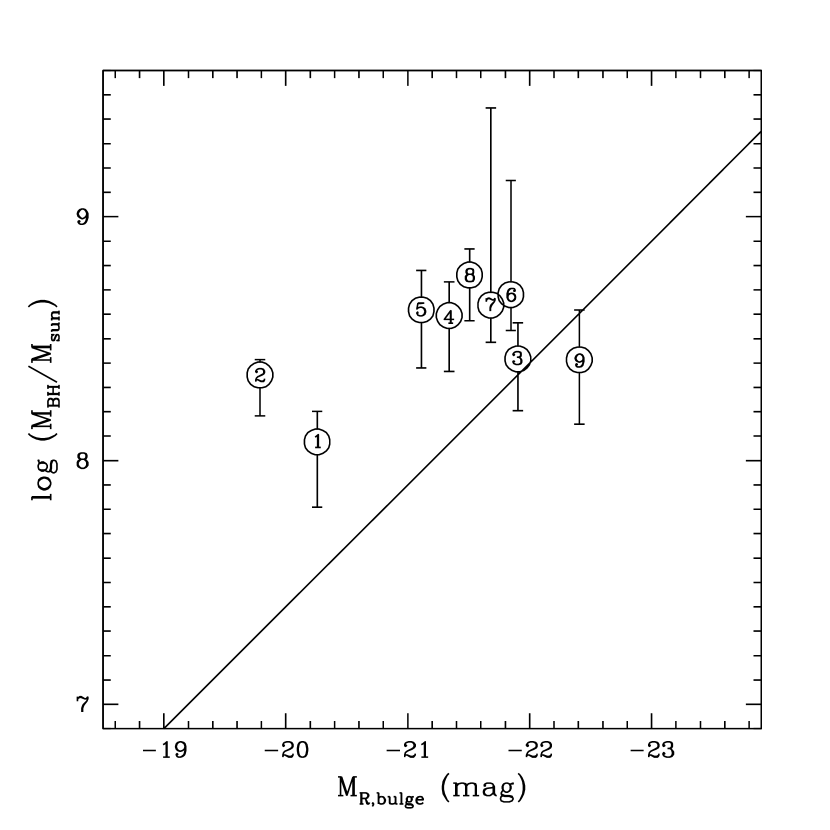
Finally, we consider the bias that may be introduced from the sample selection. The objects were selected based on their near-infrared colors. The selection criterion that objects must have implies that their SEDs will be dominated by the AGN in the near-infrared; if they were dominated by the host galaxy, their colors would be bluer than this. Thus, the host galaxies of the most reddened AGN could possibly be biased toward lower luminosity (and lower mass). We investigate this potential bias by looking at the offset of the objects as a function of near-infrared colors and reddening. First, we plot our objects on the black hole mass - bulge luminosity relation, - Lbulge, in Fig. 9, where we have transformed the bulge magnitudes, MI from Fig. 8 to MR assuming an average = 0.6 for the sample. The solid line in this figure is the local relation for inactive galaxies from Bettoni et al. (2003), as reported by Kim et al. (2008). Not surprisingly, our objects have overmassive BHs with respect to the local relation: they are, on average, 0.89 dex above the relation. Note that two of the objects that have the largest offsets with respect to the relation (objects 1 and 2) are also the two objects that do not follow the Faber-Jackson relation. If we do not include these two objects, then the sample is, on average, 0.69 dex above the relation.
If there were indeed a bias favoring less luminous galaxies for more reddened objects, we should see a trend of an increasing offset from the - relation, MR,bulge, with increasing colors and with increasing reddening, E(). Figure 10 shows no such trends and, in fact, some of the most reddened objects also have the smallest offsets in magnitude. Therefore, we do not see evidence for a bias introduced by the color selection of our sample.


5 Discussion
Our sample appears to have a true offset with respect to the local - relation, in the sense that the black holes in red QSOs are overmassive compared to their host galaxies. Woo et al. (2006, 2008) and Treu et al. (2007) find similar offsets for samples of Seyfert 1 galaxies at and ; their results are plotted along with ours in Fig. 7. Woo et al. (2008) investigate the - relation at three different redshift bins (0.1, 0.36, and 0.57), and conclude that there is evolution at the 95% confidence level. This is at least in qualitative agreement with several studies of the - relation at higher redshifts. Using 51 quasar hosts (mostly lensed), Peng et al. (2006a, b, c) find evidence that the ratio / increases above . Bennert et al. (2011b) find similar results in a sample of X-ray selected, broad-line AGN by deriving stellar masses of the bulge component from multi-filter surface photometry in images. The implication from these and other studies (e.g., Decarli et al., 2010) is that at host bulges were undermassive relative to their BHs (compared to today), suggesting that BHs grew first and bulges have been playing “catch-up.”
While our results appear to be in line with all these studies, they also present additional challenges to the evolutionary picture. Woo et al. (2008) find a potential trend in the evolution of -, if indeed the higher redshift samples are the direct progenitors of the local AGN. They show this clearly in their Fig. 3, where they plot the offset in with respect to the local, quiescent sample of Tremaine et al. (2002). We repeat this plot, including our objects, in Fig. 11, where we have calculated the offsets with respect to the local AGN - relation from reverberation mapped objects (Woo et al., 2010), and we also include the local AGN samples of Bennert et al. (2011a) and Greene and Ho (2006b). The BH masses in the Greene and Ho (2006b) sample have been increased by log(1.8) = 0.255 to account for the difference in the virial coefficient used by Greene and Ho compared to that used in the other studies. Thus, all the BH masses in Fig. 11 assume a virial coefficient of (Onken et al., 2004; Woo et al., 2010).
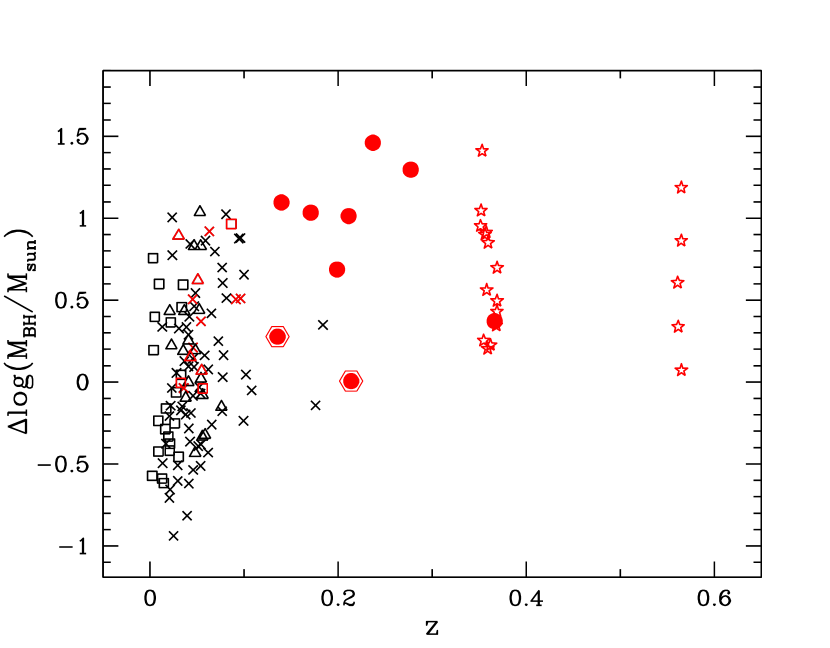
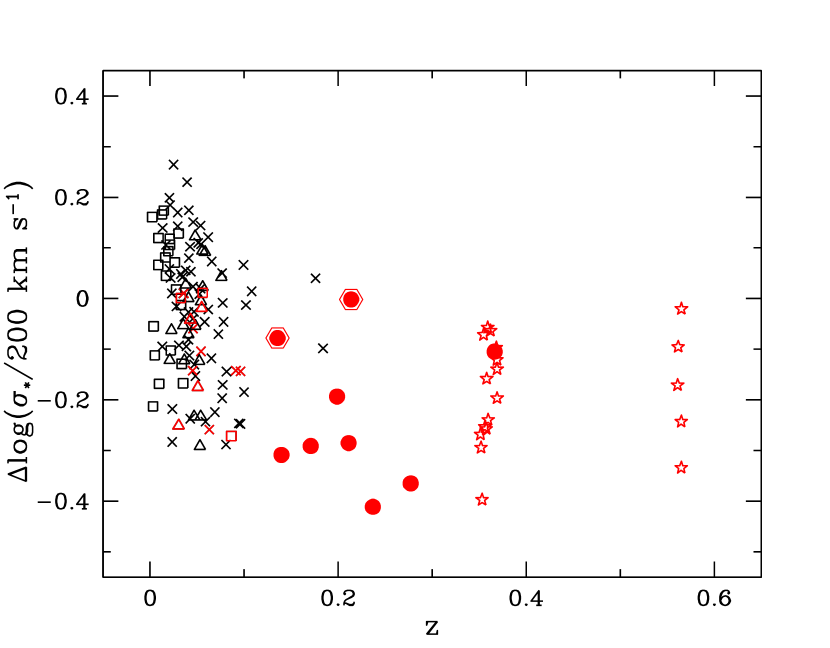
Taken at face value, Fig. 11 would indicate that there is a steep increase in the offset between redshifts of 0.1 and 0.2, and that most of the evolution has occurred in the last 3 Gyrs. Alternatively, in the context of models that find a non-causal origin for the scaling relations (e.g., Jahnke and Macciò, 2011), most of the mass existing in the disks of these objects has been transferred to the bulge through mergers in the last 3 Gyrs. This would also be consistent with our result showing that the two objects with the most significant disk components are also the two objects with the largest offsets in the - Lbulge relation (Fig. 9). However, the comparison between local and higher redshift AGN samples is not straightforward, as the latter have, on average, significantly higher than their local counterparts. Every object at has , whereas there is a dearth of objects in this mass range at lower redshifts. In Fig. 11, we plot all the objects with with red symbols. If we consider the red objects only, the trend with redshift becomes less significant. The red objects at have an average offset of 0.40 dex, compared to 0.80 dex in our sample, and 0.66 dex and 0.61 dex, respectively, in the Seyfert 1 samples at and of Woo et al. (2006, 2008).
The difference in range between the local and the higher- samples is due, at least in part, to the fact that they are drawn from flux-limited samples. In these samples, less luminous objects are not detected at higher redshifts and, since AGN luminosity depends partially on , objects with lower are less likely to be picked. Lauer et al. (2007) describe a potential bias that may be present in samples of AGN at the highest . They show that a bias may arise from the conspiratory nature of a steep luminosity function and intrinsic scatter in the - relation, leading to a selection that favors higher mass BHs over lower mass BHs. Thus studies targeting luminous or massive AGN may find an offset from the local relation that is only due to this selection bias. On the other hand, Treu et al. (2007) run Monte Carlo simulations to investigate the effects on a hypothetical selection function log(/) , which applies to the objects of Woo et al. (2006, 2008) as well as our own. They compare the measured offset to a simulated input offset with respect to the local - and find that the bias is negligible, unless the intrinsic scatter at higher redshifts increases dramatically (of the order of 1 dex). However, the fact that we find an offset from the local relation in all of the objects with , both in the local and the non-local universe, may indicate that there is still some bias at play.
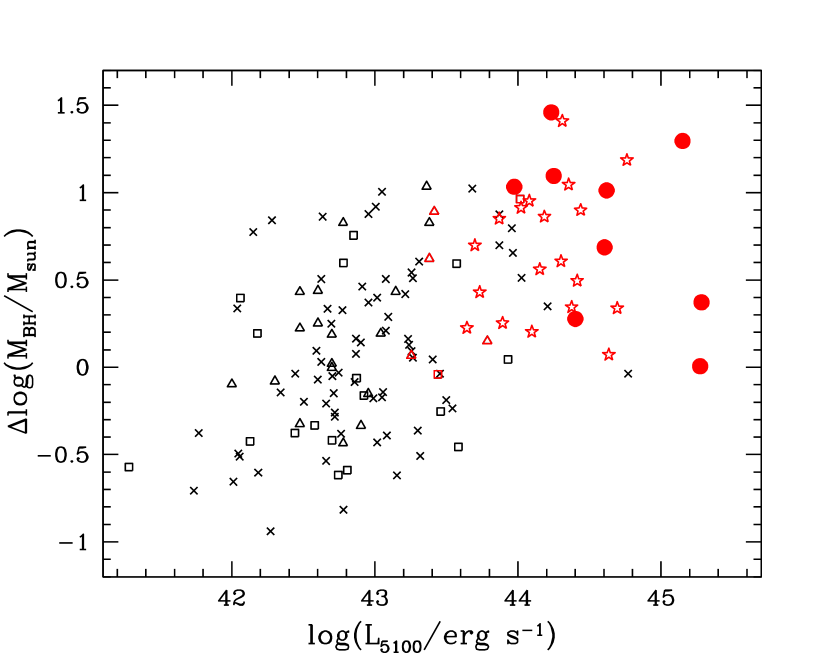
In order to further assess potential biases, we examine the dependence of the - offset on AGN luminosities and Eddington ratios (Figs. 12 and 13). For the reverberation mapped AGN of Woo et al. (2010), we use the values of L5100 published by Park et al. (2012), Bentz et al. (2006), Kaspi et al. (2000), and Denney et al. (2006). For consistency, we transform LHα in the sample of Greene and Ho (2006b) to L5100, using the relations given by Greene and Ho (2005). The resulting plot is shown in Fig. 12. We see a striking trend: The offset increases with luminosity, with virtually all the objects with log(L5100/erg s-1) being above the relation, including those with 108 . Clearly, the majority (two thirds) of high luminosity AGN are in the non-local universe, and this could be driving the trend. However, we note that all of the high-luminosity objects in the local universe follow this trend as well.
One possible way to explain this trend might be if the radius-luminosity () relation somehow changed dramatically at high luminosities, if, for example, a point is reached where the broad line region is matter-bound so that the radius-luminosity relation would flatten. A different relation might also be expected if the SEDs of high luminosity objects are different from those of lower luminosity objects. The data points in Fig. 5 of Bentz et al. (2009) suggest that, indeed, some flattening of the relation may occur at the highest luminosities. However, even if that were the case, the potential flattening occurs at luminosities significantly higher than log(L5100/erg s-1) . In fact, if we were to fit only the objects in the luminosity range of log(L5100/erg s-1) 45.3 (corresponding to the luminous objects of Fig. 12), we would obtain a steeper relation, closer to the relation of Kaspi et al. (2000), and resulting in somewhat higher black hole masses in this range. Thus, variations in the relation cannot account for the trend we see in Fig. 12.
Using semi-analytical models of galaxy evolution, Portinari et al. (2011) find that more luminous QSOs tend to trace over-massive BHs with respect to the intrinsic relation (similar to the bias described by Lauer et al., 2007). However, for objects at , their simulations predict that the parameters of QSO host galaxies closely follow the distribution of those of inactive galaxies, with very small offsets (0.1 dex) in host galaxy mass.
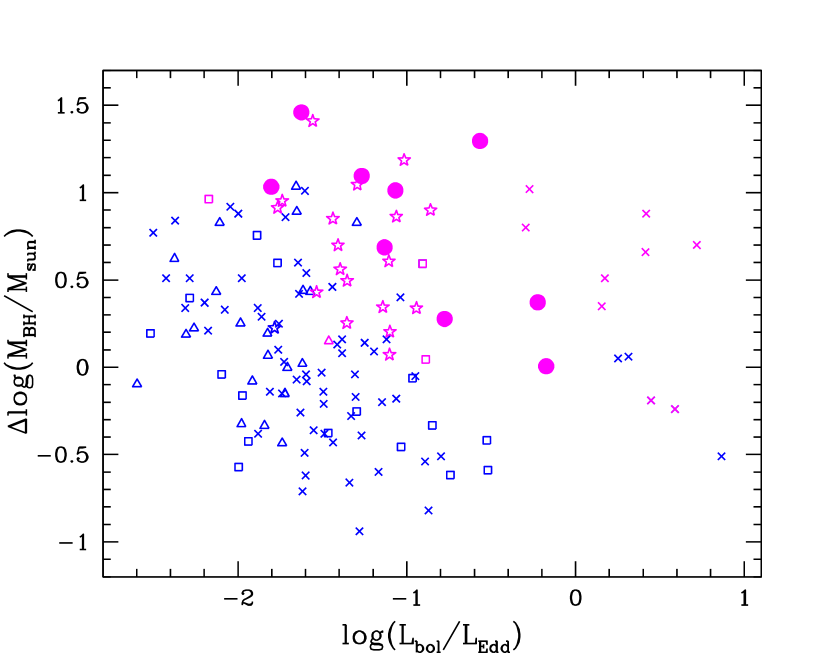
To measure Eddington ratios we obtain rough bolometric luminosities by assuming Lbol = 10 L5100 (Woo and Urry, 2002). The plot of vs. Lbol/LEdd (Fig. 13) shows large scatter and no correlations. However, since Fig. 12 shows that there may be an offset in at high AGN luminosities, it may be instructive to consider separately objects of lower luminosity (log (L5100/erg s-1) 43.5; blue symbols in Fig. 13) and those of higher luminosity (pink symbols). A trend appears to surface: objects with low Lbol/LEdd have more positive offsets with respect to - than those with higher Lbol/LEdd. We caution that the trends may be largely driven by the fact that we are dividing the objects in bins according AGN luminosity, e.g., a highly luminous AGN can have low only if it has a high accretion rate. Such trends of increasing Lbol/LEdd with decreasing have been observed in large flux-limited samples of AGN (e.g., Netzer and Trakhtenbrot, 2007). However, we note that the trends we see in Fig. 13 are in the offset with respect to - and not just in .
A similar trend with respect to -Lbulge was observed by Kim et al. (2008) in a study of 45 type 1 AGN. They find that, at a given bulge luminosity, objects with high Lbol/LEdd have lower . They suggest that this may be explained in terms of the growth phase of BH: If Lbol/LEdd decreases as a function of time during a black hole growth episode, then BH with the highest Lbol/LEdd have more “catching up to do” than those with lower Lbol/LEdd. We searched for this trend by dividing the objects of Fig. 13 in bins of stellar velocity dispersion (as a proxy for bulge luminosity; not shown in Fig. 13). Given the large scatter, we found no significant trends or correlations. We also searched for this trend in our sample by plotting MR,bulge (from Fig. 9) against Lbol/LEdd. Once again, we found a large scatter and no significant trends.
The combination of the potential biases in these samples with the trends that we have uncovered in this study prevents us from making any definitive statements on whether we see evolution with redshift in the - relation. Clearly, better statistics are needed to disentangle the dependence of - on mass, luminosity, accretion rates, and redshift. Studying samples with a wider range of these properties could help us to better understand the scatter and the different biases. For local AGN, Bennert et al. (2011a) indicate a future study of 75 additional AGN with that can be used to probe the local - relation at the highest and, likely, at high luminosities. In the non-local universe, we are conducting a study of additional red QSOs as well as other QSOs that are similarly suited for the study of -, including objects in lower and lower luminosity ranges. We will present results from objects at in forthcoming papers (e.g., Hiner et al., 2012).
References
- Barth et al. (2002) Barth, A. J., L. C. Ho, and W. L. W. Sargent, 2002: A Study of the Direct Fitting Method for Measurement of Galaxy Velocity Dispersions. AJ, 124, 2607–2614.
- Bennert et al. (2011a) Bennert, V. N., M. W. Auger, T. Treu, J.-H. Woo, and M. A. Malkan, 2011a: A Local Baseline of the Black Hole Mass Scaling Relations for Active Galaxies. I. Methodology and Results of Pilot Study. ApJ, 726, 59–+.
- Bennert et al. (2011b) —, 2011b: The Relation between Black Hole Mass and Host Spheroid Stellar Mass out to z~2. ArXiv e-prints.
- Bentz et al. (2009) Bentz, M. C., B. M. Peterson, H. Netzer, R. W. Pogge, and M. Vestergaard, 2009: The Radius-Luminosity Relationship for Active Galactic Nuclei: The Effect of Host-Galaxy Starlight on Luminosity Measurements. II. The Full Sample of Reverberation-Mapped AGNs. ApJ, 697, 160–181.
- Bentz et al. (2006) Bentz, M. C., B. M. Peterson, R. W. Pogge, M. Vestergaard, and C. A. Onken, 2006: The Radius-Luminosity Relationship for Active Galactic Nuclei: The Effect of Host-Galaxy Starlight on Luminosity Measurements. ApJ, 644, 133–142.
- Bettoni et al. (2003) Bettoni, D., R. Falomo, G. Fasano, and F. Govoni, 2003: The black hole mass of low redshift radiogalaxies. A&A, 399, 869–878.
- Bouchet et al. (1985) Bouchet, P., J. Lequeux, E. Maurice, L. Prevot, and M. L. Prevot-Burnichon, 1985: The visible and infrared extinction law and the gas-to-dust ratio in the Small Magellanic Cloud. A&A, 149, 330–336.
- Canalizo and Stockton (2001) Canalizo, G. and A. Stockton, 2001: Quasi-Stellar Objects, Ultraluminous Infrared Galaxies, and Mergers. ApJ, 555, 719–743.
- Cattaneo et al. (2005) Cattaneo, A., F. Combes, S. Colombi, E. Bertin, and A. Melchior, 2005: Spectral and morphological properties of quasar hosts in smoothed particle hydrodynamics simulations of active galactic nucleus feeding by mergers. MNRAS, 359, 1237–1249.
- Cutri et al. (2002) Cutri, R. M., B. O. Nelson, P. J. Francis, and P. S. Smith, 2002: The 2MASS Red AGN Survey. In R. F. Green, E. Y. Khachikian, & D. B. Sanders, ed., IAU Colloq. 184: AGN Surveys, vol. 284 of Astronomical Society of the Pacific Conference Series, pp. 127–+.
- Decarli et al. (2010) Decarli, R., R. Falomo, A. Treves, M. Labita, J. K. Kotilainen, and R. Scarpa, 2010: The quasar MBH-Mhost relation through cosmic time - II. Evidence for evolution from z = 3 to the present age. MNRAS, 402, 2453–2461.
- Denney et al. (2006) Denney, K. D., M. C. Bentz, B. M. Peterson, R. W. Pogge, E. M. Cackett, M. Dietrich, J. K. J. Fogel, H. Ghosh, K. D. Horne, C. Kuehn, T. Minezaki, C. A. Onken, V. I. Pronik, D. O. Richstone, S. G. Sergeev, M. Vestergaard, M. G. Walker, and Y. Yoshii, 2006: The Mass of the Black Hole in the Seyfert 1 Galaxy NGC 4593 from Reverberation Mapping. ApJ, 653, 152–158.
- Djorgovski and Davis (1987) Djorgovski, S. and M. Davis, 1987: Fundamental properties of elliptical galaxies. ApJ, 313, 59–68.
- Faber and Jackson (1976) Faber, S. M. and R. E. Jackson, 1976: Velocity dispersions and mass-to-light ratios for elliptical galaxies. ApJ, 204, 668–683.
- Ferrarese and Merritt (2000) Ferrarese, L. and D. Merritt, 2000: A Fundamental Relation between Supermassive Black Holes and Their Host Galaxies. ApJ, 539, L9–L12.
- Garstang (1952) Garstang, R. H., 1952: Multiplet Intensities for the Lines 4S-2D of S II, O II, and N I. ApJ, 115, 506–508.
- Gebhardt et al. (2000a) Gebhardt, K., R. Bender, G. Bower, A. Dressler, S. M. Faber, A. V. Filippenko, R. Green, C. Grillmair, L. C. Ho, J. Kormendy, T. R. Lauer, J. Magorrian, J. Pinkney, D. Richstone, and S. Tremaine, 2000a: A Relationship between Nuclear Black Hole Mass and Galaxy Velocity Dispersion. ApJ, 539, L13–L16.
- Gebhardt et al. (2000b) Gebhardt, K., J. Kormendy, L. C. Ho, R. Bender, G. Bower, A. Dressler, S. M. Faber, A. V. Filippenko, R. Green, C. Grillmair, T. R. Lauer, J. Magorrian, J. Pinkney, D. Richstone, and S. Tremaine, 2000b: Black Hole Mass Estimates from Reverberation Mapping and from Spatially Resolved Kinematics. ApJ, 543, L5–L8.
- Glikman et al. (2004) Glikman, E., M. D. Gregg, M. Lacy, D. J. Helfand, R. H. Becker, and R. L. White, 2004: FIRST-2Mass Sources below the APM Detection Threshold: A Population of Highly Reddened Quasars. ApJ, 607, 60–75.
- Glikman et al. (2007) Glikman, E., D. J. Helfand, R. L. White, R. H. Becker, M. D. Gregg, and M. Lacy, 2007: The FIRST-2MASS Red Quasar Survey. ApJ, 667, 673–703.
- Graham et al. (2011) Graham, A. W., C. A. Onken, E. Athanassoula, and F. Combes, 2011: An expanded Mbh- diagram, and a new calibration of active galactic nuclei masses. MNRAS, 412, 2211–2228.
- Greene and Ho (2004) Greene, J. E. and L. C. Ho, 2004: Active Galactic Nuclei with Candidate Intermediate-Mass Black Holes. ApJ, 610, 722–736.
- Greene and Ho (2005) —, 2005: Estimating Black Hole Masses in Active Galaxies Using the H Emission Line. ApJ, 630, 122–129.
- Greene and Ho (2006a) —, 2006a: Measuring Stellar Velocity Dispersions in Active Galaxies. ApJ, 641, 117–132.
- Greene and Ho (2006b) —, 2006b: The MBH-∗ Relation in Local Active Galaxies. ApJ, 641, L21–L24.
- Greene et al. (2010) Greene, J. E., C. Y. Peng, and R. R. Ludwig, 2010: Redshift Evolution in Black Hole-Bulge Relations: Testing C IV-Based Black Hole Masses. ApJ, 709, 937–949.
- Gregg et al. (2002) Gregg, M. D., M. Lacy, R. L. White, E. Glikman, D. Helfand, R. H. Becker, and M. S. Brotherton, 2002: The Reddest Quasars. ApJ, 564, 133–142.
- Hall et al. (2002) Hall, P. B., S. F. Anderson, M. A. Strauss, D. G. York, G. T. Richards, X. Fan, G. R. Knapp, D. P. Schneider, D. E. Vanden Berk, T. R. Geballe, A. E. Bauer, R. H. Becker, M. Davis, H. Rix, R. C. Nichol, N. A. Bahcall, J. Brinkmann, R. Brunner, A. J. Connolly, I. Csabai, M. Doi, M. Fukugita, J. E. Gunn, Z. Haiman, M. Harvanek, T. M. Heckman, G. S. Hennessy, N. Inada, Ž. Ivezić, D. Johnston, S. Kleinman, J. H. Krolik, J. Krzesinski, P. Z. Kunszt, D. Q. Lamb, D. C. Long, R. H. Lupton, G. Miknaitis, J. A. Munn, V. K. Narayanan, E. Neilsen, P. R. Newman, A. Nitta, S. Okamura, L. Pentericci, J. R. Pier, D. J. Schlegel, S. Snedden, A. S. Szalay, A. R. Thakar, Z. Tsvetanov, R. L. White, and W. Zheng, 2002: Unusual Broad Absorption Line Quasars from the Sloan Digital Sky Survey. ApJS, 141, 267–309.
- Hiner et al. (2012) Hiner, K. D., G. Canalizo, M. Wold, M. S. Brotherton, and S. L. Cales, 2012: Black Hole - Bulge Relationship of Post-Starburst Quasars at z sim 0.3. ArXiv e-prints.
- Hopkins et al. (2006) Hopkins, P. F., L. Hernquist, T. J. Cox, T. Di Matteo, B. Robertson, and V. Springel, 2006: A Unified, Merger-driven Model of the Origin of Starbursts, Quasars, the Cosmic X-Ray Background, Supermassive Black Holes, and Galaxy Spheroids. ApJS, 163, 1–49.
- Hyde and Bernardi (2009) Hyde, J. B. and M. Bernardi, 2009: The luminosity and stellar mass Fundamental Plane of early-type galaxies. MNRAS, 396, 1171–1185.
- Jahnke and Macciò (2011) Jahnke, K. and A. V. Macciò, 2011: The Non-causal Origin of the Black-hole-galaxy Scaling Relations. ApJ, 734, 92.
- Jahnke et al. (2007) Jahnke, K., L. Wisotzki, F. Courbin, and G. Letawe, 2007: Spatial decomposition of on-nucleus spectra of quasar host galaxies. MNRAS, 378, 23–40.
- Jester et al. (2005) Jester, S., D. P. Schneider, G. T. Richards, R. F. Green, M. Schmidt, P. B. Hall, M. A. Strauss, D. E. Vanden Berk, C. Stoughton, J. E. Gunn, J. Brinkmann, S. M. Kent, J. A. Smith, D. L. Tucker, and B. Yanny, 2005: The Sloan Digital Sky Survey View of the Palomar-Green Bright Quasar Survey. AJ, 130, 873–895.
- Jørgensen et al. (1999) Jørgensen, I., M. Franx, J. Hjorth, and P. G. van Dokkum, 1999: The evolution of cluster E and S0 galaxies measured from the Fundamental Plane. MNRAS, 308, 833–853.
- Kaspi et al. (2000) Kaspi, S., P. S. Smith, H. Netzer, D. Maoz, B. T. Jannuzi, and U. Giveon, 2000: Reverberation Measurements for 17 Quasars and the Size-Mass-Lumino sity Relations in Active Galactic Nuclei. ApJ, 533, 631–649.
- Kim et al. (2008) Kim, M., L. C. Ho, C. Y. Peng, A. J. Barth, M. Im, P. Martini, and C. H. Nelson, 2008: The Origin of the Intrinsic Scatter in the Relation Between Black Hole Mass and Bulge Luminosity for Nearby Active Galaxies. ApJ, 687, 767–827.
- Kormendy et al. (2011) Kormendy, J., R. Bender, and M. E. Cornell, 2011: Supermassive black holes do not correlate with galaxy disks or pseudobulges. Nature, 469, 374–376.
- Kriss (1994) Kriss, G., 1994: Fitting Models to UV and Optical Spectral Data. Astronomical Data Analysis Software and Systems, 3, 437.
- Krist and Hook (2001) Krist, G. and R. Hook, 2001: Tiny Tim User’s Manual, version 6.0. Space Telescope Science Institute.
- Kuntschner et al. (2001) Kuntschner, H., J. R. Lucey, R. J. Smith, M. J. Hudson, and R. L. Davies, 2001: On the dependence of spectroscopic indices of early-type galaxies on age, metallicity and velocity dispersion. MNRAS, 323, 615–629.
- Lauer et al. (2007) Lauer, T. R., S. Tremaine, D. Richstone, and S. M. Faber, 2007: Selection Bias in Observing the Cosmological Evolution of the M- and M-L Relationships. ApJ, 670, 249–260.
- Marble et al. (2003) Marble, A. R., D. C. Hines, G. D. Schmidt, P. S. Smith, J. A. Surace, L. Armus, R. M. Cutri, and B. O. Nelson, 2003: A Hubble Space Telescope WFPC2 Snapshot Survey of 2MASS-selected Red QSOs. ApJ, 590, 707–729.
- Massey et al. (1988) Massey, P., K. Strobel, J. V. Barnes, and E. Anderson, 1988: Spectrophotometric standards. ApJ, 328, 315–333.
- McConnell et al. (2011) McConnell, N. J., C.-P. Ma, K. Gebhardt, S. A. Wright, J. D. Murphy, T. R. Lauer, J. R. Graham, and D. O. Richstone, 2011: Two ten-billion-solar-mass black holes at the centres of giant elliptical galaxies. Nature, 480, 215–218.
- McGill et al. (2008) McGill, K. L., J.-H. Woo, T. Treu, and M. A. Malkan, 2008: Comparing and Calibrating Black Hole Mass Estimators for Distant Active Galactic Nuclei. ApJ, 673, 703–714.
- Nelson (2000) Nelson, C. H., 2000: Black Hole Mass, Velocity Dispersion, and the Radio Source in Active Galactic Nuclei. ApJ, 544, L91–L94.
- Nelson et al. (2004) Nelson, C. H., R. F. Green, G. Bower, K. Gebhardt, and D. Weistrop, 2004: The Relationship Between Black Hole Mass and Velocity Dispersion in Seyfert 1 Galaxies. ApJ, 615, 652–661.
- Netzer and Trakhtenbrot (2007) Netzer, H. and B. Trakhtenbrot, 2007: Cosmic Evolution of Mass Accretion Rate and Metallicity in Active Galactic Nuclei. ApJ, 654, 754–763.
- Nigoche-Netro et al. (2010) Nigoche-Netro, A., J. A. L. Aguerri, P. Lagos, A. Ruelas-Mayorga, L. J. Sánchez, and A. Machado, 2010: The Faber-Jackson relation for early-type galaxies: dependence on the magnitude range. A&A, 516, A96.
- Nolan et al. (2001) Nolan, L. A., J. S. Dunlop, M. J. Kukula, D. H. Hughes, T. Boroson, and R. Jimenez, 2001: The ages of quasar host galaxies. MNRAS, 323, 308–330.
- Onken et al. (2004) Onken, C. A., L. Ferrarese, D. Merritt, B. M. Peterson, R. W. Pogge, M. Vestergaard, and A. Wandel, 2004: Supermassive Black Holes in Active Galactic Nuclei. II. Calibration of the Black Hole Mass-Velocity Dispersion Relationship for Active Galactic Nuclei. ApJ, 615, 645–651.
- Osterbrock and Ferland (2006) Osterbrock, D. E. and G. J. Ferland, 2006: Astrophysics of gaseous nebulae and active galactic nuclei.
- Park et al. (2012) Park, D., J.-H. Woo, T. Treu, A. J. Barth, M. C. Bentz, V. N. Bennert, G. Canalizo, A. V. Filippenko, E. Gates, J. E. Greene, M. A. Malkan, and J. Walsh, 2012: The Lick AGN Monitoring Project: Recalibrating Single-epoch Virial Black Hole Mass Estimates. ApJ, 747, 30.
- Peng et al. (2002) Peng, C. Y., L. C. Ho, C. D. Impey, and H. Rix, 2002: Detailed Structural Decomposition of Galaxy Images. AJ, 124, 266–293.
- Peng et al. (2006a) Peng, C. Y., C. D. Impey, L. C. Ho, E. J. Barton, and H. Rix, 2006a: Probing the Coevolution of Supermassive Black Holes and Quasar Host Galaxies. ApJ, 640, 114–125.
- Peng et al. (2006b) Peng, C. Y., C. D. Impey, H. Rix, E. E. Falco, C. R. Keeton, C. S. Kochanek, J. Lehár, and B. A. McLeod, 2006b: Lensed quasar hosts. New Astronomy Review, 50, 689–693.
- Peng et al. (2006c) Peng, C. Y., C. D. Impey, H. Rix, C. S. Kochanek, C. R. Keeton, E. E. Falco, J. Lehár, and B. A. McLeod, 2006c: Probing the Coevolution of Supermassive Black Holes and Galaxies Using Gravitationally Lensed Quasar Hosts. ApJ, 649, 616–634.
- Portinari et al. (2011) Portinari, L., J. Kotilainen, R. Falomo, and R. Decarli, 2011: On the cosmological evolution of the black hole - host galaxy relation in quasars. ArXiv e-prints.
- Press and Spergel (1988) Press, W. H. and D. N. Spergel, 1988: Choice of order and extrapolation method in Aarseth-type N-body algorithms. ApJ, 325, 715–721.
- Prevot et al. (1984) Prevot, M. L., J. Lequeux, L. Prevot, E. Maurice, and B. Rocca-Volmerange, 1984: The typical interstellar extinction in the Small Magellanic Cloud. A&A, 132, 389–392.
- Robertson et al. (2006a) Robertson, B., T. J. Cox, L. Hernquist, M. Franx, P. F. Hopkins, P. Martini, and V. Springel, 2006a: The Fundamental Scaling Relations of Elliptical Galaxies. ApJ, 641, 21–40.
- Robertson et al. (2006b) Robertson, B., L. Hernquist, T. J. Cox, T. Di Matteo, P. F. Hopkins, P. Martini, and V. Springel, 2006b: The Evolution of the Relation. ApJ, 641, 90–102.
- Rothberg et al. (2012) Rothberg, B., J. Fischer, M. Rodrigues, and D. B. Sanders, 2012: Unveiling the -Discrepancy II: Revisiting the Evolution of ULIRGs into Massive Ellipticals and QSO Host Galaxies. ApJ, submitted.
- Salviander et al. (2007) Salviander, S., G. A. Shields, K. Gebhardt, and E. W. Bonning, 2007: The Black Hole Mass-Galaxy Bulge Relationship for QSOs in the Sloan Digital Sky Survey Data Release 3. ApJ, 662, 131–144.
- Scannapieco et al. (2005) Scannapieco, E., J. Silk, and R. Bouwens, 2005: AGN Feedback Causes Downsizing. ApJ, 635, L13–L16.
- Schlegel et al. (1998) Schlegel, D. J., D. P. Finkbeiner, and M. Davis, 1998: Maps of Dust Infrared Emission for Use in Estimation of Reddening and Cosmic Microwave Background Radiation Foregrounds. ApJ, 500, 525–+.
- Sheinis et al. (2002) Sheinis, A. I., M. Bolte, H. W. Epps, R. I. Kibrick, J. S. Miller, M. V. Radovan, B. C. Bigelow, and B. M. Sutin, 2002: ESI, a New Keck Observatory Echellette Spectrograph and Imager. PASP, 114, 851–865.
- Shen et al. (2008) Shen, J., D. E. Vanden Berk, D. P. Schneider, and P. B. Hall, 2008: The Black Hole-Bulge Relationship in Luminous Broad-Line Active Galactic Nuclei and Host Galaxies. AJ, 135, 928–946.
- Shields et al. (2003) Shields, G. A., K. Gebhardt, S. Salviander, B. J. Wills, B. Xie, M. S. Brotherton, J. Yuan, and M. Dietrich, 2003: The Black Hole-Bulge Relationship in Quasars. ApJ, 583, 124–133.
- Smith et al. (2002) Smith, P. S., G. D. Schmidt, D. C. Hines, R. M. Cutri, and B. O. Nelson, 2002: The Optical Polarization of Near-Infrared-selected Quasi-Stellar Objects. ApJ, 569, 23–35.
- Smith et al. (2003) Smith, P. S., G. D. Schmidt, D. C. Hines, and C. B. Foltz, 2003: Optical Spectropolarimetry of Quasi-stellar Objects Discovered by the Two-Micron All Sky Survey. ApJ, 593, 676–699.
- Spergel et al. (2003) Spergel, D. N., L. Verde, H. V. Peiris, E. Komatsu, M. R. Nolta, C. L. Bennett, M. Halpern, G. Hinshaw, N. Jarosik, A. Kogut, M. Limon, S. S. Meyer, L. Page, G. S. Tucker, J. L. Weiland, E. Wollack, and E. L. Wright, 2003: First-Year Wilkinson Microwave Anisotropy Probe (WMAP) Observations: Determination of Cosmological Parameters. ApJS, 148, 175–194.
- Stickley and Canalizo (2012) Stickley, N. R. and G. Canalizo, 2012: The Evolution of Stellar Velocity Dispersion during Dissipationless Galaxy Mergers. ApJ, 747, 33.
- Tremaine et al. (2002) Tremaine, S., K. Gebhardt, R. Bender, G. Bower, A. Dressler, S. M. Faber, A. V. Filippenko, R. Green, C. Grillmair, L. C. Ho, J. Kormendy, T. R. Lauer, J. Magorrian, J. Pinkney, and D. Richstone, 2002: The Slope of the Black Hole Mass versus Velocity Dispersion Correlation. ApJ, 574, 740–753.
- Treu et al. (2007) Treu, T., J.-H. Woo, M. A. Malkan, and R. D. Blandford, 2007: Cosmic Evolution of Black Holes and Spheroids. II. Scaling Relations at z=0.36. ApJ, 667, 117–130.
- Urrutia et al. (2009) Urrutia, T., R. H. Becker, R. L. White, E. Glikman, M. Lacy, J. Hodge, and M. D. Gregg, 2009: The FIRST-2MASS Red Quasar Survey. II. An Anomalously High Fraction of LoBALs in Searches for Dust-Reddened Quasars. ApJ, 698, 1095–1109.
- van Dokkum and Franx (2001) van Dokkum, P. G. and M. Franx, 2001: Morphological Evolution and the Ages of Early-Type Galaxies in Clusters. ApJ, 553, 90–102.
- Vanden Berk et al. (2001) Vanden Berk, D. E., G. T. Richards, A. Bauer, M. A. Strauss, D. P. Schneider, T. M. Heckman, D. G. York, P. B. Hall, X. Fan, G. R. Knapp, S. F. Anderson, J. Annis, N. A. Bahcall, M. Bernardi, J. W. Briggs, J. Brinkmann, R. Brunner, S. Burles, L. Carey, F. J. Castander, A. J. Connolly, J. H. Crocker, I. Csabai, M. Doi, D. Finkbeiner, S. Friedman, J. A. Frieman, M. Fukugita, J. E. Gunn, G. S. Hennessy, Ž. Ivezić, S. Kent, P. Z. Kunszt, D. Q. Lamb, R. F. Leger, D. C. Long, J. Loveday, R. H. Lupton, A. Meiksin, A. Merelli, J. A. Munn, H. J. Newberg, M. Newcomb, R. C. Nichol, R. Owen, J. R. Pier, A. Pope, C. M. Rockosi, D. J. Schlegel, W. A. Siegmund, S. Smee, Y. Snir, C. Stoughton, C. Stubbs, M. SubbaRao, A. S. Szalay, G. P. Szokoly, C. Tremonti, A. Uomoto, P. Waddell, B. Yanny, and W. Zheng, 2001: Composite Quasar Spectra from the Sloan Digital Sky Survey. AJ, 122, 549–564.
- Vestergaard and Peterson (2006) Vestergaard, M. and B. M. Peterson, 2006: Determining Central Black Hole Masses in Distant Active Galaxies and Quasars. II. Improved Optical and UV Scaling Relationships. ApJ, 641, 689–709.
- White et al. (2003) White, R. L., D. J. Helfand, R. H. Becker, M. D. Gregg, M. Postman, T. R. Lauer, and W. Oegerle, 2003: An I-Band-selected Sample of Radio-emitting Quasars: Evidence for a Large Population of Red Quasars. AJ, 126, 706–722.
- Wold et al. (2010) Wold, I., A. I. Sheinis, M. J. Wolf, and E. J. Hooper, 2010: Host galaxies of luminous quasars: population synthesis of optical off-axis spectra. MNRAS, 408, 713–730.
- Wold et al. (2007) Wold, M., M. Lacy, and L. Armus, 2007: The influence of AGN nuclear parameters on the FRI/FRII dichotomy. A&A, 470, 531–538.
- Wolf and Sheinis (2008) Wolf, M. J. and A. I. Sheinis, 2008: Host Galaxies of Luminous Quasars: Structural Properties and the Fundamental Plane. AJ, 136, 1587–1606.
- Woo et al. (2010) Woo, J., T. Treu, A. J. Barth, S. A. Wright, J. L. Walsh, M. C. Bentz, P. Martini, V. N. Bennert, G. Canalizo, A. V. Filippenko, E. Gates, J. Greene, W. Li, M. A. Malkan, D. Stern, and T. Minezaki, 2010: The Lick AGN Monitoring Project: The Relation for Reverberation-mapped Active Galaxies. ApJ, 716, 269–280.
- Woo et al. (2006) Woo, J., T. Treu, M. A. Malkan, and R. D. Blandford, 2006: Cosmic Evolution of Black Holes and Spheroids. I. The Relation at . ApJ, 645, 900–919.
- Woo et al. (2008) —, 2008: Cosmic Evolution of Black Holes and Spheroids. III. The Relation in the Last Six Billion Years. ApJ, 681, 925–930.
- Woo and Urry (2002) Woo, J.-H. and C. M. Urry, 2002: Active Galactic Nucleus Black Hole Masses and Bolometric Luminosities. ApJ, 579, 530–544.