Present address: ]National Superconducting Cyclotron Laboratory, Michigan State University, East Lansing, Michigan 48824, USA Present address: ]National Superconducting Cyclotron Laboratory, Michigan State University, East Lansing, Michigan 48824, USA
Nuclear Level Density and Gamma-Ray Strength Function of 43Sc
Abstract
The nuclear level density and the -ray strength function have been determined for 43Sc in the energy range up to below the neutron separation energy using the Oslo method with the 46Ti43Sc reaction. A comparison to 45Sc shows that the level density of 43Sc is smaller by an approximately constant factor of two. This behaviour is well reproduced in a microscopical/combinatorial model calculation. The -ray strength function is showing an increase at low -ray energies, a feature which has been observed in several nuclei but which still awaits theoretical explanation.
pacs:
21.10.Ma, 21.10.Pc, 27.40.+zI Introduction
Network calculations aiming to reproduce isotopic abundances observed in stars, or predictions of isotope productions in nuclear power plants require good knowledge of nuclear level densities and -ray transition rates for many nuclei and over a large range of excitation energies to calculate the relevant cross sections. Up to a certain excitation energy, it is feasible to perform spectroscopic measurements on all individual nuclear excited states and to determine at least some of their properties. But at higher excitation energies, the spacing between nuclear levels may become very small, which does not allow to resolve all individual levels. A continuing effort has since long been devoted both in experiment and theory to the study of level densities and -ray strengths function also in this region of quasi-continuum. Despite these efforts, the amount of available experimental data is relatively small. Therefore, network calculations often have to rely on models to compensate for the lack of measured values, and models are difficult to validate without experimental data to compare with.
The nuclear physics group at the University of Oslo has performed many experiments using the Oslo method to determine nuclear level densities and -ray strength functions of many isotopes throughout the nuclear chart Chankova06 ; Lar07 ; Algin08 ; Agvaanluvsan09 ; Syed09a ; Nyhus10 . In the present work, the Oslo method has been used for the first time on a nucleus produced in a reaction to determine the level density and the -ray strength function of 43Sc. Previously published data for 45Sc Lar07 , produced in the (3He,3He′) reaction, allow the comparison of two relatively light isotopes with .
II Experiment and Data Analysis
The experiment was performed at the cyclotron laboratory of the University of Oslo. A proton beam with an energy of impinged on a Ti target of thickness with an enrichment of 46Ti. The main impurities were 48Ti (), 47Ti (), 50Ti (), and 49Ti (). Eight silicon particle telescopes with a total geometric efficiency of about were placed in forward direction at distance behind the target at an angle of with respect to the beam axis. The target was surrounded by the -ray detector array CACTUS, consisting of 28 collimated NaI(Tl) scintillator crystals covering about of .
Using the specific energy losses in the thin () and the thick () particle detectors, ejectiles were identified to select the 46Ti43Sc reaction channel. From the known -values, the reaction kinematics and the energy losses in the materials passed by the particles, the initial excitation energies of the 43Sc nuclei could be reconstructed with an accuracy of about FWHM.
The difference in total energy deposit in the Si detectors between 43Sc (produced from the main target component, 46Ti) and 45Sc (produced from the main impurity, 48Ti) in the respective reactions is only about for the ground states. With the present experimental setup, it is not possible to separate the reactions on the two target components and a certain level of background from 45Sc cannot be removed from the spectra for 43Sc.
From the amount of impurities in the target, one would expect that the contribution from these impurities should not exceed . This assumption is supported by data from the same experiment (see Fig. 2 in Ref. Lar2012 ). Here, it is clear that the main impurity is stemming from 46Ti, which is of the order of . In addition, from calculations of differential cross sections at for the 43,45Sc reactions, and from the cross-section data of Ref. AbouZeid1980 , we find no significant difference in neither the absolute value nor the shape of the estimated spectra. Therefore, it seems reasonable to believe that the background from 45Sc in the present data is of the same order as the amount of 48Ti in the target.
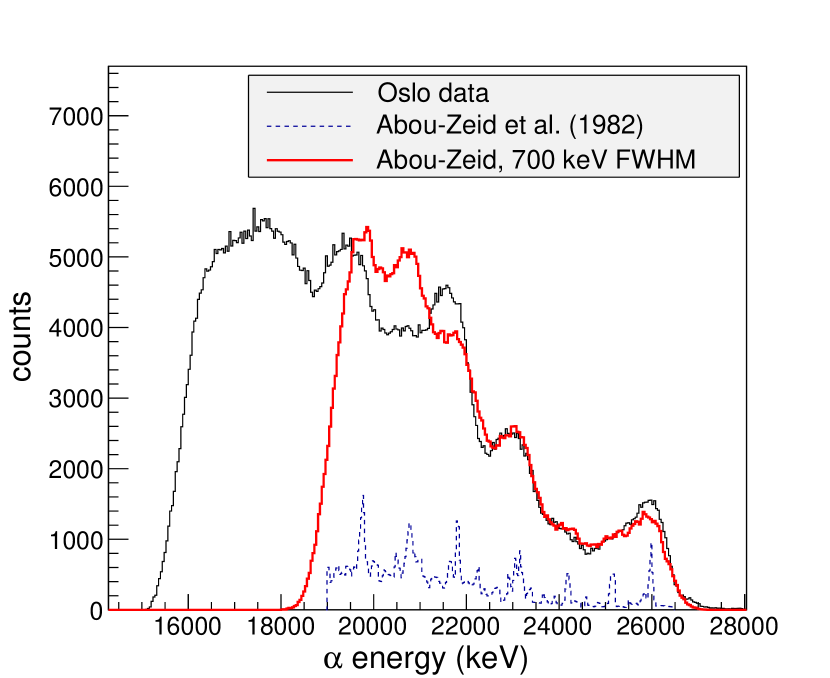
A comparison with the 43Sc -particle spectrum from Ref. AbouZeid1980 , folded with the present detector resolution, shows very good agreement for energies above MeV, see Fig. 1. This further indicates that the contribution from 45Sc is rather small.
We observe deviations between our data and the Abou-Zeid data for MeV. In particular, this is so for the peaks centered at MeV and MeV in our data, and the peak at MeV in the Abou-Zeid data. The former ones are coming by the 16O()13N reaction, as the Ti target had a layer of TiO2 on the surface. However, there is no obvious reason for the difference of the latter peak. Possibly, the different beam energy and scattering angle (our data cover angles between ) could account for the observed deviation.
As a consequence of the 45Sc contribution, some smoothing effects on the extracted quantities are expected.
The excited 43Sc nuclei will emit cascades of rays to decay to their ground states. The spectra of these -ray energies were measured in coincidence with the particles, and a matrix vs. was constructed after correcting for the NaI response function as described in Sch00 . This matrix of unfolded -ray spectra was normalized such that for each initial excitation energy , the integral over all -ray energies measured in coincidence with this excitation energy equaled the average -ray multiplicity observed in this excitation energy bin. The average multiplicity was determined as with the average -ray energy for the excitation energy bin Rekstad1983 . The first-generation method Gut87 was then applied on this matrix to extract a matrix containing the spectrum of primary -ray energies for each initial excitation energy bin . A fundamental assumption for the first-generation method is that the -ray spectrum emitted from each excitation energy bin is independent of how the states in this bin were populated – by decay from higher excited states or by population in the reaction.
From the matrix , both the shape of the level density and the shape of the -ray strength function can be extracted as described in Sch00 . As explained there, this extraction can only be performed if the -ray strength function only depends on the -ray energy, but not on the excitation energy (the generalized Brink-Axel hypothesis Brink1955 ; Axel1962 ), and the transition probability from an initial state to a final state (with excitation energies and , respectively) can be factorized into the level density at the final state, , and the transmission coefficient, . Furthermore it is assumed in the following that dipole radiation is predominant and that one can write . The results obtained at this point are only the functional forms of and in the sense that the matrix can be equally fitted to other pairs of and obtained by the transformations: {linenomath}
| (1) | ||||
| (2) |
for any positive values of , , and any value of Sch00 .
To determine appropriate values for these coefficients, the level density and the -ray strength function must be normalized using data from other sources. The parameters and were determined using two level density values: One of them is the counted level density from discrete-line spectroscopy at low excitation energy, where it has been assumed that all levels have been observed (green region in Fig. 2). The second one is the level density derived from resonance spacings at average energy , slightly above a particle separation energy. This value is extrapolated to lower excitation energies using a scaled back-shifted Fermi gas (BSFG) model EgiBuc05 to bridge the gap between the maximum energy for which can be determined in the experiment and (red line and region in Fig. 2). While no neutron resonance data are available for 43Sc, some information on proton resonances is tabulated in Sukh0x . To perform the normalization, it has been assumed that the tentative spin assignments in Sukh0x are correct, and that the distribution of unknown spin-parity values equals the distribution of known spin-parity values. The normalization point for the level density has then been obtained by counting the levels in the excitation energy region around . The BSFG parameters for the extrapolation are the same as used for 45Sc in Lar07 : the level density parameter was , the back-shift parameter . In addition, the curve was scaled with a factor to match the level density normalization point for 43Sc as obtained from the proton resonance data. This particular BSFG parametrization was chosen to allow a comparison with the data for 45Sc from Ref. Lar07 .
A third normalization point is necessary to fix the parameter for the -ray strength function scale. If available, data on the average total radiative width could be used for this purpose Voi01 ; Gut05 . Such data are, however, not available for 43Sc. Therefore, estimated -ray strength function values for 46Sc have been used in exactly the same way as for 45Sc in Lar07 : the normalization value is the sum of the and strength function values for 46Sc from Ref. KopeckyUhl1995 . The use of the 46Sc value is justified if it is assumed that the -ray strength functions for 43Sc and 46Sc (and 45Sc) are not very different in scale.
III Nuclear Level Density
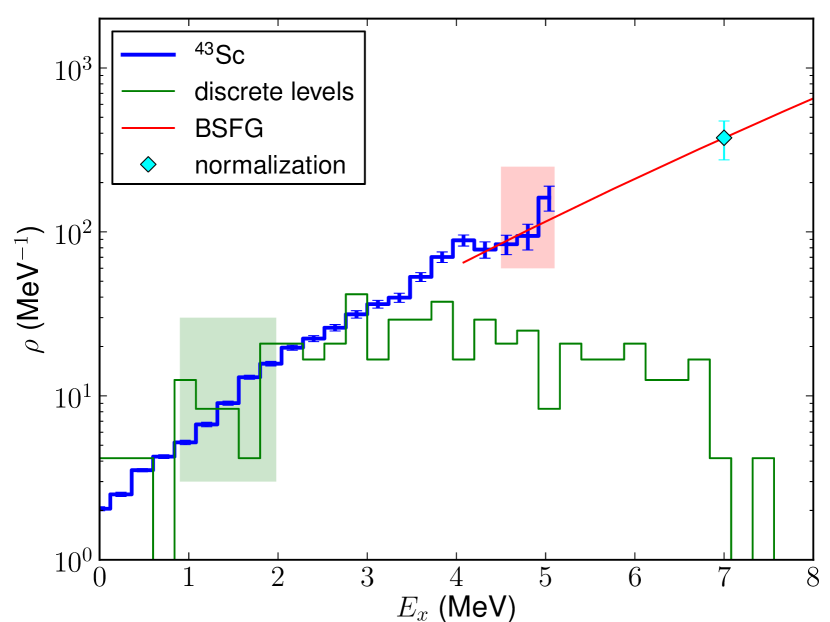
Figure 2 shows the level density curve obtained for 43Sc after the normalization as described in the previous section. The level density normalization point at is with an estimated uncertainty of . The uncertainties for the experimental data points in this figure are estimated mainly based on the number of counts in the vs. matrices (see Sch00 ). They do, in particular, not include the uncertainty from the normalization.
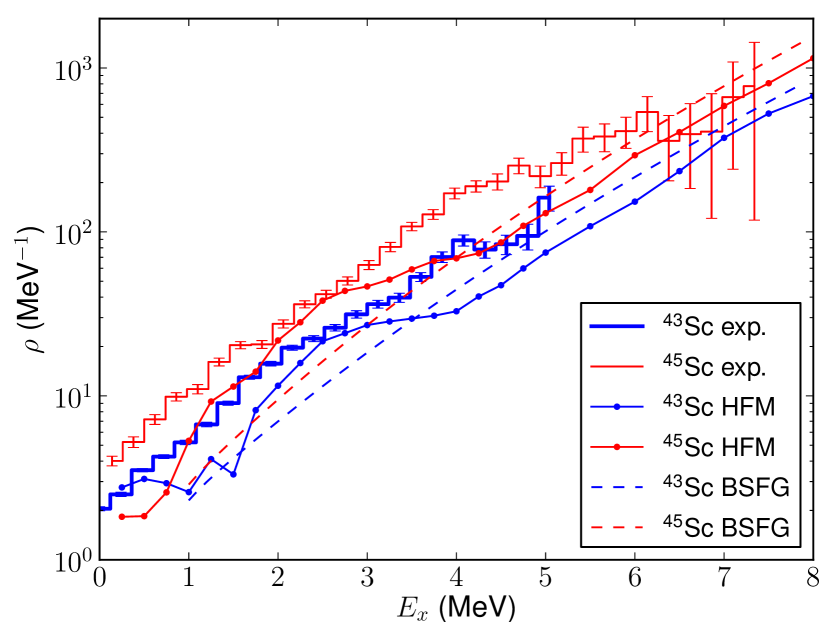
In Fig. 3, the experimental level density is compared to the previously published level density curve for 45Sc Lar07 . It appears that, in logarithmic scale, the two level density curves are more or less parallel to each other: the level density for 45Sc is larger by a factor of about 2 for a large excitation energy range. A similar behavior has been found in heavier nuclei: near closed shells, the level density of nuclei of the same element with masses and differs significantly Siem2009 ; Chankova06 ; Syed09a . For mid-shell nuclei, on the other hand, the level density of neighbors of the same element is very similar or almost identical in scale Agvaanluvsan04 ; Guttormsen03 .
It is not obvious where this increase by a factor 2 between and originates from. In case of spherical nuclei with pronounced and shell gaps, only a few active particles in the orbitals would be responsible for the number of levels, namely 1 and 2 for 43Sc, and 1 and 4 for 45Sc. In this picture, one could expect many more configurations at one and the same excitation energy for 45Sc compared to 43Sc. However, both isotopes have an state just above the ground state, indicating that the hole orbital is close to the , which can be explained by a quadrupole deformation of as shown in the Nilsson single particle scheme of Ref. Lar07 . These calculations show a rather uniform distribution of Nilsson orbitals, and one could expect very similar level densities for 45Sc and 43Sc. On the other hand, it is well established that 45Sc exhibits coexistence of prolate and weakly oblate (nearly spherical) rotational bands Bednarczyk1997 . Since the level density includes all types of configurations with various spins and parities, one has to expect contributions from both shapes, where the near-spherical shape might drive towards a large level density ratio and the deformed shape towards a small level density ratio between 43Sc and 45Sc. The situation is complex and it is difficult to present simple arguments to explain the experimentally observed level density ratio of .
Figure 3 includes calculations of level densities for 43Sc and 45Sc using the phenomenological BSFG model. For these curves, the global parametrization from ko08 was used (which is different from the parameters used for the normalization in Sec. II and Fig. 2). This parametrization includes shell effects via nuclear masses, which enter the calculation of the level density parameter . The resulting ratio of level densities is at , slightly smaller than the ratio of seen in experiment. Generally, the two BSFG calculations tend to underestimate the level density below .
Figure 3 also includes theoretical level density curves derived from calculations using the combinatorial HFM model described in Ref. gorhil08 . These theoretical level densities were retrieved from Ref. RIPL3 . As explained in Ref. gorhil08 , a meaningful comparison of the theoretical predictions with the experimental data requires a normalization of to the level density value used to normalize the experimental level densities at a given energy . Following the normalization recipe of Ref. ko08 , we thus determine for both of 43Sc and 45Sc a normalization parameter such that {linenomath}
| (3) |
and then plot in Fig. 3 the normalized values, i.e. {linenomath}
| (4) |
as a function of .
| Nucleus | ||||
|---|---|---|---|---|
| (MeV) | (MeV-1) | (MeV-1) | ||
| 43Sc | ||||
| 45Sc |
In Fig. 3, we chose zero pairing shift and obtained values for from eq. (3) as listed in Table 1. The normalized HFM curves nearly reproduce the parallel trend of the level density curves and the ratio between them with a significant increase of the 45Sc level densities with respect to that of 43Sc, but they underestimate the level densities for both nuclei. The main qualitative differences between the HFM calculation and experimental data are at excitation energies below , where the calculation does neither reproduce the level densities as obtained from discrete level counting nor their ratio, and in the excitation energy range between around and where the model predicts a local increase in the level density for both nuclei which is not seen in experiment.
At excitation energies below , the HFM curves show more structure than the experimental curves. One possible explanation is the experimental energy resolution. Another possibility to explain this mismatch is the too approximate treatment of the coupling between particle-hole and vibrational excitations implemented in the combinatorial HFM model. To check this hypothesis, we tested a simplistic model to mimic a more realistic particle-vibration coupling resulting in a spreading of the coupled states by an arbitrarily chosen energy of the order of a few hundred keV. The HFM curves obtained using such a simplistic treatment show, as expected, less structure and better agreement with the shape of the experimental data. The tested modifications are, however, completely arbitrary and have to be investigated and refined in future work before including them in the general HFM calculations.
IV Gamma-Ray Strength Function
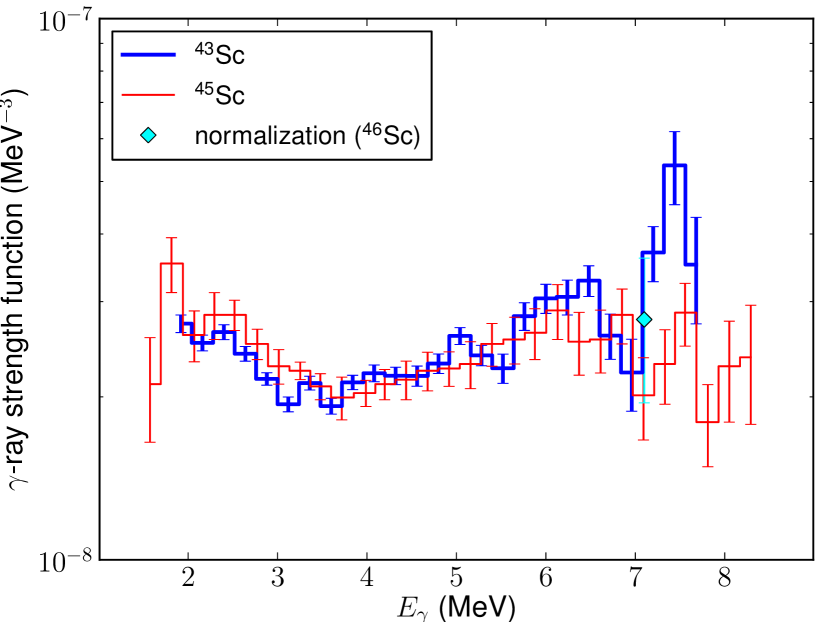
Figure 4 shows the experimental curves of the -ray strength function for 43Sc, together with the experimental data for 45Sc Lar07 . As for the level density, the uncertainties for the experimental data points are estimated mainly based on the number of counts in the vs. matrices. The similarity of the shapes of the measured -ray strength functions of the neighbors is astonishing. A common feature of the curves is that they both show a minimum at around and an increase of the -ray strength function for lower -ray energies. Similar behavior has been observed in other nuclei and using different experimental approaches Syed09b ; Voinov2004 ; Gut05 ; Voinov2010 .
A possible explanation for the case of light nuclei is the typically low level density at low excitation energy, in particular the scarcity of higher-spin states, and the dominance of radiation. For a higher-spin state – which can be populated in the particle-induced reaction –, the de-excitation then needs multiple, smaller-energy steps to reach one of the available low-spin states at low excitation energy Larsen2011 .
Phenomenological models describing such -ray strength functions shows that the increased -ray strength for low may have important effects on radiative neutron capture cross sections and thus on r-process nucleosynthesis calculations LarsenGoriely2010 .
V Summary
The nuclear level density and the -ray strength function of 43Sc have been determined experimentally using the Oslo method. There is an almost constant factor between the level densities of 43Sc and 45Sc, a behavior similar to what has been observed in heavier nuclei in the vicinity of shell closures. The parallel evolution of the level densities of the two isotope neighbors can be nearly reproduced within a combinatorial model for a large excitation energy range. The -ray strength function for 43Sc is surprisingly similar to the one of 45Sc, and it shows an increase at low -ray energy which cannot be explained theoretically as of yet.
Acknowledgments
The authors wish to thank E. A. Olsen and J. Wikne for excellent experimental conditions. Financial support from the Research Council of Norway (Norges forskningsråd, project 180663) is gratefully acknowledged.
References
- (1) R. Chankova et al., Phys. Rev. C 73, 034311 (2006), see also M. Guttormsen et al., arXiv:nucl-ex/0801.4667.
- (2) A. C. Larsen et al., Phys. Rev. C 76, 044303 (2007).
- (3) E. Algin et al., Phys. Rev. C 78, 054321 (2008).
- (4) U. Agvaanluvsan et al., Phys. Rev. C 79, 014320 (2009).
- (5) N. U. H. Syed et al., Phys. Rev. C 79, 024316 (2009).
- (6) H. T. Nyhus et al., Phys. Rev. C 81, 024325 (2010).
- (7) A. C. Larsen et al., Phys. Rev. C 85, 014320 (2012).
- (8) O. A. Abou-Zeid et al., Nucl. Phys. A 382, 185 (1982).
- (9) A. Schiller et al., Nucl. Instr. Meth. A 447, 498 (2000).
- (10) J. Rekstad et al., Phys. Scr. T 5, 45 (1983).
- (11) M. Guttormsen, T. Ramsøy, and J. Rekstad, Nucl. Instr. Meth. A 255, 518 (1987).
- (12) D. M. Brink, Ph.D. thesis, Oxford University, 1955.
- (13) P. Axel, Phys. Rev. 126, 671 (1962).
- (14) T. von Egidy and D. Bucurescu, Phys. Rev. C 72, 044311 (2005), see also Phys. Rev. C 73, 049901(E) (2006).
- (15) S. I. Sukhoruchkin and Z. N. Soroko, Tables of Proton and -Particle Resonance Parameters, Part 2: (Springer, Berlin, Heidelberg, 2005), Vol. I/19A2.
- (16) A. Voinov et al., Phys. Rev. C 63, 044313 (2001).
- (17) M. Guttormsen et al., Phys. Rev. C 71, 044307 (2005).
- (18) J. Kopecký and M. Uhl, in Proceedings of a specialists’ meeting on measurement, calculation and evaluation of photon production data, NEA and ENEA, edited by C. Coceva, A. Mengoni, and A. Ventura (NEA, France, 1994).
- (19) S. Siem et al., AIP Conf. Proc. 1090, 66 (2009).
- (20) U. Agvaanluvsan et al., Phys. Rev. C 70, 054611 (2004).
- (21) M. Guttormsen et al., Phys. Rev. C 68, 064306 (2003).
- (22) P. Bednarczyk et al., Phys. Lett. B 393, 285 (1997).
- (23) A. J. Koning, S. Hilaire, and S. Goriely, Nucl. Phys. A 810, 13 (2008).
- (24) S. Goriely, S. Hilaire, and A. J. Koning, Phys. Rev. C 78, 064307 (2008).
- (25) R. Capote et al., Nuclear Data Sheets 110, 3107 (2009).
- (26) N. U. H. Syed et al., Phys. Rev. C 80, 044309 (2009).
- (27) A. Voinov et al., Phys. Rev. Lett. 93, 142504 (2004).
- (28) A. Voinov et al., Phys. Rev. C 81, 024319 (2010).
- (29) A. C. Larsen et al., Phys. Rev. C 83, 034315 (2011).
- (30) A. C. Larsen and S. Goriely, Phys. Rev. C 82, 014318 (2010).