Three-dimensional structure of Mach cones in monolayer complex plasma crystals
Abstract
Structure of Mach cones in a crystalline complex plasma has been studied experimentally using an intensity sensitive imaging, which resolved particle motion in three dimensions. This revealed a previously unknown out-of-plane cone structure, which appeared due to excitation of the vertical wave mode. The complex plasma consisted of micron sized particles forming a monolayer in a plasma sheath of a gas discharge. Fast particles, spontaneously moving under the monolayer, created Mach cones with multiple structures. The in-plane cone structure was due to compressional and shear lattice waves.
pacs:
52.27.Lw, 52.27.Gr, 52.35.Fp, 82.70.DdComplex (or dusty) plasmas are weakly ionised gases containing dust. Due to absorption of ambient electrons and ions of the plasma, dust particles acquire significant negative electric charges Bouchoule (1999); Morfill and Ivlev (2009); Vladimirov et al. (2005); Arnas et al. (2001); Shukla and Mamun (2002). They interact strongly with the plasma and with each other and they can form strongly coupled systems analogous to colloids. Dust particles are often confined in the sheath region of electrical discharges, where the electrostatic force is strong enough to compensate their weight. The sheath region confines the particles strongly in the vertical direction and they can form monolayer crystals Hebner et al. (2002); Samsonov et al. (2005). These systems extend in the ’third’ vertical direction to their finite width which depends on the strength of vertical confinement Samsonov et al. (2005). A vertical “out-of-plane” particle motion is allowed making the dust system geometry three-dimensional. However, the magnitude of the vertical displacement is very small compared to the interparticle distance (tens of micrometers compared to hundred of micrometers). For this reason, monolayer complex plasma crystals are often referred as two-dimensional or quasi-two-dimensional (quasi-2D) complex plasma crystals Couëdel et al. (2009). A monolayer plasma crystal has not to be confused with a dust multilayer system Pieper et al. (1996).
If a body moves in a wave sustaining medium, it creates a disturbance, also known as a wake. V-shaped wakes, also known as Mach cones, are created behind a body moving supersonically. These cones are observed behind boats, supersonic jets, in fluid filled boreholes, and in complex plasmas. The structure of Mach cones is determined by the wave modes that exist in the medium, with each mode having a distinct contribution. Quasi-2D lattices sustain two in-plane wave modes with acoustic dispersion. One of them is compressional (longitudinal), the other is shear (transverse) Wang et al. (2001). Compressional cones have been observed in a quasi-2D complex plasma using spontaneously accelerated particles Samsonov et al. (1999, 2000); Dubin (2000). They often have a multiple structure with a compressional cone followed by a rarefactional and then possibly by another compressional Schwabe, M. et al. (2011). The cone angle is determined by the Mach cone rule , where the speed of the supersonic particle and is the speed of the wave that comprises the cone. If the waves are dispersive (e.g. water waves) or change their speed as they propagate in an inhomogeneous medium, the Mach cone angle will also change Zhdanov et al. (2004). Wakes produced by shear waves have been observed experimentally using laser excitation Melzer et al. (2000); Nosenko et al. (2002). Since the shear mode is about 4-5 times slower than the compressional one, the shear cone fits within the compressional cones, so that both structures can be observed simultaneously. Shear cones have been generated by supersonic dislocations in stressed complex plasma crystals Nosenko et al. (2007).
Since the strength of the vertical confinement in quasi-2D complex plasma systems is finite, there is a third fundamental wave mode: vertical transverse wave (VTW). It is associated with propagating out-of-plane or vertical oscillations Couëdel et al. (2010, 2009); Qiao and Hyde (2003) and it has an optical dispersion. It is then natural to ask whether a vertical Mach cone can be produced by VTW. Optical wave packets propagate with the group velocity, which is, in case of VTW, usually slightly lower than the shear wave speed Samsonov et al. (2005). Thus it should be possible to observe compressional, shear and vertical cone structures at the same time. Here we report a study of the 3D structure of Mach cones using an intensity sensitive imaging technique Samsonov et al. (2005); Couëdel et al. (2009), which measures vertical displacements of particles in a monolayer lattice. This method has allowed us to resolve compressional, shear, and vertical cone structures.
The experiments were performed in two very similar capacitively coupled radio frequency (RF) glow discharge chambers at 13.56 MHz, one Couëdel et al. (2009) at Max Planck Institute for Extraterrestrial Physics in Garching (experiment I) and the other Durniak and Samsonov (2011) at the department of Electrical Engineering and Electronics at the University of Liverpool (experiment II). The experimental parameters are listed in Table 1. The chambers were initially pumped down using turbo-molecular pumps. The working gas pressure was maintained by a small argon flow set to minimise the disturbance to the lattice. The RF power was applied between the lower electrode (200 mm in diameter) and the grounded chamber. Due to electrode asymmetry, the powered electrode acquired a negative self-bias voltage. Typical plasma parameters have been measured with a Langmuir probe in the bulk discharge at a pressure of 0.66 Pa and discharge power of 20 W Nosenko et al. (2009) yielding the electron temperature eV and the electron density cm-3. A monolayer particle suspension (50–60 mm in diameter) was formed by injecting melamine formaldehyde microspheres (9.190.14 m in diameter, with a mass of 6.110-13 kg) into the plasma sheath above the lower electrode.
| Parameter | Symbol | Unit | Experiment I | Experiment II | Simulation |
| argon pressure | (Pa) | 0.66 | 1.45 | – | |
| RF power | (W) | 15 | 3 | – | |
| camera frame rate | (fps) | 250 | 125 | – | |
| average interparticle distance | (m) | 556 | 576 | 425 | |
| longitudinal dust-lattice wave speed | (mm/s) | 31.7 | 23.4 | 38.1 | |
| screening parameter | 1.23 | 1.40 | 0.94 | ||
| Debye length | (m) | 452 | 410 | 452 | |
| particle charge in electron charges | () | 18000 | 14800 | 18000 | |
| vertical resonance frequency | (Hz) | 26.0 | 16.5 | 23.9 | |
| speed of perturbing particle | (mm/s) | 40.2 | 19.2 | 40.0 | |
| longitudinal Mach number | 1.2 | 0.8 | 1.05 | ||
| longitudinal Mach angle | (deg.) | 56 | – | 72.5 | |
| measured horizontal damping | (s-1) | 0.83 0.21 | 1.57 0.63 | – | |
| theoretical damping (Epstein) | (s-1) | 0.79 | 1.73 | 1.0 |
The microparticles were illuminated by a thin horizontal laser sheet, which had a Gaussian profile in the vertical direction and a uniform profile in the horizontal direction. The sheet thickness was nearly constant across the crystal. The particles were imaged through the top window by a Photron FASTCAM high speed camera. The horizontal coordinates and as well as the velocity components and of individual particles were then measured with sub-pixel resolution using standard particle tracking techniques Rogers et al. (2007); Feng et al. (2011); Ivanov and Melzer (2007). An additional side-view camera was used to verify that our experiments were carried out with a single main layer of particles. In order to determine the relative vertical positions and velocities of individual particles, the laser sheet was set slightly above the particle layer, so that the position of the intensity maximum was m to m higher than the average levitation height of the grains. The intensity of light scattered by the particles depended on their vertical displacement from the average height. The vertical velocity was calculated from the change of particle intensity in two consecutive frames Samsonov et al. (2005); Couëdel et al. (2009).
The complex plasma lattices used in our experiments have been characterised by measuring their main parameters, which are shown in Table 1. The charge and the screening parameter in both experiments were determined from the long wavelength phonon spectra of the thermally excited lattice oscillations. The spectra have been analysed yielding the longitudinal and transverse dust-lattice wave speeds with the method of Ref. Nunomura et al. (2002). The particle charge and the screening parameter were then calculated using the formulae of Ref. Piel and Melzer (2002). The interparticle distances were measured directly from the lattice images, and the Debye length was calculated. We have also measured the vertical resonance frequency, which characterises the strength of the vertical confinement.
Mach cones were created using the experimental technique of Refs. Samsonov et al. (1999, 2000). A few heavy particles (which are often found in many experiments) moved under the main lattice layer. They were spontaneously accelerated, most likely by the wake fields of particles in the main layer Schweigert et al. (2002), if the RF power was high enough. Their speeds were nearly constant, limited by the neutral gas friction (Epstein drag), and their trajectories were most often straight lines. They produced Mach cones due to electrostatic interaction with the crystal lattice above.
In order to understand the mechanisms of lattice excitation we reproduced the Mach cones with the molecular dynamics simulation code of Ref. Durniak et al. (2010). It solved the equations of motion of 3000 microparticles (with the same mass as in the experiments) interacting with each other via a Yukawa potential. They were confined in a parabolic potential well, strongly in the vertical and weakly in the horizontal directions, forming a monolayer. Parameters of the simulation are listed in Table 1. The lattice was excited by a 3D repulsive spot force field moving at 40 mm/s along the x-axis. The force field was similar to that of a charged particle.
Both experimentally obtained (Fig. 1a-d) and simulated (Fig. 1e,f) Mach cones have been visualised using the method of Refs. Samsonov et al. (1999, 2000). Several consecutive frames have been aligned at the cone vertex and averaged, producing high resolution velocity maps (Fig. 1). This reduced the thermal noise and enhanced the motion correlated with the Mach cone. The horizontal speed is shown in Figs. 1a,c,e, it visualises compressional Mach cones (Figs. 1a,e). Note that there is no compressional cone in Fig. 1c, since the perturbing particle was subsonic. A double cone is visible in Fig. 1a. The front compressional cone agreed well with the theoretical prediction (dashed line). The second cone with a smaller angle is a rarefactional cone Samsonov et al. (2000).
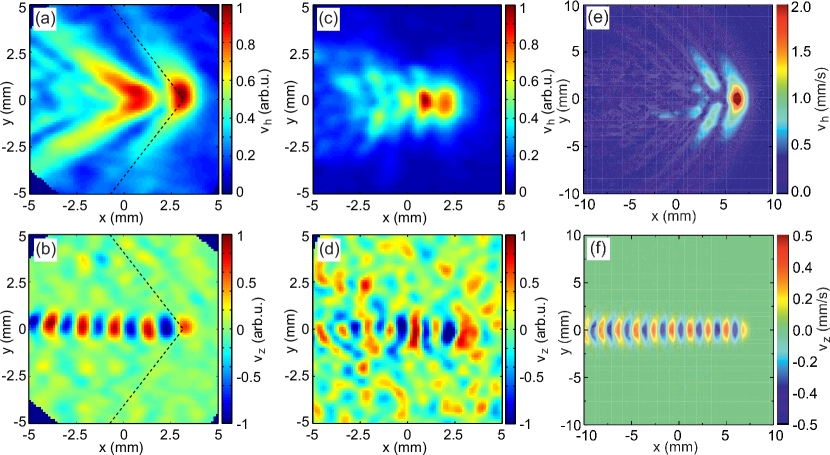
Since the particles in a quasi-2D complex plasma are confined vertically in a finite harmonic potential, they can move in the vertical direction, e.g. out of the lattice plane. A fast charged particle moving under the main lattice layer exerts a 3D force and therefore perturbs the lattice vertically as well as horizontally. While large scale vertical lattice oscillations Piel and Melzer (2002) and waves Samsonov et al. (2005); Couëdel et al. (2009) have been observed before, here a long and narrow stripe of lattice is excited vertically. Figures 1b,d,f show the vertical velocity maps of lattices in the wake of an out-of-plane perturbing particle. It is worth noting (to avoid misunderstanding) that a vertical velocity component mapping on the plane is convenient way to reveal the vertical component of a Mach cone in a monolayer complex plasma. The maximal vertical particle displacements observed remained relatively small and, of course, not enough to reconstruct precisely the vertical structure of a Mach cone (as done in the experiments with 3D complex plasma clouds Schwabe, M. et al. (2011)). Both experiments and the simulation produce the same vertical excitation pattern, with a wavelength close to and a width of the excited stripe of where is the average interparticle distance. This width remained nearly constant at different distances from the cone vertex indicating that the VTW speed is so low, that the vertical wave is damped by the neutral drag before it spreads noticeably. The theory-predicted VTW speed was a small percentage of the compressional dust-lattice wave speed. Interestingly the vertical oscillations persisted further away from the cone vertex, than the compressional or shear waves, indicating that they experienced less damping (Fig. 1b,d,f).
A linear analytical theory has been used to describe the vertical lattice oscillations. Since the strength of vertical confinement of a stable monolayer is normally about 50 times higher than that of horizontal confinement, the amplitude of the vertical oscillations is much smaller than that of the horizontal oscillations, given that the energy is evenly distributed over the oscillation modes Melzer et al. (2001). The amplitude of the vertical motion is also much smaller than the lattice constant. The vertical displacement of the particles in a lattice obeys:
| (1) |
where ( and are integers, are the primitive translation vectors Kittel (1961)), the prime denotes the neighboring particles, is the damping rate, is the vertical confinement parameter, is the dust lattice frequency, is the dispersion operator (with the Fourier spectrum Couëdel et al. (2011); Zhdanov et al. (2009)), and is the excitation force due to a repulsive projectile moving with a velocity . The projectile is a point charge moving at a height below the lattice and interacting with it via a force .
The solution of (Three-dimensional structure of Mach cones in monolayer complex plasma crystals) is a convolution of the exciter Fourier spectrum , and the resonance propagator where the latter depends on :
| (2) | |||
| (3) | |||
| (4) |
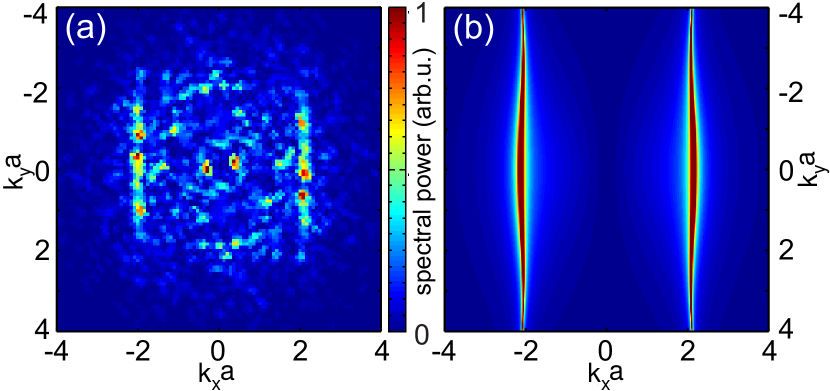
The Fourier-transformed spectral intensity of the vertical oscillations is, , . In our case of low damping, it shows a well-pronounced signature – a narrow stripe transverse to the direction of the projectile propagation in both experiment and theory (Fig.2; in Fig.2(a), scattered bright dots, not well aligned vertically, are most probably the traces of previous excitations with different directions of propagation). The position of the stripe corresponds to the resonance condition , where is the vertical wave phase velocity. Therefore the vertical structure of the Mach cone can be used to determine the resonant wave number. It was found to be in the experiment, which agrees with the theoretical value of . The spatial decrement of the resonant vertical oscillations (2) is . Since the projectile velocity is relatively large, the spatial decrement is low, and the wave pattern persists for a long distance explaining the seemingly lower vertical damping (in experiment I, 60 mm).
In conclusion, we have reported the first direct observation of the vertical velocity component of a Mach cone in a quasi-2D complex plasma crystal excited by a particle moving underneath the main layer. The vertical structure or z-Mach cone was present in both cases of a super- or sub-sonic projectile. It is explained by excitation of the vertical transverse wave in the wake of the projectile. z-Mach cones can be used to determine the resonance wavelength of the vertical transverse wave.
Acknowledgements.
The authors would like to thank D. Escande for useful comments and suggestions. We appreciate funding from the European Research Council (Grant agreement 267499), and from the Engineering and Physical Sciences Reseach Council of the United Kingdom (Grant EP/G007918).References
- Bouchoule (1999) A. Bouchoule, Dusty Plasmas: Physics, Chemistry and Technological impacts in Plasma Processing, edited by A. Bouchoule (Wiley, New York, 1999).
- Morfill and Ivlev (2009) G. E. Morfill and A. V. Ivlev, Rev. Mod. Phys., 81, 1353 (2009).
- Vladimirov et al. (2005) S. Vladimirov, K. Ostrikov, and A. Samarian, Physics and Applications of Complex Plasmas, edited by L. Imperial Press (Imperial Press, London, 2005).
- Arnas et al. (2001) C. Arnas, M. Mikikian, and F. Doveil, Physica Scripta, T89, 163 (2001).
- Shukla and Mamun (2002) P. K. Shukla and A. A. Mamun, Introduction to dusty plasma (IOP Publishing, Bristol, 2002).
- Hebner et al. (2002) G. A. Hebner, M. E. Riley, and K. E. Greenberg, Phys. Rev. E, 66, 046407 (2002).
- Samsonov et al. (2005) D. Samsonov, S. Zhdanov, and G. Morfill, Physical Review E (Statistical, Nonlinear, and Soft Matter Physics), 71, 026410 (2005).
- Couëdel et al. (2009) L. Couëdel, V. Nosenko, S. K. Zhdanov, A. V. Ivlev, H. M. Thomas, and G. E. Morfill, Physical Review Letters, 103, 215001 (2009).
- Pieper et al. (1996) J.B. Pieper, and J. Goree, Phys. Rev. Lett., 77, 3137 (1996).
- Wang et al. (2001) X. Wang, A. Bhattacharjee, and S. Hu, Phys. Rev. Lett., 86, 2569 (2001).
- Samsonov et al. (1999) D. Samsonov, J. Goree, Z. W. Ma, A. Bhattacharjee, H. M. Thomas, and G. E. Morfill, Phys. Rev. Lett., 83, 3649 (1999).
- Samsonov et al. (2000) D. Samsonov, J. Goree, H. M. Thomas, and G. E. Morfill, Phys. Rev. E, 61, 5557 (2000).
- Dubin (2000) D. H. E. Dubin, Phys. Plasmas, 7, 3895 (2000), ISSN 1070664X.
- Schwabe, M. et al. (2011) Schwabe, M., Jiang, K., Zhdanov, S., Hagl, T., Huber, P., Ivlev, A. V., Lipaev, A. M., Molotkov, V. I., Naumkin, V. N., Sütterlin, K. R., Thomas, H. M., Fortov, V. E., Morfill, G. E., Skvortsov, A., and Volkov, S., EPL, 96, 55001 (2011).
- Zhdanov et al. (2004) S. K. Zhdanov, G. E. Morfill, D. Samsonov, M. Zuzic, and O. Havnes, Phys. Rev. E, 69, 026407 (2004).
- Melzer et al. (2000) A. Melzer, S. Nunomura, D. Samsonov, Z. W. Ma, and J. Goree, Phys. Rev. E, 62, 4162 (2000).
- Nosenko et al. (2002) V. Nosenko, J. Goree, Z. W. Ma, and A. Piel, Phys. Rev. Lett., 88, 135001 (2002).
- Nosenko et al. (2007) V. Nosenko, S. Zhdanov, and G. Morfill, Phys. Rev. Lett., 99, 025002 (2007).
- Couëdel et al. (2010) L. Couëdel, V. Nosenko, A. V. Ivlev, S. K. Zhdanov, H. M. Thomas, and G. E. Morfill, Phys. Rev. Lett., 104, 195001 (2010).
- Qiao and Hyde (2003) K. Qiao and T. W. Hyde, Phys. Rev. E, 68, 046403 (2003).
- Durniak and Samsonov (2011) C. Durniak and D. Samsonov, Phys. Rev. Lett., 106, 175001 (2011).
- Nosenko et al. (2009) V. Nosenko, A. V. Ivlev, S. K. Zhdanov, M. Fink, and G. E. Morfill, Physics of Plasmas, 16, 083708 (2009).
- Rogers et al. (2007) S. S. Rogers, T. A. Waigh, X. Zhao, and J. R. Lu, Physical Biology, 4, 220 (2007).
- Feng et al. (2011) Y. Feng, J. Goree, and B. Liu, Review of Scientific Instruments, 82, 053707 (2011).
- Ivanov and Melzer (2007) Y. Ivanov and A. Melzer, Review of Scientific Instruments, 78, 033506 (2007).
- Nunomura et al. (2002) S. Nunomura, J. Goree, S. Hu, X. Wang, A. Bhattacharjee, and K. Avinash, Phys. Rev. Lett., 89, 035001 (2002).
- Piel and Melzer (2002) A. Piel and A. Melzer, Plasma Physics and Controlled Fusion, 44, R1 (2002).
- Schweigert et al. (2002) V. A. Schweigert, I. V. Schweigert, V. Nosenko, and J. Goree, Phys. Plasmas, 9, 4465 (2002), ISSN 1070664X.
- Durniak et al. (2010) C. Durniak, D. Samsonov, N. Oxtoby, J. Ralph, and S. Zhdanov, IEEE T. Plasma Sci., 38, 2412 (2010).
- Melzer et al. (2001) A. Melzer, M. Klindworth, and A. Piel, Phys. Rev. Lett., 87, 115002 (2001).
- Kittel (1961) C. Kittel, Introduction to Solid State Physics, edited by Wiley (Wiley, New York, 1961).
- Couëdel et al. (2011) L. Couëdel, S. K. Zhdanov, A. V. Ivlev, V. Nosenko, H. M. Thomas, and G. E. Morfill, Phys. Plasmas, 18, 083707 (2011), ISSN 1070664X.
- Zhdanov et al. (2009) S. K. Zhdanov, A. V. Ivlev, and G. E. Morfill, Phys. Plasmas, 16, 083706 (2009).