Structured Molecular Gas Reveals Galactic Spiral Arms
Abstract
We explore the development of structures in molecular gas in the Milky Way by applying the analysis of the brightness distribution function (BDF) and the brightness distribution index (BDI) in the archival data from the Boston University–Five College Radio Astronomy Observatory Galactic Ring Survey. The BDI measures the fractional contribution of spatially confined bright molecular emission over faint emission extended over large areas. This relative quantity is largely independent of the amount of molecular gas and of any conventional, pre-conceived structures, such as cores, clumps, or giant molecular clouds. The structured molecular gas traced by higher BDI is located continuously along the spiral arms in the Milky Way in the longitude–velocity diagram. This clearly indicates that molecular gas changes its structure as it flows through the spiral arms. Although the high-BDI gas generally coincides with H II regions, there is also some high-BDI gas with no/little signature of ongoing star formation. These results support a possible evolutionary sequence in which unstructured, diffuse gas transforms itself into a structured state on encountering the spiral arms, followed by star formation and an eventual return to the unstructured state after the spiral arm passage.
Subject headings:
Galaxy: disk — ISM: molecules — radio lines: ISM1. Introduction
A stellar spiral potential causes a large amount of gas to accumulate along the spiral arms (e.g., Wada & Koda, 2004; Dobbs et al., 2006; Shetty & Ostriker, 2006; Wada, 2008). The concentration and compression of the molecular gas in spiral shocks leads to active star formation (e.g., Roberts, 1969; Rand, 1993; Knapen et al., 1996), and indeed, most H II regions are found along the narrow dust lanes and molecular spiral arms in external spiral galaxies (Rand et al., 1999; Scoville et al., 2001; Egusa et al., 2011). The physical conditions of the molecular gas also appear to change upon the entry into a spiral arm. Analyses of the CO line ratios suggest that the molecular gas becomes denser and/or warmer in spiral arms (Sakamoto et al., 1997; Sempere & García-Burillo, 1997; Tosaki et al., 2002). A remarkable contrast of the CO ratio is detected between the spiral arms and inter-arm regions in the grand-design spiral galaxy M51, suggesting an evolution of the physical conditions of the gas from the inter-arm regions, through the spiral arms, and back into the next inter-arm regions (Koda et al., 2012). These recent developments, however, are based on low-resolution observations of external galaxies (often kpc). Questions remain as to how the structures of molecular gas, especially on the scale of star formation ( pc; Lada & Lada, 2003), evolve through spiral arm passages, and how the evolution of the gas structures results in star formation.
The Milky Way is the nearest spiral galaxy in which we can resolve pc-sized molecular gas structures (i.e., the scale directly relevant to star and cluster formation). Recently, Sawada et al. (2012) (hereafter Paper I) have presented high-resolution and images of a area through the disk of the Milky Way at , and have shown that the spatial structure of the molecular gas varies distinctly between the arm and inter-arm regions. They found that the bright and spatially confined emission (typical scale of several pc) is predominantly seen in the Sgr arm, while the fainter, extended emission dominates in the inter-arm regions.
Paper I quantified this structural evolution, by introducing the Brightness Distribution Function (BDF) and Brightness Distribution Index (BDI). In particular, the BDI is a measure of the fractional contribution of spatially confined bright molecular emission over faint emission extended over large areas, and can be derived directly from velocity channel maps without pre-assumption of structures. Their analysis, however, is limited to this relatively small region, and it is important to determine the BDF and BDI over the Milky Way disk to reveal whether this important structural evolution is a general, fundamental process that leads to star formation across spiral arms.
In this Letter, we apply the analysis developed in Paper I to archival line emission data covering the majority of the Galactic plane in the first Galactic quadrant.
2. Data and Analysis
2.1. GRS Data
We use the data from the Boston University–Five College Radio Astronomy Observatory Galactic Ring Survey (GRS, Jackson et al., 2006), which covers a large area of the Milky Way disk, , . The data are converted from the antenna temperature into the main-beam temperature , by dividing by the main-beam efficiency, 0.48. The spatial resolution and sampling are and , respectively. Although the velocity sampling of the original data is 0.21 , we take a running mean with a width of 2 sampled every 1 , in order to improve the signal-to-noise ratio. The resultant velocity resolution and sampling are similar to those used in Paper I (2.7 and 1.3 , respectively). The BDI is calculated in regions of and .
2.2. The Brightness Distribution Index
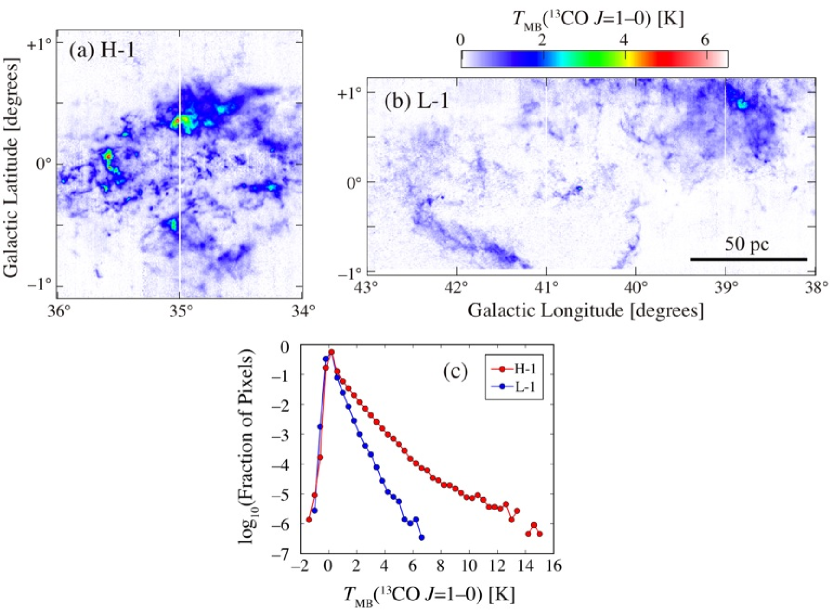
Remarkable variations in gas structure are visually apparent throughout velocity channel maps. Figure 1(a) and 1(b) show the maps of the two characteristic regions, H-1 and L-1 (their selections and properties are discussed in Section 3.2). In H-1, the emission shows high contrast in the spatial structure: i.e., there exist many compact and bright ( K) structures, as well as diffuse and faint ( K) emission. In L-1, on the other hand, the contrast is much lower than that in H-1: the diffuse and faint emission dominates, while there are only very few compact, bright structures.
The BDF is defined in a certain volume in –– space as the fraction of the “pixels” with brightness between and (i.e., the histogram of the brightness). It illustrates the differences in the spatial structure of the emission noted above. Figure 1(c) displays the BDFs in the regions H-1 and L-1. The presence of the compact and bright structures in H-1 appears as a long tail of the BDF toward high brightness, while the BDF in L-1 drops steeply.
Paper I introduced the BDI as a way to characterize the BDF in a single number, so that it can be correlated with other parameters. It is defined as the flux ratio of the bright emission to faint emission:
| (1) | |||||
where denotes the BDF; , , , and are the brightness thresholds; and is the brightness of the th pixel in the –– space. In this Letter we adopt the same brightness thresholds as Paper I, [K]. A high BDI denotes dominance of compact, bright structures. The BDIs in the regions H-1 and L-1 are and , respectively.
The BDI is, by its definition, (1) free from any assumptions about structures in the gas, such as giant molecular clouds (GMCs) and cores/clumps within GMCs; and (2) independent of the amount of gas (i.e., an intensive property). The BDI is meaningful when it is defined with a number of pixels sufficiently large to represent the statistical characteristics of the volume of interest, and with a spatial resolution better than the typical scale of bright, compact structures (several pc: Paper I, ) so that such structures are not smeared out. One degree corresponds to , 90, and 140 pc at distances of 3, 5, and 8 kpc, respectively. Therefore, each area in the – plane () that we analyze here is larger than the traditional GMC whose average size is pc (Scoville et al., 1987). The spatial resolution of corresponds to 0.7, 1.1, and 1.8 pc at 3, 5, and 8 kpc, respectively.
3. Results
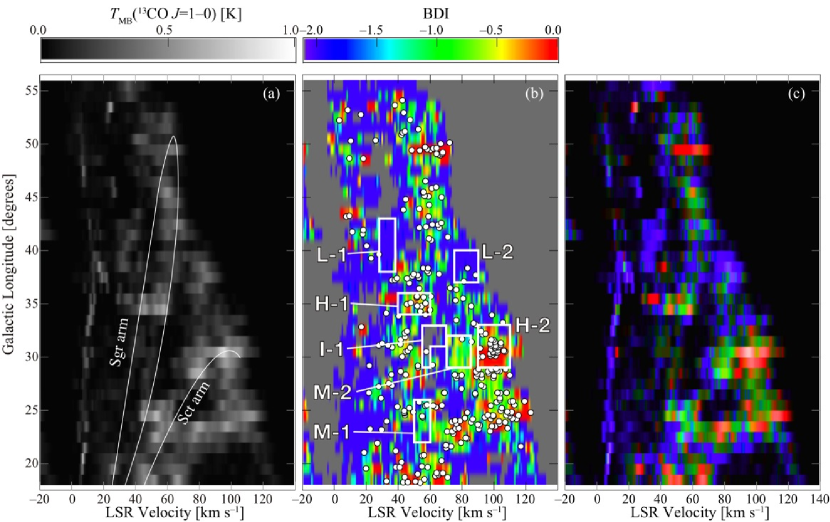
Figure 2(a) and (b) present the longitude–velocity (–) distribution of intensity and the BDI, respectively. Figure 2(c) displays the line intensity and the BDI simultaneously: i.e., the brightness represents the intensity [same as (a)] and is colored by the BDI value [same as (b)]. The H II regions which are located inside the sky coverage of the GRS (Anderson & Bania, 2009) are overlaid on the – diagram of the BDI in Figure 2(b). The white polygons on Figure 2(b) are the regions which are discussed in Section 3.2.
3.1. Enhanced BDI along Spiral Arms
There is a band of high BDI () from to in the – diagram. This high-BDI band coincides with a band of H II regions which was found in space and velocity using radio recombination lines and has been commonly identified as a spiral arm of the Milky Way, the Sgr arm (e.g., Mezger, 1970; Georgelin & Georgelin, 1976; Lockman, 1979; Downes et al., 1980). Chains of H II regions are indeed found along spiral arms in external galaxies as well (Scoville et al., 2001). It is noteworthy that the region on the band shows high BDI, even though the intensity is low. The structured molecular gas traced by the higher BDI reveals the continuation of the spiral arm independent of the total intensity (amount) of the gas. In Paper I we found that the BDI is high at the spiral arm velocities in a field at . The present result supports our finding with analysis of data which covers a much wider region. The Sct arm also exists in the coverage of the GRS, from to the Sct tangent at , and shows high BDI.
3.2. Individual Regions
The polygons on Figure 2(b) are example of regions with three ranges of BDI: low (L-1 and L-2; ), moderately high (M-1 and M-2; ), and high (H-1 and H-2; ), as well as an inter-arm region (I-1). These are chosen as representative regions, based on inspection of the full data cube, and with environments well characterized in the literature.
3.2.1 Massive Complexes with Low BDI
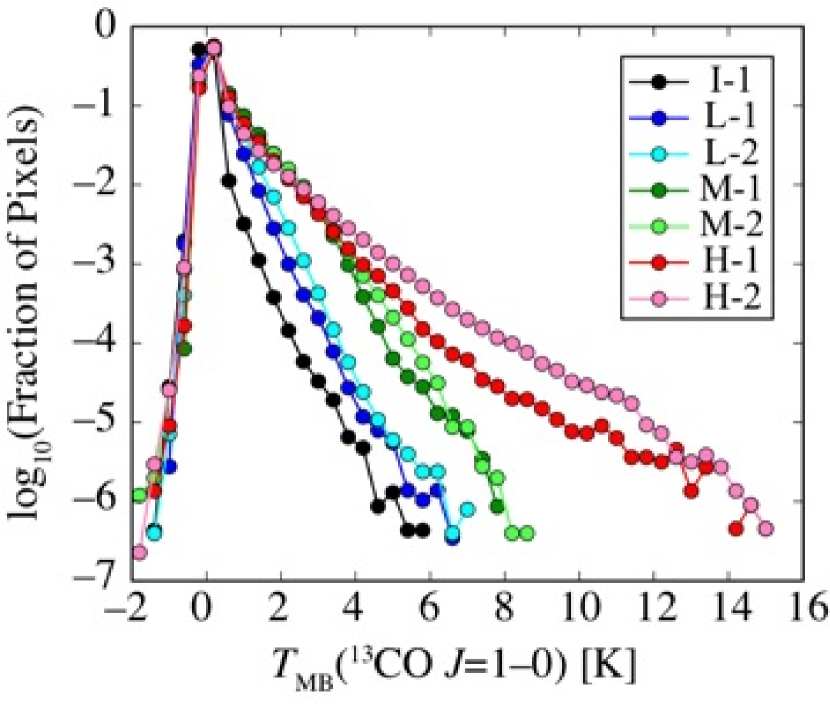
We find two complexes which have low BDI in spite of high intensity. One of them, L-1, is likely to be located at the near side of ( kpc, Dame & Thaddeus, 1985)111 Although Dame & Thaddeus (1985) called this complex as a W50 cloud and Huang et al. (1983) discussed the physical association between the cloud and W50 SNR, a recent study (Lockman et al., 2007) suggested that W50 is located in the far background., and was shown in Figure 1(b). The other (L-2) is at the tangent point of (6.7 kpc, Paper I, ). They are located outside the – loci where the Sct and Sgr arms exist, and therefore, are supposedly in the inter-arm regions. The BDFs in these regions (Figure 3) drops steeply toward high intensity, which is similar to that we found in a part of L-2 (Paper I). We also derived the BDF in the inter-arm region I-1 whose intensity is much lower than those of L-1 and L-2. The slope of the BDF in I-1 is close to those in L-1 and L-2 at K. The offset of the BDFs (i.e., I-1 is lower by ) is attributed to the lower filling factor in –– volume in I-1 by about an order of magnitude.
L-1 and L-2 are distinguished from other inter-arm regions by their high intensity (i.e., concentration of molecular content). Assuming local thermodynamic equilibrium at an excitation temperature of 10 K and the abundance ratios of and (Langer & Penzias, 1993; Savage et al., 2002; Milam et al., 2005), we estimate their masses to be 0.26 and , respectively. However, a substantial part of L-1 is extended beyond the latitude coverage of the GRS, . Dame & Thaddeus (1985) estimated the mass to be based on their wide-field observations. Shane (1972) derived the atomic mass density () and the azimuthal extent () of the H I feature corresponding to L-2. These values yield the atomic mass of , which is comparable to the molecular mass.
The catalog of Anderson & Bania (2009) lists no H II regions in L-1, and only a few in L-2. Maddalena & Thaddeus (1985) noted that the complex L-1 might be an object similar to the molecular cloud they found (Maddalena’s cloud) due to the lack of signs of star formation despite their large masses. It is interesting that such massive clouds (, which is near the upper end of the mass spectrum of GMCs: Solomon et al., 1987) have low BDI (lack structure) and show little evidence of star formation. The region L-2 has been proposed to be an inter-arm spur (e.g., Dame et al., 1986). This might be a counterpart of the spurs seen in external galaxies (e.g., Adler et al., 1992; García-Burillo et al., 1993), which are suggested to be remnants of massive GMCs as they are shredded and expand after spiral arm passage (Koda et al., 2009).
3.2.2 High-BDI (structured) Gas and Star Formation
The – distribution of H II regions in the first Galactic quadrant follows narrow patterns which trace the Sct and Sgr arms (e.g., Lockman, 1979). On these patterns, the BDI tends to be high (), as mentioned in Section 3.1. It supports our finding in Paper I that high BDI is seen at the velocities where H II regions exist. Hence, in a global point of view, high-BDI (structured) molecular gas is coincident with star-forming regions. Two interpretations are possible for this spatial coincidence: the high-BDI molecular gas could be either a result of star formation, or the cause.
There are indeed some moderately-high-BDI regions associated with few H II regions, which may indicate that the development of structured gas precedes star formation. The regions M-1 and M-2 on the Sct arm show moderately high () BDI and high intensity, although the density of H II regions within them is low compared with the other parts of the Sct arm. Dame et al. (1986) also pointed out that M-2 is an unusual complex in that it lacks associated H II regions (only one in the catalog of Anderson & Bania, 2009).
4. Discussion
The above results may indicate the following scenario for the evolution of the gas through the spiral arms. Faint and diffuse (not structured) molecular gas, whose prototypes are the I-1, L-1, and L-2 regions, exist in the inter-arm regions. Entering the spiral arms, the gas develops bright and compact structures which become pre-star-forming complexes like M-1 and M-2. When stars form from these structures, the BDI becomes very high. The regions H-1 and H-2 may be in this stage. Then, once the gas leaves the arms, it returns to a diffuse state.
Comparison of the BDFs in individual regions gives us a clue to understanding how star formation affects BDF/BDI. The regions H-1 (W44) and H-2 (W43) are prototypes of active star-forming regions (i.e., associated with a number of H II regions) and show very high () BDI. The BDFs in these regions (Figure 3) are characterized by long tail toward the high brightness ( K), which distinguish them from the moderately-high-BDI regions M-1 and M-2 (presumably pre-star-forming complexes). While M-1 and M-2 show a similar level of emission at K as H-1 and H-2, they lack emission at K. This suggests that star-forming activity produces an excess in the BDF at very high brightness.
From the comparison of the BDFs in and in Paper I (Figures 7 and 8 therein), the emission brighter than 8 K in corresponds to K in , which indicates the kinetic temperature K if the line is thermalized and optically thick. This temperature is higher than the kinetic temperature of the bulk molecular gas in GMCs, 10–20 K, corresponding to K in . Therefore the long tail of the BDF at K in the high-BDI regions is likely the consequence of the intense heating around star-forming regions, e.g., in photodissociation regions (Tielens & Hollenbach, 1985).
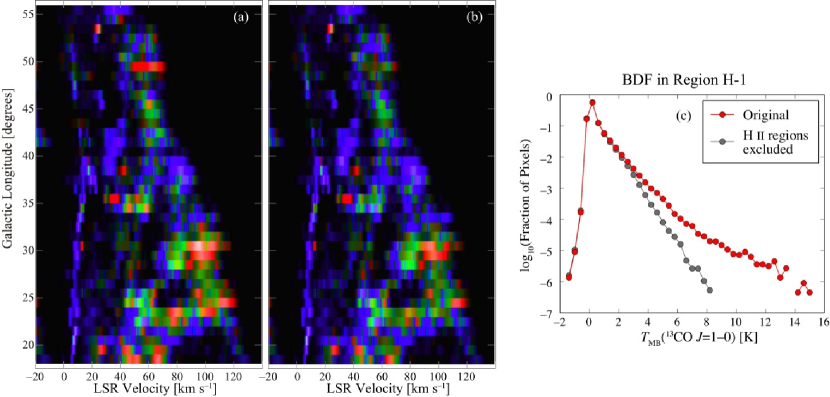
In order to separate the two possibilities, i.e., the high-BDI gas as result or cause of star formation, we exclude the gas under direct influence of massive star formation. We mask the radii of from the ultra-compact and compact H II regions and from the diffuse H II regions in the catalog of Anderson & Bania (2009). Figure 4(b) displays the – diagram after the mask. Compared with the original BDI (Figure 4(a)), high-BDI gas mostly turns into moderately-high-BDI gas, whereas moderately-high-BDI gas persists in the spiral arms. The BDF in the region H-1 before and after excluding the H II regions is shown in Figure 4(c). The BDF after excluding the H II regions is truncated at , resembling the BDFs in the moderately-high-BDI regions M-1 and M-2. These results reinforce our argument that moderately-high-BDI gas formation precedes star formation, while the high- tail of the BDF in high-BDI regions is the consequence of star formation. This analysis alone cannot exclude other possibilities that could enhance the BDI, such as due to potential uncatalogued H II regions and supernova remnants. More extensive studies are necessary to assess the impacts of their effects.
By applying the BDF/BDI analysis to the high spatial resolution data, the present study enables us to distinguish between structured molecular gas with and without star formation, both of which were classified as the same population in low-resolution studies (Sanders et al., 1985; Solomon et al., 1985; Scoville et al., 1987, see Section 3.1). More studies of the BDF/BDI in nearby molecular clouds would provide us with better understanding of the relationship between the star-forming activity and the BDF/BDI.
5. Conclusions
In this Letter, we examined the structural variation of molecular gas in the first Galactic quadrant. We applied the analyses of the BDF and the BDI developed in Paper I to the emission line data from the GRS (Jackson et al., 2006). The major findings are summarized as follows:
-
1.
The high BDI bands in the – diagram are found along the bands of H II regions (i.e., the Sgr and Sct arms). Molecular gas in the spiral arms is structured, hosting relatively abundant compact concentrations.
-
2.
In the inter-arm regions, we found two examples of massive molecular gas complexes () which show low BDI and no/little signature of star formation despite their large masses.
-
3.
Molecular gas with high BDI usually has H II regions associated with it in space and velocity. There is also an interesting component of the molecular gas with moderately-high BDI which shows no/little signature of ongoing massive star formation (H II regions).
-
4.
These results suggest the structural evolution of molecular gas through spiral arms passages. The faint and mostly extended gas in the inter-arm regions develops bright and compact structures upon entering the spiral arms. Stars form in the compact structures of the gas. The gas then becomes diffuse as it leaves the arms.
As we see in this Letter, the BDF and BDI of molecular lines are new, useful tools to diagnose the properties of molecular gas, in terms of the spatial structures in the gas. The physics that underlie the observed evolution is still unknown, though it is likely related to the gas dynamics around spiral arms. With the full commissioning of Atacama Large Millimeter/submillimeter Array, high-fidelity molecular line images of nearby galaxies with the critical several-pc spatial resolution is becoming feasible. Such images would enable us to make BDI maps for external galaxies, which should open a door to a synthetic picture of the evolution of interstellar gas and star formation in various galactic environments.
References
- Adler et al. (1992) Adler, D. S., Lo, K. Y., Wright, M. C. H., Rydbeck, G., Plante, R. L., & Allen, R. J. 1992, ApJ, 392, 497
- Anderson & Bania (2009) Anderson, L. D., & Bania, T. M. 2009, ApJ, 690, 706
- Dame et al. (1986) Dame, T. M., Elmegreen, B. G., Cohen, R. S., & Thaddeus, P. 1986, ApJ, 306, 892
- Dame & Thaddeus (1985) Dame, T. M., & Thaddeus, P. 1985, ApJ, 297, 751
- Dame & Thaddeus (2011) Dame, T. M., & Thaddeus, P. 2011, ApJ, 734, L24
- Dobbs et al. (2006) Dobbs, C. L., Bonnell, I. A., & Pringle, J. E. 2006, MNRAS, 371, 1663
- Downes et al. (1980) Downes, D., Wilson, T. L., Bieging, J., & Wink, J. 1980, A&AS, 40, 379
- Egusa et al. (2011) Egusa, F., Koda, J., & Scoville, N. 2011, ApJ, 726, 85
- García-Burillo et al. (1993) García-Burillo, S., Guélin, M., & Cernicharo, J. 1993, A&A, 274, 123
- Georgelin & Georgelin (1976) Georgelin, Y. M., & Georgelin, Y. P. 1976, A&A, 49, 57
- Huang et al. (1983) Huang, Y.-L., Dame, T. M., & Thaddeus, P. 1983, ApJ, 272, 609
- Jackson et al. (2006) Jackson, J. M., Rathborne, J. M., Shah, R. Y., et al. 2006, ApJS, 163, 145
- Knapen et al. (1996) Knapen, J. H., Beckman, J. E., Cepa, J., & Nakai, N. 1996, A&A, 308, 27
- Koda et al. (2012) Koda, J., Scoville, N., Hasegawa, T., et al. 2012, ApJ, submitted
- Koda et al. (2009) Koda, J., Scoville, N., Sawada, T., et al. 2009, ApJ, 700, L132
- Lada & Lada (2003) Lada, C. J., & Lada, E. A. 2003, ARA&A, 41, 115
- Langer & Penzias (1993) Langer, W. D., & Penzias, A. A. 1993, ApJ, 408, 539
- Lockman (1979) Lockman, F. J. 1979, ApJ, 232, 761
- Lockman et al. (2007) Lockman, F. J., Blundell, K. M., & Goss, W. M. 2007, MNRAS, 381, 881
- Maddalena & Thaddeus (1985) Maddalena, R. J., & Thaddeus, P. 1985, ApJ, 294, 231
- Mezger (1970) Mezger, P. G. 1970, The Spiral Structure of Our Galaxy (IAU Symp. 38), ed. W. Becker & G. I. Kontopoulos (Dordrecht: Reidel), 107
- Milam et al. (2005) Milam, S. N., Savage, C., Brewster, M. A., Ziurys, L. M., & Wyckoff, S. 2005, ApJ, 634, 1126
- Rand (1993) Rand, R. J. 1993, ApJ, 410, 68
- Rand et al. (1999) Rand, R. J., Lord, S. D., & Higdon, J. L. 1999, ApJ, 513, 720
- Roberts (1969) Roberts, W. W. 1969, ApJ, 158, 123
- Sakamoto et al. (1997) Sakamoto, S., Hasegawa, T., Handa, T., Hayashi, M., & Oka, T. 1997, ApJ, 486, 276
- Sanders et al. (1985) Sanders, D. B., Scoville, N. Z., & Solomon, P. M. 1985, ApJ, 289, 373
- Savage et al. (2002) Savage, C., Apponi, A. J., Ziurys, L. M., & Wyckoff, S. 2002, ApJ, 578, 211
- Sawada et al. (2012) Sawada, T., Hasegawa, T., Sugimoto, M., Koda, J. & Handa, T. 2012, ApJ, 752, 118 (Paper I)
- Scoville et al. (2001) Scoville, N. Z., Polletta, M., Ewald, S., Stolovy, S. R., Thompson, R., & Rieke, M. 2001, ApJ, 122, 3017
- Scoville et al. (1987) Scoville, N. Z., Yun, M. S., Clemens, D. P., Sanders, D. B., & Waller, W. H. 1987, ApJS, 63, 821
- Sempere & García-Burillo (1997) Sempere, M. J., & García-Burillo, S. 1997, A&A, 325, 769
- Shane (1972) Shane, W. W. 1972, A&A, 16, 118
- Shetty & Ostriker (2006) Shetty, R., & Ostriker, E. C. 2006, ApJ, 647, 997
- Solomon et al. (1987) Solomon, P. M., Rivolo, A. R., Barrett, J., & Yahil, A. 1987, ApJ, 319, 730
- Solomon et al. (1985) Solomon, P. M., Sanders, D. B., & Rivolo, A. R. 1985, ApJ, 292, L19
- Tielens & Hollenbach (1985) Tielens, A. G. G. M., & Hollenbach, D. 1985, ApJ, 291, 722
- Tosaki et al. (2002) Tosaki, T., Hasegawa, T., Shioya, Y., Kuno, N., & Matsushita, S. 2002, PASJ, 54, 209
- Wada (2008) Wada, K. 2008, ApJ, 675, 188
- Wada & Koda (2004) Wada, K., & Koda, J. 2004, MNRAS, 349, 270