THz spectroscopy in the pseudo-Kagome system Cu3Bi(SeO3)2O2Br
Abstract
Terahertz (THz) transmission spectra have been measured as function of temperature and magnetic field on single crystals of Cu3Bi(SeO3)2O2Br. In the time-domain THz spectra without magnetic field, two resonance absorptions are observed below the magnetic ordering temperature K. The corresponding resonance frequencies increase with decreasing temperature and reach energies of 1.28 and 1.23 meV at 3.5 K. Multi-frequency electron spin resonance transmission spectra as a function of applied magnetic field show the field dependence of four magnetic resonance modes, which can be modeled as a ferromagnetic resonance including demagnetization and anisotropy effects.
pacs:
76.50.+g,78.30.-j,75.10.HkI Introduction
Systems composed of S=1/2 spins on a two-dimensional Kagome lattice can be strongly frustrated due to competing exchange interactions, which may lead to interesting ground states and exotic low-energy excitations.Balents10 Cu3Bi(SeO3)2O2X (X = Cl, Br) is such a system that is composed of Cu2+ ions on slightly buckled Kagome layers with weak inter-layer coupling.Millet01 This system also has an interesting noncollinear magnetic structure as the non-nearest-neighbor exchange paths mediated by the lone-pair ions Bi3+ and Se4+ could be more efficient than the nearest-neighbor one.Lemmens03 ; Pregelj12
Cu3Bi(SeO3)2O2X crystallizes in an orthorhombic symmetry with space group Pmmn.Pring90 The unit-cell parameters of Cu3Bi(SeO3)2O2Br are Å, Å, and Å.Millet01 The structure is characterized by two types of Cu ions, Cu1 and Cu2, with the site symmetries and mm2, respectively. These Cu ions are surrounded by four oxygen ions forming two types of planar building blocks. Every block shares one corner with each of the two neighboring blocks.Pregelj12 Neutron-diffraction experiments and magnetic susceptibility measurements have revealed a magnetic ordering transition from a paramagnetic to an antiferromagnetic phase at 27.4 K.Pregelj12 In the antiferromagnetic state, the spins of Cu ions from neighboring ab-layers are aligned antiparallel.Pregelj12 Within an ab-layer, the spins of Cu2 ions are parallel. The spins of Cu1 ions along the a-axis are aligned parallel, while those of Cu1 ions along the b-axis form a noncollinear order. The inter-layer antiferromagnetic ordering can be switched to ferromagnetic by an applied magnetic field of 0.8 T along the c-axis at 2 K.Pregelj12 This is confirmed by specific-heat measurements in an applied magnetic field.Guenther12 Strong exchange anisotropy has been found in Cu3Bi(SeO3)2O2Br with the c-axis as the easy axis according to the magnetic susceptibility measurements.Pregelj12 The saturation of magnetization is reached at 0.8 T with the applied magnetic field along c-axis, while the saturation field is about 7 and 15 T for the field parallel to b- and a-axis, respectively. Nevertheless, the nature of the exchange interactions is still unclear, since the additional exchange paths via Cu-O-Z-O-Cu (Z = Bi, Se) could be more important than the nearest-neighbor Cu-O-Cu paths.Deisenhofer06 ; Das ; Wang11b
In this work we perform temperature-dependent THz time-domain transmission measurements and multi-frequency electron spin resonance transmission experiments on single crystals of Cu3Bi(SeO3)2O2Br. Four magnetic resonance modes have been resolved from the spectra. In the ferromagnetic phase above 0.86 T, demagnetization and magnetic anisotropy effects have been considered to model the field dependence of the resonance modes in terms of ferromagnetic resonance. This modeling yields a g-factor of 2.04(8) and a magnetic anisotropic energy of approximately 0.25 meV.
II Experimental details
Single crystals of Cu3Bi(SeO3)2O2Br were grown at by chemical-transport reaction with bromine as transport agent using polycrystalline material prepared by solid-state reactions from high-purity binary compounds.Pregelj12 Time-domain THz transmission measurements were carried out on a mm3 single crystal for 3.5 K 300 K using a TPS spectra 3000 spectrometer with focusing optics (TeraView Ltd.). Multi-frequency transmission experiments were performed with an external magnetic field varying up to 7 T in the Faraday configuration (propagating vector H c-axis) on a mm3 single crystal with backward-wave oscillators covering the frequency range 300 - 490 GHz and a magneto-optical cryostat (Oxford/Spectromag).
III Experimental results and discussions
III.1 Time-domain THz spectra
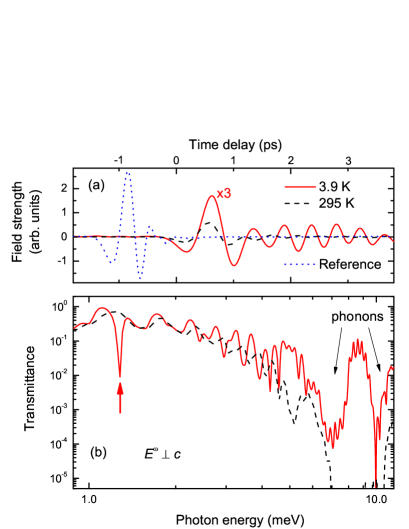
Figure 1(a) shows the transient electric field through the single crystal of Cu3Bi(SeO3)2O2Br as a function of time delay measured with the radiation electric field perpendicular to the c-axis () at 3.9 K and 295 K. Following the first pulse, one can observe more pulses with much lower magnitude due to the multiple interference at the sample surface. The resulting transmission after Fourier transformation of the time-domain signal is shown in Fig. 1(b). The observed transmission and phase correspond to a dielectric constant of about 12 at lowest frequencies. The spectrum at 295 K shows a strong absorption band from 7 to 11 meV, with transmission below the detection limit of the spectrometer. A periodic modulation on the transmission spectra can be seen in the whole frequency range due to the multiple interference effect. This absorption band is ascribed to phonons corresponding to the polarization of c, in agreement with the phonon spectra reported in the isostructural compound Cu3Bi(SeO3)2O2Cl.Miller12 In the spectrum at 3.9 K, the absorption bands are clearly discriminated from each other. Two absorption bands are evidently observed at about 7.2 meV ( cm-1) and 10.3 meV ( cm-1). These values are slightly smaller than the eigenfrequencies of 68.3 and 89.0 cm-1, respectively, where the corresponding phonons are observed in Cu3Bi(SeO3)2O2Cl at 7 K.Miller12 This is consistent with the ratio , where and are the molecular mass of Cu3Bi(SeO3)2O2Cl and Cu3Bi(SeO3)2O2Br, respectively. There are two other lower-lying phonons observed at 36.3 and 52.8 cm-1 in Cu3Bi(SeO3)2O2Cl.Miller12 The corresponding phonons cannot be clearly identified in the transmission spectrum of Cu3Bi(SeO3)2O2Br due to multiple interference effects.
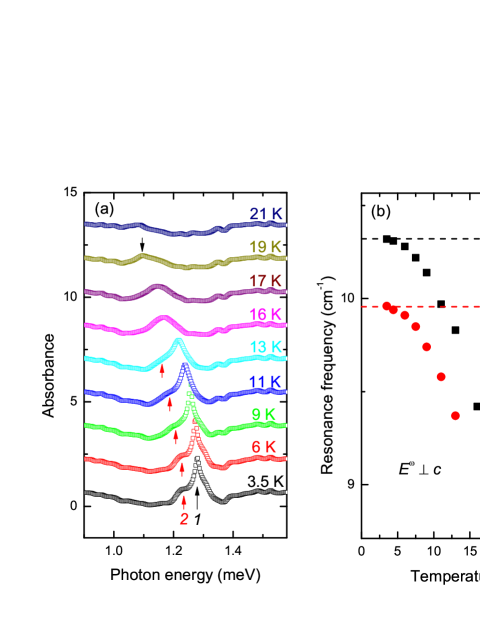
In the spectrum at 3.9 K in Fig. 1(b), a distinct feature can be observed at about 1.3 meV. Absorbance (Ab) is calculated from transmittance (Tr) via the relation . Figure 2(a) shows the absorbance versus frequency measured at various temperatures. An asymmetric peak (mode 1, black arrow) can be observed below 20 K in the antiferromagnetic phase. The peak shifts to higher frequency with decreasing temperature and two modes can be identified. At 3.5 K, the two modes are marked by arrows. The higher-lying mode 1 is sharper than the lower-lying mode 2. Above 15 K, mode 2 cannot be resolved anymore. The eigenfrequencies of both modes are plotted in Fig. 2(b) as a function of temperature. Since the modes are observed below the magnetic ordering temperature, the modes are assigned to magnetic excitations of the system. The hardening of the modes with decreasing temperature is reminiscent of the temperature dependence of a sublattice magnetization, and typical for magnetic resonance modes. The resonance frequencies of mode 1 and mode 2 at 3.5 K correspond to the energies of 1.28 and 1.23 meV, respectively.
III.2 Frequency-domain THz spectra with applied magnetic field
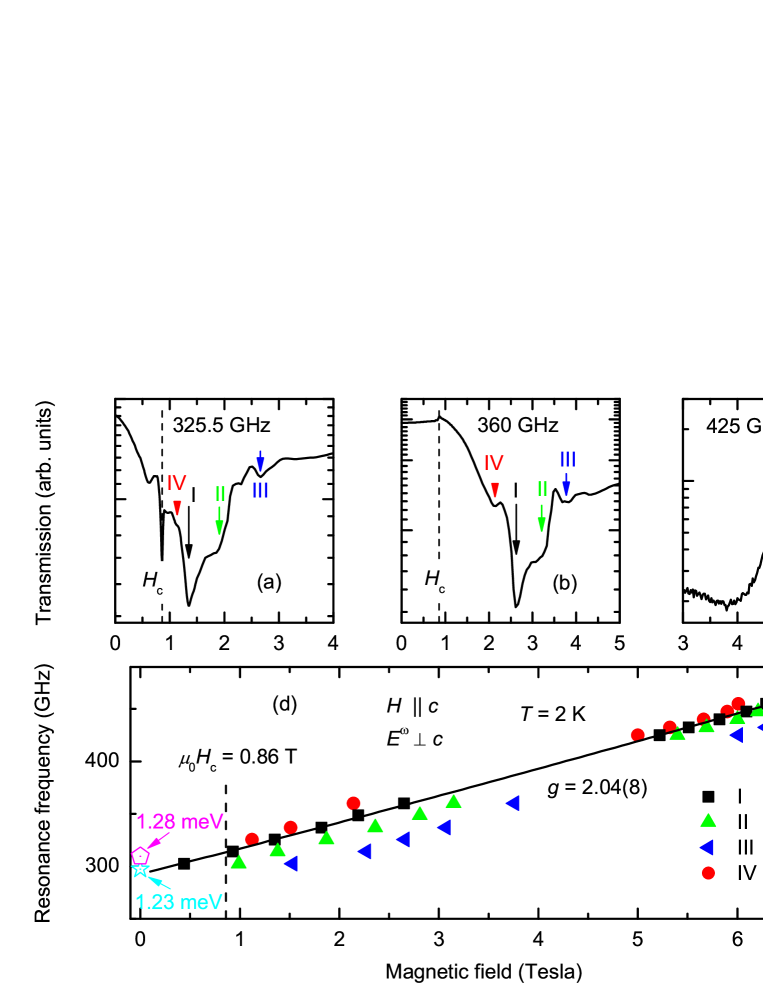
Figures 3(a)-(c) show the transmission spectra measured in a Faraday configuration ( H c-axis) with various radiation frequencies at 2 K. The magnetic field up to 7 T is applied along the c-axis. The radiation electric field is perpendicular to the c-axis (). An anomaly can be clearly seen in Fig. 3(a) and (b) at the magnetic field of T as indicated by the vertical dashed lines. This is consistent with the reported critical magnetic field of 0.8 T, above which the inter-layer ordering changes from antiferromagnetic to ferromagnetic.Pregelj12
Above , four resonance lines are observed in the transmission spectra at several frequencies. As marked by the arrows, one can see the strongest resonance mode at 5.21 T (mode I), and three other modes at 5.00, 5.40, and 6.01 T (mode IV, II, and III, respectively) from the transmission spectrum corresponding to 425 GHz radiation [Fig. 3(c)]. By comparing the spectra of different frequencies [Fig. 3(a)-(c)], we found that the resonance peaks shift to lower fields and become broader with decreasing frequency. The resonance frequencies versus resonance fields are plotted in Fig. 3(d). It clearly shows that all the four modes shift to higher frequency with higher magnetic field.
Neutron diffraction experiments have revealed that the magnetic moments of neighboring ab-layers order ferromagnetically along the axis (easy axis) when .Pregelj12 Above the total magnetic moment precesses about the direction of the static magnetic field, and energy is absorbed strongly from the incident radiation when its frequency is equal to the precessional frequency.Kittel7th For an easy-axis compound, the magnetic anisotropy energy can be approximated by , when the quartic and higher-order terms of are neglected, is the anisotropy constant, is the angle between the magnetization and the c axis (easy-axis). In the ferromagnetic phase, the resonance frequency depends strongly on the sample shape due to demagnetization effect. When the magnetic field is applied along the easy axis, the dependence of resonance frequency on the magnetic field is given byKittel7th ; Gurevich96
| (1) | ||||
where the magnetic anisotropy is considered, is the effective anisotropy field, is the magnetic moment per Cu ion, g is the Landé factor, is the Bohr magneton, is the Planck constant, is the vacuum permeability, and , , and are the demagnetization factors along the a, b, and c axes, respectively. The magnetization in Eq. (1) is, in general, a function of magnetic field. Above 0.86 T for , the magnetization reaches a saturation value corresponding to 0.9 per Cu ion.Pregelj12 Therefore, we can assume that is constant when we fit the data above .
We try to use Eq. (1) to describe the field dependence of the strongest mode (mode I), which is shown by the solid squares in Fig. 3(d). The fit to Eq. (1) is illustrated by the solid line in Fig. 3(d), which is in good agreement with the experimental data. The fit results in a g-factor of 2.04(8), T, and T. This g-factor is consistent with typical values for Cu2+ ions.Deisenhofer06 ; Wang11b ; Abragam1970 A consistent g-value of 2.16 has been reported in the isostructural compound Cu3Bi(SeO3)2O2Cl.Miller12 The fitted B value corresponds to the zero-field energy of 1.22(5) meV. This is slightly smaller than 1.28 meV, where the dominant mode is observed in the time-domain spectra (mode 1 in Fig. 2). For the other three modes with much smaller intensity (Fig. 3), the corresponding absorptions cannot be distinguished in the time-domain spectra.
The demagnetization factors and for an infinitely thin plate were used to estimate the anisotropy. Analyzing the experimental B value results in meV, while the analysis of A results in meV. Both values are consistent with the range meV estimated from the magnetization measurements via the relation due to the linear dependence of magnetization on magnetic field,Buschow03 where the saturation field has been determined as 7 T for and 15 T for .Pregelj12 It should be noted that deviations of the measured specimens’ shapes from an infinite thin plate are additional sources of uncertainty for the estimated parameters.
The magnetic resonance modes are intimately dependent on the microscopic magnetic structure, including the exact spin configuration and exchange interactions. According to the partially solved spin configuration,Pregelj12 the spins on different sublattices should have different exchange anisotropies. The difference can be small and results in additional resonance modes with close energies, as we have observed from the modes I - IV. We note that the surface anisotropy of a ferromagnetic compound can also lead to additional resonance modes with small difference in resonance energies.Kittel7th
In the isostructural compound Cu3Bi(SeO3)2O2Cl, another magnetic resonance mode was observed at much higher frequency of about 1 THz 33cm-1 with the same alignment of magnetic field, i.e., H c.Miller12 Besides being isostructural, Cu3Bi(SeO3)2O2Br has similar magnetic properties as Cu3Bi(SeO3)2O2Cl, such as magnetic-ordering temperature, magnetic anisotropy, and a field-induced metamagnetic transition.Millet01 ; Pregelj12 ; Miller12 Thus, it is natural to expect that the resonance mode around 1 THz can be also observed in Cu3Bi(SeO3)2O2Br, but it is probably hidden by interference effect and the influence of the low-lying phonons in this range. Hence, there might be at least five magnetic resonance modes present in this system. All of these modes shift to higher frequencies with higher magnetic field,Miller12 and five or more sublattices will have to be considered to describe the complete magnetic resonance spectra.
IV Conclusion
In summary, the temperature-dependent time-domain THz spectra of single-crystal Cu3Bi(SeO3)2O2Br have been measured with the radiation propagation vector perpendicular to the sample ab-plane. Two magnetic resonance modes have been resolved below the magnetic ordering temperature, where a paramagnetic to antiferromagnetic transition occurs. The two modes are hardening on decreasing temperature and reach energies of 1.28 and 1.23 meV at 3.5 K. Multi-frequency electron spin resonance transmission spectra have been measured in the Faraday configuration with the magnetic field parallel to the sample c-axis. Another two magnetic resonance modes are observed in these spectra. The dependence of the resonance modes on magnetic field are studied at 2 K, which reveals a monotonic increase of the resonance frequency with increasing magnetic fields. The demagnetization effect and exchange anisotropy have been considered to describe the field dependence of the dominant magnetic resonance mode, resulting in a g-factor of 2.04(8) and a zero-field resonance frequency of 1.22(5) meV. The magnetic anisotropy is estimated to be about 0.25 meV. In addition, a metamagnetic transition from antiferromagnetic to ferrimagnetic phase has been confirmed to occur at 0.86 T. These results are in agreement with those from neutron diffraction and magnetic susceptibility measurements.
Acknowledgements.
We thank A. Günther for the fruitful discussions. We acknowledge partial support by the Deutsche Forschungsgemeinschaft via TRR 80 (Augsburg-Munich), FOR 960 (Quantum Phase Transitions) and project DE 1762/2-1.References
- (1) L. Balents, Nature 464, 199 (2010).
- (2) P. Millet, B. Bastide, V. Pashchenko, S. Gnatchenko, V. Gapon, Y. Ksarid, and A. Stepanov, J. Mater. Chem. 11, 1152 (2001).
- (3) P. Lemmens, G. Guntherodt, and C. Gros, Phys. Rep. 375, 1 (2003).
- (4) M. Pregelj, O. Zaharko, A. Günther, A. Loidl, V. Tsurkan, and S. Guerrero, Phys. Rev. B 86, 144409 (2012).
- (5) A. Pring, B. M. Gatehouse, and W. D. Birch, American Mineralogist, 75, 1421 (1990).
- (6) A. Günther et al., unpublished.
- (7) J. Deisenhofer, R. M. Eremina, A. Pimenov, T. Gavrilova, H. Berger, M. Johnsson, P. Lemmens, H.-A. Krug von Nidda, A. Loidl, K.-S. Lee, and M.-H. Whangbo, Phys. Rev. B 74, 174421 (2006).
- (8) H. Das, T. Saha-Dasgupta, C. Gros, and R. Valentí, Phys. Rev. B 77, 224437 (2008).
- (9) Z. Wang, M. Schmidt, Y. Goncharov, Y. Skourski, J. Wosnitza, H. Berger, H.-A. Krug von Nidda, A. Loidl, and J. Deisenhofer, J. Phys. Soc. Jpn. 80, 124707 (2011)
- (10) K. H. Miller, P. W. Stephens, C. Martin, H. Berger, G. L. Carr, and D. B. Tanner, Phys. Rev. B 86, 174104 (2012).
- (11) C. Kittel, Introduction to Solid State Physics, (John Wiley & Sons, New York, 1996), seventh edition, Chapter 16.
- (12) A. G. Gurevich and G. A. Melkov, Magnetization Oscillations and Waves, (CRC Press, New York, 1996).
- (13) A. Abragam and B. Bleaney, Electron Paramagnetic Resonance of Transition Ions, Clarendon Press, Oxford (1970).
- (14) K. H. J. Buschow and F. R. de Boer, Physics of Magnetism and Magnetic Materials, (Kluwer Academic Publishers, New York, 2003), Chapter 11.