INTEGRAL and Swift observations of the Be X-ray binary 4U 1036-56 (RX J1037.5-5647)
and its possible relation with -ray transients
Abstract
We present timing, spectral, and long-term temporal analysis of the high mass X-ray binary (HMXB) 4U 1036–56 using INTEGRAL and Swift observations. We show that it is a weak hard X-ray source spending a major fraction of the time in quiescence, and only occasionally characterized by X-ray outbursts. The outburst activity we report here lasts several days, with a dynamic range spanned by the luminosity in quiescence and in outburst as high as . We report the detection of pulse period at 854.754.39 s during an outburst, which is consistent with previous measurements. Finally, we analyze the possibility of 4U 1036–56’s association with the unidentified transient -ray sources AGL J1037–5708 GRO J1036–55, as prompted by its positional correlation.
1 Introduction
Various classes of -ray sources, from Galactic objects like supernova remnants, pulsar wind nebulae, and binaries, to starburst galaxies and distant blazars (see, e.g., Hinton Hofmann 2009), have been detected up to the TeV band. Among them, the class of -ray emitting binaries focuses great attention. They are X-ray binaries hosting O/B companions, which have -ray emission up to High-Energy (HE, E100 MeV) and/or Very High-Energy (VHE, E100 GeV) regimes, modulated on the orbital period. Only a handful of such binaries are known (e.g., LS 5039, LSI +61 303, PSR B1259-63, HESS J0632+057, 1FGL J1018.6-5856, or Cyg X-3), although a larger population is expected (see, e.g., Ackermann et al. 2012).
In recent years, a number of unidentified, transient -ray sources were discovered in the Galactic plane, especially by Astrorivelatore Gamma a Immagini Leggero (AGILE). Many of them have also been suggested to have a possible binary nature (see, e.g., Sguera 2011a and references therein, Casares et al. 2012, see Torres et al. 2001 for variability studies in the EGRET era). These are shown in Table 1. All of them show transient behavior in -rays, and most of them are observed having fast and strong X-ray activity. No blazar-like candidate counterparts are found within their positional error uncertainties. Instead, all six candidates have been suggested to have a possible high mass X-ray binary (HMXB) counterpart, four of which are confirmed supergiant fast X-ray transients (SFXT) or candidate SFXTs. Two of the HXMB candidates are already identified to host a slowly rotating pulsar. The probability of finding e.g., a supergiant HMXB inside the AGILE error circle by chance, given the number of supergiant HMXBs detected by IBIS on the International Gamma-Ray Astrophysics Laboratory (INTEGRAL) within the Galactic plane is %, i.e. 0.5 chance coincidences are expected (Sguera et al. 2011a).
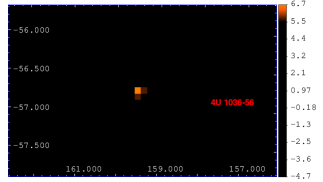
Two -ray transients (AGL J1037-5708 and GRO J1036-55) are located in the same region of the sky, and with the caveat of the large positional uncertainties involved, they could perhaps be associated (see Figure 1). AGL J1037-5708 is an unidentified, transient MeV source discovered by AGILE near the Galactic plane (Bulgarelli et al. 2010). AGILE detected intense -ray emission above 100 MeV from AGL J1037-5708 between 2010-11-27 21:18 UT to 2010-11-30 14:08 UT. A maximum likelihood analysis yields a detection larger than 5 for energies larger than 100 MeV with a flux above 300 photons cm-2 s-1.
| Name | Possible X-ray | Possible optical or | Distance (kpc) | Refs. | Duration of flares (outburst) | Dynamic range | Refs. |
|---|---|---|---|---|---|---|---|
| Refs. | counterpart | infrared counterpart | Orb. period (days) | ||||
| Orb. eccentricity | |||||||
| Pulse period (s) | |||||||
| AGL J17343310 | IGR J173543255 | 2MASS | 2 | 0.5–65 hours @ 18–60 keV | 200 | 1, 4 | |
| 1, 2, 3, 4 | transient HMXB | J17352760 | 8.44740.0017 | 1 | 1 day @ MeV | ? | 3 |
| candidate SFXT | 3255544 | ? | |||||
| ? | |||||||
| AGL J20223622 | IGR J201883647 | ? | ? | 60 mins @ 20–40 keV | 90 | 5 | |
| 5, 6 | transient | ? | 1 day @ E MeV | ? | 6 | ||
| candidate SFXT | ? | ||||||
| ? | |||||||
| ERG J11225946 | IGR J112155952 | HD 306414 | 10 | 15 mins–2 hours (15 days) @ 1–10 keV | 1000 | 7, 8 | |
| 5, 7, 8, 9, | transient HMXB pulsar | (B1 Ia) | 7 | variable @ MeV | ? | 12 | |
| 10, 11, 12 | confirmed SFXT | ? | |||||
| 186.78 0.3 | 9 | ||||||
| AGL J22414454 | ? | MWC 656 | 2.6 1.0 | 14 | ? | ||
| 13, 14, 15 | binary system | (B3 IVnesh) | 60.37 0.04 | 14 | 1 day @ E MeV | ? | 13 |
| with compact star | 0.4 0.1 | 15 | |||||
| ? | |||||||
| AGL J10375708 | 4U 103656 | LS 1698 | 18 | (4–10 days) @ 18–60 keV | 21 | ||
| GRO J103655 | persistent HMXB pulsar | (B0 IIIVe) | 847? or 645? | 19 | 3 days @ MeV | ? | 16 |
| 16, 17, 18, 19 | ? | 12 days @ 3–10 MeV | ? | 17 | |||
| 20, 21, 22 | 853.40.2 | 20 | |||||
| 3EG J1837–0423 | AX J1841.0-0536 | 2MASS | 6.91.7 | 24 | a few days (a few hours) @ 0.2–10 keV | 27 | |
| 23, 24, 25 | transient HMXB | J18410043 | ? | 3.5 days @ MeV | ? | 23 | |
| 26, 27, 28 | confirmed SFXT | -0535465 | ? | ||||
| (B1 Ib) | ? | 25 |
GRO J1036–55 was discovered by the Imaging Compton Telescope (COMPTEL) on Compton Gamma-Ray Observatory (CGRO) at a significance level of 5.6 , reaching a flux level of 350 mCrab in the 3-10 MeV band (Zhang Collmar 2007). During the COMPTEL’s lifetime of 9 years, GRO J1036–55 is only visible during that flare, from 1996–10–03 to 1996–10–15 (MJD 50359–MJD 50361). An analysis of simultaneous Energetic Gamma Ray Experiment Telescope (EGRET) data at energies larger than 100 MeV did not yield any evidence for the source. The energy spectrum indicated a spectral maximum at MeV.
The HXMB 4U 1036–56 is the only X-ray source located in the region of these transients. 4U 1036–56 first appeared in the 4th UHURU catalogue (Forman et al. 1978), and it was detected by the Seventh Orbiting Solar Observatory (OSO-7) as 1M 1022-554 (Markert et al. 1979). The first X-ray outburst from 4U 1036–56 was observed by Ariel V in 1974, from November 11th to 19th (MJD 42362–MJD 42370), see Warwick et al. (1981). The maximum flux of the outburst was 2.4 erg cm-2 s-1, 2.4 times the Uhuru average flux in the same energy range (2–10 keV). During the Roentgen Satellite (ROSAT) survey, 4U 1036–56 was about 10 times dimmer than it was in 1970–1976 (Motch et al. 1997). 4U 1036–56 was later observed by Rossi X-ray Timing Explorer (RXTE) (Reig Roche, 1999), X-ray Multi-Mirror Mission (XMM-Newton) (La Palombara et al. 2009), Swift (see below for details), and appeared in the third and fourth IBIS catalogues (Bird et al. 2007, 2010). The flux measured by XMM-Newton is also one order of magnitude lower than the previous average value, suggesting 4U 1036–56 is characterized by significant variability.111One of the ROSAT observations yielded an even lower luminosity but may possibly be inaccurate because it is derived from a count rate measurement in a different energy range, then converted into 2-10 keV energy band (La Palombara et al. 2009). Chandra, Suzaku, and Monitor of All-sky X-ray Image (MAXI) have not observed 4U 1036–56 yet. Thus, across a time interval of about 35 years, 4U 1036–56 was detected at a luminosity of (1–3) erg s-1 between 2 and 10 keV in several instances, with some excursions to lower values (La Palombara et al. 2009). The optical counterpart of 4U 1036–56 is identified with LS 1698, a B0 III–Ve star at 5 kpc (Motch et al. 1997). Reig & Roche (1999) performed detailed timing and spectral analysis with RXTE observations, and discovered a pulsation with period P = 860 2 s. Based on this behavior, Reig Roche (1999) proposed that 4U 1036–56 is a persistent, low-luminosity binary pulsar. With XMM-Newton observations, La Palombara et al. (2009) found a period of 853.40.2, indicating an average pulsar spin-up s s-1 in the last decade.
Except for 4U 1036–56 and MWC 656 (see Table 1), the other four possible X-ray counterparts for -ray transients are studied in detail in the literature (see Sguera et al. 2009a,b, 2011a). But opposite to MWC 656, for which few X-ray observations are available and no X-ray counterpart is identified, there is plenty of data in X-rays for 4U 1036–56 that has yet to be analyzed. In this work, we report on timing, spectrum, and long-term temporal analysis of INTEGRAL and Swift data on 4U 1036–56, examining the possibility of its association with the unidentified transient -ray sources AGL J1037–5708 GRO J1036–55.
2 Observations and data analysis
INTEGRAL (Winkler et al. 2003) is a -ray mission covering the energy the range 15 keV–10 MeV. Observations of INTEGRAL are carried out in individual Science Window (ScW), which have a typical time duration of about 2000 s. For the INTEGRAL analysis in this paper, we use all public IBIS/ISGRI and JEM–X data for which 4U 1036–56 has offset angle less than 9o and 5o, respectively. Our data set comprised about 1607 ScWs for IBIS/ISGRI and 856 ScWs for JEM–X. The data covers revolutions 36–867, from 2003-01-29 to 2009-11-20 (MJD 52668–55155), adding up to a total exposure time of 4.42 Ms for IBIS/ISGRI and 1.02 Ms for JEM–X (0.91 Ms from JEM-X 1 and 0.1 Ms from JEM-X 2). The data reduction is performed using the standard ISDC offline scientific analysis software version 9.0. IBIS/ISGRI images for each ScW are generated in the energy band of 18–60 keV. The counts rate at the position of the source are extracted from all individual images to produce the long–term lightcurve on the ScW time–scale. When 4U 1036–56 is found to be in outburst, the spectra are produced following the standard steps as stated in the IBIS Analysis User Manual, running the pipeline from the raw data to SPE and LCR level. In the quiescent period, the spectrum is obtained using the mosaic images, as is appropriate for spectral analysis of faint sources. The spectrum and lightcurve of JEM–X during the outburst period is produced following to the standard steps as stated in JEM-X Analysis User Manual, using OSA 9.0.222See http://www.isdc.unige.ch/integral/analysis for more information.
Swift (Gehrels et al. 2004) is a -ray burst explorer. It carries three co-aligned detectors: the Burst Alert Telescope (BAT, Barthelmy et al. 2005), the X-Ray Telescope (XRT, Burrows et al. 2005), and the Ultraviolet/Optical Telescope (UVOT, Roming et al. 2005). To compare with INTEGRAL results, the 65–months Swift/BAT Snapshot Survey lightcurve of 4U 1036–56 is also inspected.333See http://swift.gsfc.nasa.gov/docs/swift/results/bs58mon/SWIFT_J1037.6-5649 for more information on Swift/BAT survey lightcurve of 4U 1036-56. The 14–195 keV lightcurve covers from 2004-12-16 (MJD 53355) to 2010-05-31 (MJD 55347). It is produced with individual snapshot images from 5-minute observations, corrected for off-axis effects. This lightcurve is rebinned to a 1-day timescale to improve the signal to noise ratio. The total exposure time of 4U 1036–56 in this lightcurve is 19.4 Ms.
We have also used the data collected by the XRT instrument on board the Swift satellite (when the source was in outburst, see Krimm et al. 2012). 4U 1036–56 was first detected by the BAT in the 15-50 keV band on 2012 Feb. 3, its flux peaked on 2012 Feb. 6 (MJD 55963), remaining detectable through Feb. 13. A 2982-seconds, Photon Counting mode XRT observation was performed on 2012 Feb. 17, for which we present timing and spectral analysis. We use archival level 2 XRT data in our analysis. The selection of event grades is 0-12, for Photon Counting data (see Burrows et al. 2005). To correct for the pile-up effect we estimate the size of the Point Spread Function (PSF) core affected. By comparing the observed and nominal PSF (Romano et al. 2006; Vaughan et al. 2006), a radius of 4 pixels are determined and all the data within this radius from 4U 1036–56 are excluded. Source events are accumulated within an annulus (inner radius of 4 pixels and outer radius of 30 pixels, 1 pixel 2.36 arcsec)444See http://www.swift.ac.uk/analysis/xrt/pileup.php for more information. Background events are accumulated within a circular, source-free region with a radius of 60 pixels. For timing analysis, the BARYCORR task is used to perform barycentric corrections to the photon arrival times. We extract lightcurves with a time resolution of 2.5 seconds. The XRTLCCORR task is used to account for the pile-up correction in the background-subtracted light curves. For our spectral analysis, we extract events in the same regions as those adopted for the lightcurve creation. Exposure maps are generated with the task XRTEXPOMAP. Ancillary response files are generated with the task XRTMKARF, to account for different extraction regions, vignetting, and PSF corrections. In order to search for a periodic signal in the Swift lightcurve, we used the Lomb–Scargle periodogram method (Lomb 1976; Scargle 1982). Power spectra are generated for the lightcurve using the PERIOD subroutine (Press Rybicki 1989). The 99.99% white noise significance level is estimated using Monte Carlo simulations (see e.g. Kong, Charles Kuulkers 1998). The 99% red noise significance level is estimated using the REDFIT subroutine, which can provide the red noise spectrum via fitting a first-order autoregressive process to the time-series (Schulz Mudelsee 2002; Farrell et al. 2009).555See ftp://ftp.ncdc.noaa.gov/pub/data/paleo/softlib/redfit for more information. All of the spectral analysis is performed using XSPEC version 12.6.0; uncertainties are given at the 1 confidence level for one single parameter of interest.
3 Results
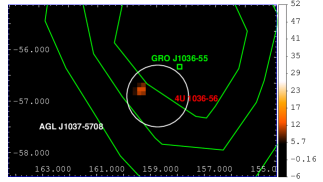
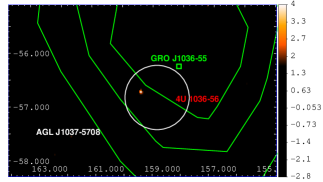
Combining all the ISGRI data, 4U 1036–56 is detected by IBIS/ISGRI with a significance level of 11.2 and an average intensity of 0.1800.016 counts s-1 in the 18–60 keV band. Figure 1 (left panel) shows the IBIS/ISGRI mosaic image of the 4U 1036–56 sky region. In Figure 1, the position of the transient AGILE source AGL J1037–5708 ( 100 MeV) (Bulgarelli et al. 2010) is also plotted, noted with its 95 position uncertainty as a white circle. Also, the transient source GRO J1036–55 detected by COMPTEL in the 3-10 MeV band (Zhang Collmar 2007) is shown in the sky region, noted with its 1, 2, and 3 positional uncertainty by the green lines. 4U 1036–56 is detected by JEM-X at 3-20 keV at a significance of 4 (combining all data from JEM–X1 and JEM–X2), with an average intensity of counts/cm2/s. The JEM–X mosaic image of this sky area is shown in Figure 1 (right panel).
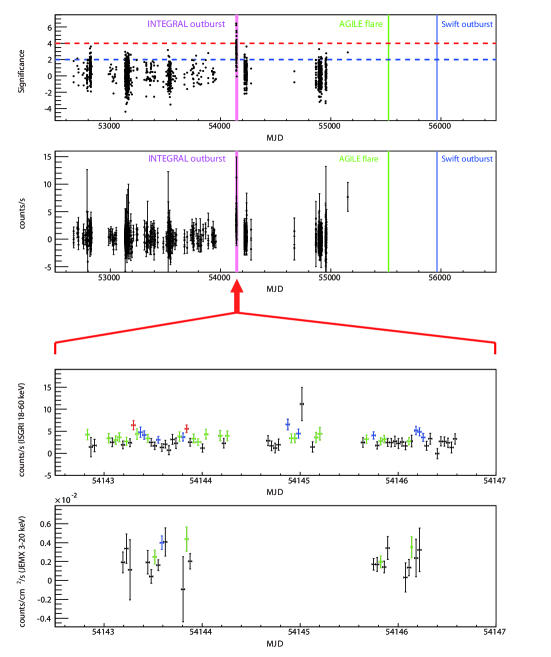
We investigated the IBIS/ISGRI long-term lightcurve of 4U 1036–56 on the ScW timescale in the 18-60 keV band, see Figure 2. During most of the time, 4U 1036–56 is not significantly detected by IBIS/ISGRI at the ScW level, its significance being below 2 (dotted blue line in Figure 2, upper panel). However, 12 ScWs have a significance larger than 4 and all of them are located in a period of about 5 days, between MJD 54142 (2007 Feb. 11) and MJD 54147 (2007 Feb. 16), which is highlighted, labeled, and zoomed in Figure 2. Hereafter, we refer to this period as the INTEGRAL outburst.
The recent outburst observed by Swift (Krim et al. 2012) is also marked and labeled in Figure 2. There is no simultaneous IBIS/ISGRI observation by INTEGRAL. The time of MeV flare from the transient -ray source AGL J1037-5708 is noted in Figure 2 too. This period also lacks simultaneous observations by INTEGRAL.
Finally, we have also inspected the Swift/BAT survey lightcurve. In 19.4 Ms, 4U 1036–56 is detected with 8.2 only (derived from the daily binned lightcurve). The average flux is (3.03 counts s-1, in the 14-195 keV band. The significances of the daily lightcurve are Gaussian-distributed, with a mean value of 0.172 and a deviation (1 ) of 1.17. Under this distribution and considering the 1775 points forming the daily lightcurve, there should be less than one observation with a single trial significance larger than 4. However, several such are discovered and they located at MJD 54144, MJD 54148, right at the INTEGRAL outburst period, and at MJD 54445, MJD 54499, MJD 54501, and MJD 54890. Since Swift/BAT is not as sensitive as IBIS/ISGRI, the lightcurve is not appropriate for further analysis.
3.1 INTEGRAL outburst and hard-X-ray quiescence
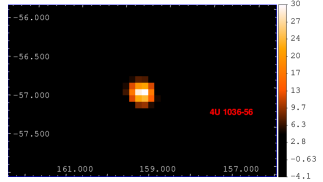
An outburst at MJD 54144 is significantly detected by IBIS/ISGRI having a significance of 30.4 and an average intensity of 2.5890.085 counts s-1 in the 18–60 keV band, over a 199 ks exposure (1/22 of the total exposure on the source). The JEM–X detection in the outburst period is significantly made at 10.1 with an average intensity of counts/cm2/s in the 3–20 keV band. Out of the outburst period, 4U 1036–56 is detected by IBIS/ISGRI only with a significance of 5.7 under a total exposure time of 4.4 Ms in the 18–60 keV band. The average flux is 0.0940.018 counts s-1 in the 18–60 keV band (27 times dimmer than in outburst). JEM–X does not detect 4U 1036–56 during quiescence, yielding only 2.58 in the 3-20 keV, under a total exposure of 0.99 Ms. The mosaic images of the outburst and the quiescent period is show in Figure 3.
In Figure 2 we show the zoomed lightcurve of the INTEGRAL outburst from IBIS/ISGRI and JEM–X. The counts rate are extracted from the position of the source in individual images on the ScW time–scale. Red, blue, green and black points stand for ScWs with significance above 5 , between 4–5 , between 3–4 and below 3 , respectively. A constant fit to JEM–X lightcurve yields an average flux of 0.204 0.019 counts/cm2/ s and a reduced of 1.3 (21 D.O.F). Also, a constant fit to IBIS/ISGRI lightcurve along the outburst yields an average flux of 2.98 0.12 counts s-1 and a reduced of 1.5 (70 D.O.F). Both the JEM–X and IBIS/ISGRI lightcurve does not hint for variability (less than 3 sigma), probably due to the large error bars.
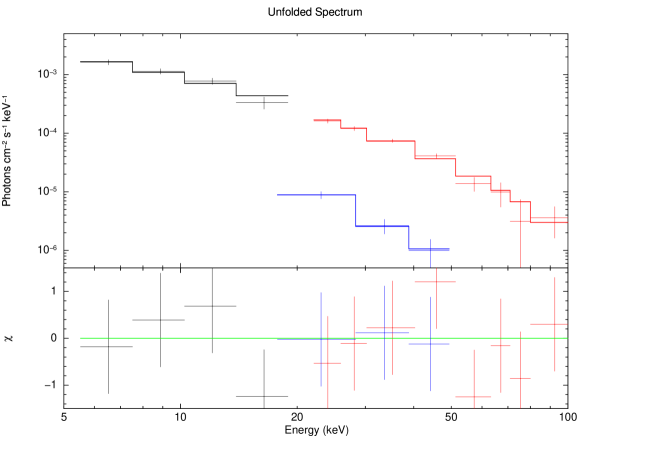
Based on the significant detection of INTEGRAL outburst, we could extract an energy spectrum both from JEM–X and IBIS/ISGRI and perform a simultaneous spectral analysis (see Figure 4). We use an absorbed blackbody, an absorbed powerlaw, and an absorbed cutoff powerlaw model to fit the combined JEM–X and IBIS/ISGRI energy spectrum. The hydrogen column density is fixed to 3.36 cm-2 following the value we derived from the Swift observation of the 2012 outburst (see next section for detail). We have found that only an absorbed cutoff powerlaw model could yield an acceptable fit. Its reduced is 0.80 (8) compared with 8.587 (9) and 3.555 (9) for absorbed blackbody and power law, respectively. According to an F-test, the probability of refusing the cutoff to a simple power-law is 4.78 , corresponding to a significance of 3.5 . The result of the fitting parameters are shown in Table 2. Based on the spectrum parameters of the INTEGRAL outburst and assuming a source distance of 5 kpc (Motch et al. 1997), the luminosity derived in 2–10 keV band is erg s-1.
| Period | Hydrogen | Photon | Cutoff | Blackbody | Unabsorbed Flux | Reduced (D.O.F) |
|---|---|---|---|---|---|---|
| column density | Index | Energy | temperature | ( erg cm-2 s-1) | ||
| cm-2 | (keV) | (keV) | ||||
| INTEGRAL | ||||||
| (18–60 keV) | ||||||
| outburst | 3.36 (fixed) | 1.12 | 26.49 | — | 2.09 | 0.80 (8) |
| quiescence | — | 3.14 | — | — | 0.058 | 0.03 (1) |
| Swift | ||||||
| (2–10 keV) | ||||||
| PL | 3.36 | 1.08 | — | — | 0.868 | 0.699 (34) |
| BB | 1.41 | — | — | 1.85 | 0.698 | 0.617 (34) |
As a result of the low significance of JEM–X detection corresponding to the out-of-outburst period, we could not extract a meaningful energy spectrum or lightcurve. We extracted the spectrum from IBIS/ISGRI in large energy bins directly from mosaic images. The counts rate is low but due to the long exposure time, there are enough counts accumulated to allow for a statistics fitting. Because of the limited energy bins and the low statistics, a simple power law is fitted to the spectrum (Figure 4, lower blue line). Details are given in Table 2. Since there is only 1 degree of freedom in the spectral fitting, the fitting is not good and results are only indicative. Despite the obvious caveats of the spectrum determination, the derived flux of 4U 1036–56 when in quiescence is times lower than in the outburst. This is consistent with the dynamic range of derived from count rate (18–60 keV). Since 4U 1036–56 is quite weak during the quiescent period, this is very likely the reason why the source was not reported in the second IBIS catalogue (Bird et al. 2006). On the contrary, the source was listed in the subsequent third and fourth IBIS catalogues (Bird et al. 2007, 2010) with a similar 18–60 keV average flux.
3.2 Swift outburst
On MJD 55960 (2012 Feb. 3) an outburst from 4U 1036–56 was caught by Swift/BAT (Krimm et al 2012). 4U 1036–56 was detected with a rate of 0.0040 0.0008 counts s-1 cm-2 (20 mCrab) in the 15–50 keV at the early state of the out burst. The peak was reached on 2012 Feb. 6 with a flux of 0.0067 0.0019 counts s-1 cm-2 (30 mCrab). The detection of 4U 1036–56 went on until Feb. 13 (MJD 55970), but afterwards 4U 1036–56 went undetected (1 upper limit of 0.001 counts sec-1cm-2). This outburst lasted for about 10 days. The Swift/XRT observation was performed on 2012 Feb. 17. We have carried out spectral and timing analysis of Swift outburst. The spectrum in 0.3–10 keV could be well fitted by an absorbed powerlaw or an absorbed blackbody. Fitting parameters are shown in Table 2 and are consistent with the spectral results of Krimm et al. (2012). Also, assuming a source distance of 5 kpc (Motch et al. 1997), the luminosity derived for the Swift outburst in the 2–10 keV band is about 2.60 erg s-1.
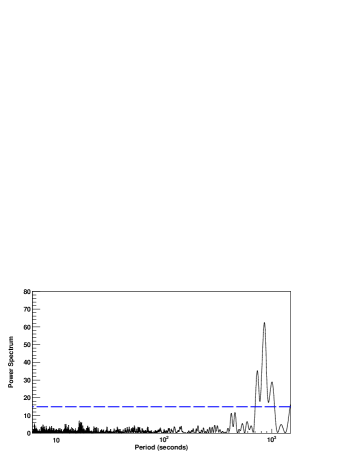
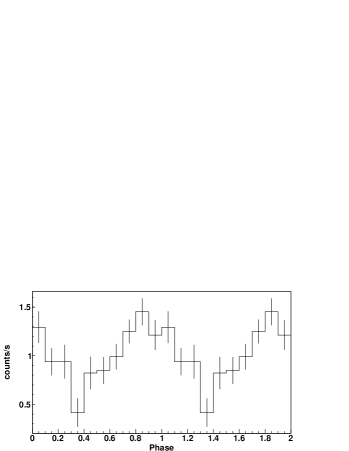
We have also carried out timing analysis of Swift outburst. A 50 s-binned lightcurve of 4U 1036–56 in the 0.3-10 keV band is shown in Figure 5. The flux shows variability that matches the pulse period. To search for a periodic signal in the lightcurve data, we generated the power spectrum. A significant signal is detected at 854.754.39 s (1 errors), beyond the white and the red noise (Figure 5, middle panel; since the red–noise is below the white–noise component, only the white–noise is shown). The derived pulse period is consistent with the 854.3 seconds period determined by the XMM-Newton observation (La Palombara et al. 2009). The relatively large error of pulse period and a wide peak seen in the power spectrum may be due to the limited pulse cycles (only about 4) covered in lightcurve, which lead to uncertainties. We fold the lightcurve at the 854.75 seconds pulse period and derived the pulse profile (Figure 5, lower panel). Phase zero is arbitrarily taken as the starting time of lightcurve. The pulsation exhibits a single peak profile, similar with the pulse profile in Reig & Roche (1999) and La Palombara et al (2009). Fitting a sinusoidal function to the pulse profile yielding a pulse fraction (ratio of sinusoidal amplitude to mean count rate) of 36.26.7 (Figure 5, lower panel).

4 Discussion
In this paper we have reported on INTEGRAL and Swift observations of 4U 1036–56. We have found that 4U 1036–56 is a weak hard X-ray source spending most of the time in a quiescent state with an average flux of 5.8 erg cm-2 s-1 (18–60 keV). Occasionally, we have seen, 4U 1036–56 may exhibit outbursts which last for several days. The flux in the outburst we analyzed reached 2.09 erg cm-2 s-1 (18-60 keV) band, implying a dynamical range of .
4U 1036–56 is the only hard X-ray source in the uncertainty contour of the -ray transients AGL J1037-5708, as well as on the admittedly worse-localized GRO J1036–55. AGL J1037-5708 was discovered on 2010–11–27 during a flare lasting for 3 days (Bulgarelli et al. 2010). The positional coincidence as well as the variability timescales make it possible to entertain the hypothesis that the high-energy transients and 4U 1036–56 are related. The possible association between a binary and an AGILE transient, under the weight of similar, exploratory arguments has been mentioned before (see Table 1 and references therein). Some of the suggested counterparts for the low number of transients found are SFXTs. These are characterized by faster X-ray flares ( hours) and larger dynamical ranges () than the ones found for 4U 1036–56.
Several authors proposed that it is theoretically feasible that HMXBs produce -ray emission during periods of X-ray activity induced by accretion (see, e.g., Bednarek 2009 for a leptonic and Romero et al. 2001 and Orellana et al. 2007 for a hadronic model). The latter has been put to the test by observations of the Be/pulsar binary 1A 0535+262 during a giant X-ray outburst (Acciari et al. 2011). Whereas it is beyond the scope of this paper to produce a detailed theoretical model of the source, we consider next whether it is in principle plausible that 4U 1036–56 and the AGILE flares are related. We focus here on the consideration of the leptonic model.
The idea is similar to that used for propellers or -ray binaries which might be in a flip-flop between a propeller and an ejector state (see, e.g., Bednarek 2009, Bednarek & Pabich 2011, Torres et al. 2012). The dense wind of a massive star can be partially captured by a neutron star inside a compact binary system. If the neutron star is rotating slowly, as is the case of 4U 1036–56, the matter from the stellar wind can penetrate the inner neutron star magnetosphere. This matter can be directed towards the neutron surface following magnetic lines. At some distance from the neutron star, a turbulent and magnetized transition region (a distance known as the Alfven or magnetic radius) is formed due to the balance between the magnetic pressure and the pressure of accreting matter. This region, the position of which can be computed as (see Bednarek 2009 and references therein)
| (1) |
where is the magnetic field at the neutron-star surface in units of G and is the accreted mass in units of g s-1, may provide good conditions for acceleration of particles to relativistic energies. Note that the fiducial values entirely depend on the properties of the neutron star and the orbit of the binary can easily be significantly off the chosen scales.
For accretion to occur, three conditions must be satisfied: a) the magnetic radius is inside the light cylinder , where is the neutron star period, and which imposes a lower limit on ; b) the rotational velocity of the magnetosphere at is smaller than the Keplerian velocity of the accreting matter (so no propeller is allowed); and c) the magnetic radius is also smaller than the capture radius of the matter of the stellar wind. All three conditions are met for the known parameters of 4U 1036–56. In particular, the large pulse period found secures the neutron star is in the accreting state. By equating the electron acceleration timescales with that of the losses, in particular, synchrotron losses (albeit electrons with energies lower than GeV could also be affected by significant inverse Compton losses) for the higher energy particles, one obtains the maximum Lorentz factor of the electrons as
| (2) |
where is the acceleration efficiency, a dimensionless number in units of 0.1 (which value is unknown, e.g., Aharonian et al. 2002 considered values of , Bednarek 2009 and others, used the prior scale). These electrons can emit synchrotron photons of characteristic energy Apart from the usual magnitudes of the speed of light and the mass of the electron, is the magnetic field at the position of , obtained through the dipolar formula, and is the critical magnetic field G. Relatively weak X-ray sources (low accretion) can accelerate particles to higher energies than the more powerful X-ray binaries. For the latter, tens of GeV can be considered as a safe upper limit for the maximum energy of the accelerated electrons. The precise value of maximal energies, we emphasize, depend on the several parameters describing the neutron star and the orbit. All in all, synchrotron emission can extend to the hard X-ray regime and beyond.
In a propeller case, the maximum power available for the acceleration of electrons is limited by the energy extracted from the rotating neutron star by the infalling matter, which can be estimated as (Bednarek 2009) as erg s-1, with the rotational velocity of the magnetosphere. If this would also be the case for accreting systems, the long period of 4U 1036–56 (and essentially any other neutron star in a high mass accreting binary, for which s are common) would imply too low a power to sustain typical flare fluxes. However, in accreting scenarios, given the rotational velocity of the magnetosphere is slower than the Keplerian velocity of the accreting matter, the gravitational energy and the specific angular momentum of the infalling matter flow from the latter to the neutron star, and not viceversa. This is consistent with the observation of pulsations and with the fact that the neutron star is indeed spun up. One can then consider that the maximum power available for the acceleration of electrons is a fraction of the accretion power at ; i.e.
| (3) |
If this is the case, in a low accretion rate mode, the source barely has enough power to appear as a source in MeV observations; it shows up only as X-ray / hard X-ray source as a result of the accretion process (i.e., when matter actually falls in the neutron star surface). On the contrary, hard X-ray or higher energies flares may be observable only when the accretion rate increases enough (e.g., by an increase in the mass loss rate, or accretion of a wind clump) so that the fraction of the power that can be converted into relativistic electrons at may lead to significant non-thermal luminosity. However, if the accretion rate increases enough, the maximum electron energies decreases, as shown above by Eq. (2), actually reducing the phase space in which, for instance, an AGILE source may be detected.
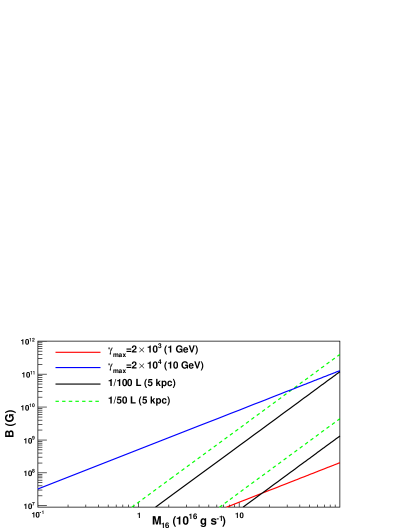
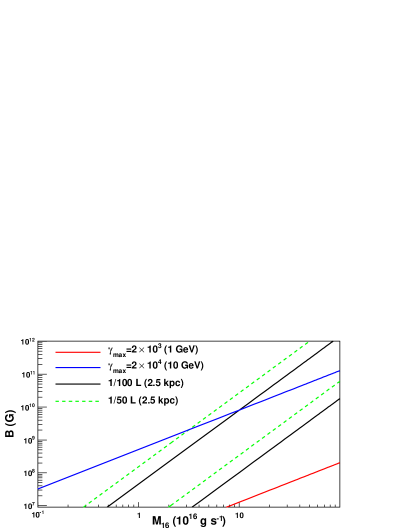
Due to the AGILE energy resolution, the MeV flux contains a large contribution from sub-100 MeV photons (see, e.g., Longo 2010). Actually, given that Fermi-LAT (optimized at 1 GeV) did not detect this and other AGILE transients, it is reasonable to suppose that these flares are sub–100 MeV ones. Nevertheless, the photon flux of the AGL J1037-5708 flare is quite intense (Bulgarelli et al. 2010). To give some examples, assuming it corresponds to an energy range from 30 to 200 MeV, and that its spectrum (which is not known) is very steep (corresponding to the fact that Fermi-LAT has not detected it) one obtains the range erg s-1, for a power-law photon spectral index of 2.5 and 4.0, respectively. This power should only be a fraction of Eq. (3); which also imposes constraints on the magnetic field and accretion rate. An example of these constraints are plotted in Figure 6, upper panel. The red and blue lines correspond to defining a equal to 1 and 10 GeV respectively; i.e., above the corresponding lines, the electrons can be accelerated beyond those energies. The parallel sets of black and green lines correspond to the constraints imposed by asking that the AGILE flare luminosity interval (as given above, depending on the spectrum) is 1/100 and 1/50 of the total power given in Eq. (3). Pending the development of detailed models, including the computation of opacities, it then seems that it is a priori possible (although not necessarily preferred) that 4U 1036–56 and the -ray transients could be related; particularly if the magnetic field is low. However, for a typical magnetic field of 1012 G the accreted mass seems prohibitively high in order to sustain the emission by the mechanism described. We should also take into account that the distance to 4U 1036–56 is quoted as 5 kpc but it can sustain an uncertainty of 25 to 50% (Motch et al. 1997). A distance of 2.5 kpc, for instance, would translate into a change of -ray luminosity between () erg s-1 for the same range of spectral slopes. This would make the possibility of an association between 4U 1036–56 and AGL J1037–5708 more plausible. This is shown in the lower panel of Figure 6.
References
- Abdo A. et al. (2009) Abdo A. et al., 2009, ApJ, 706, L56
- Abdo A. et al. (2009) Ackermann M. et al., 2012, Science, 335, 189
- Abdo A. et al. (2009) Acciari V. A., et al. 2011, ApJ 733, 96
- Abdo A. et al. (2009) Aharonian F. A., Belyanin A. A., Derishev E. V., Kocharovsky V. V., & Kocharovsky V. V. 2002, Phys. Rev. D, 66, 023005
- Abdo A. et al. (2009) Bozzo E. et al., 2011, AA, 531, 130
- Abdo A. et al. (2009) Barthelmy S. D., Barbier L. M., Cummings J. R., et al. 2005, Space Sci. Rev., 120, 143
- Abdo A. et al. (2009) Bednarek W., 2009, AA, 495, 919
- Abdo A. et al. (2009) Bednarek W. & Pabich J., 2011, MNRAS 411, 1710
- Abdo A. et al. (2009) Bird A. J. et al., 2007, ApJS, 170, 175
- Abdo A. et al. (2009) Bird A. J. et al., 2010, ApJS, 186, 1
- Abdo A. et al. (2009) Bulgarelli et al., 2009, Atel, 2017
- Abdo A. et al. (2009) Bulgarelli A. et al., 2010, Atel 3059
- Abdo A. et al. (2009) Burrows D. N., Hill J. E., Nousek J. A., et al. 2005, Space Sci. Rev., 120, 165
- Abdo A. et al. (2009) Casandjian J.-M. Grenier I.A., 2008, AA, 489, 849
- Abdo A. et al. (2009) Casares J., Ribó, M., Ribas I., Paredes J. M., Vilardell F. Negueruela I., 2012, MNRAS, 421, 1103
- Abdo A. et al. (2009) Chen A. et al. 2007, ATel, 1308
- Abdo A. et al. (2009) Forman W., Jones, C., Cominsky, L., et al. 1978, ApJS, 38, 357
- Abdo A. et al. (2009) Farrell S. A., Barret D., Skinner G. K., 2009, MNRAS, 393, 139
- Abdo A. et al. (2009) Gehrels N., Chincarini G., Giommi P., et al. 2004, ApJ, 611, 1005
- Abdo A. et al. (2009) Hinton J. A., Hofmann W., 2009, ARAA, 47, 523
- Abdo A. et al. (2009) Kong A. K. H., Charles P. A., Kuulkers E., 1998, New Astron., 3, 301
- Abdo A. et al. (2009) Krimm H. A. et al., 2012., Atel, 3936
- Abdo A. et al. (2009) Lomb N. R., 1976, ApSS, 39, 447
- Abdo A. et al. (2009) Lucarelli, F., et al. 2010, ATel, 2761
- Abdo A. et al. (2009) Markert, T. H., Laird, F. N., Clark, G. W., et al. 1979, ApJS, 39, 573
- Abdo A. et al. (2009) Masetti N., 2006, AA, 449, 1139
- Abdo A. et al. (2009) Motch C. et al., 1997, AA, 323, 853
- Abdo A. et al. (2009) Nespoli E., Fabregat J., Mennickent R. E., 2008, AA, 486, 911
- Abdo A. et al. (2009) Negueruela I., Smith D. M., Chaty S. 2005, ATel, 470
- Abdo A. et al. (2009) La Palombara N. et al., 2009, ApJ, 505, 947
- Abdo A. et al. (2009) Longo F., for the AGILE collaboration, in Proceedings of SciNeGHE 2010, Nuovo Cimento C, 34, 3, 191-196
- Abdo A. et al. (2009) Lucarelli F. et al., 2010, ATel, 2761
- Abdo A. et al. (2009) Orellana M., Romero G. E., Pellizza L. J. Vidrih S. 2007, A&A 465, 703
- Abdo A. et al. (2009) Press W. H., Rybicki G. B. 1989, ApJ, 338, 277
- Abdo A. et al. (2009) Reig P., Roche P. 1999, MNRAS, 306, 100
- Abdo A. et al. (2009) Romano P., Campana S., Chincarini G. et al., 2006, AA, 456, 917
- Abdo A. et al. (2009) Romano P., Sidoli L., Mangano V., Mereghetti S. Cusumano G., 2007, AA, 469, 5
- Abdo A. et al. (2009) Romano P., Sidoli L., Cusumano G., Vercellone S., Mangano V. Krimm, H. A. 2009, ApJ, 696, 2068
- Abdo A. et al. (2009) Romano P. et al., 2011, MNRAS, 412, 30
- Abdo A. et al. (2009) Romero G. E., et al., 2001, AA, 376, 599
- Abdo A. et al. (2009) Roming P. W. A., Kennedy T. E., Mason K. O., et al. 2005, Space Sci. Rev., 120, 95
- Abdo A. et al. (2009) Sarty G. E. et al., 2011, RAA, 11, 947
- Abdo A. et al. (2009) Scargle J. D., 1982, ApJ, 263, 835
- Abdo A. et al. (2009) Schulz M., Mudelsee M., 2002, Comput. Geosci., 28, 421
- Abdo A. et al. (2009) Sguera V. et al., 2006, ApJ, 646, 452
- Abdo A. et al. (2009) Sguera V. et al., 2009a, ApJ, 697, 1194
- Abdo A. et al. (2009) Sguera V., 2009, PoS (Integral08) 082 Proceedings of the 7th INTEGRAL Workshop, preprint (arXiv:0902.0245)
- Abdo A. et al. (2009) Sguera V. et al., 2011a, MNRAS, 417, 573
- Abdo A. et al. (2009) Sguera V., 2011b, PoS (Extremesky 2011) 011 Proceedings of The Extreme and Variable High Energy Sky. Published online at http://pos.sissa.it/cgi-bin/reader/conf.cgi?confid=147., id.11
- Abdo A. et al. (2009) Swank J., Smith, D., Markwardt, C. 2007, ATel, 997
- Abdo A. et al. (2009) Tavani M., et al. 1997, ApJ, 479, 109
- Abdo A. et al. (2009) Torres D. F., et al. 2012, ApJ 744, 106
- Abdo A. et al. (2009) Torres D. F., et al. 2001, A&A, 370, 468
- Abdo A. et al. (2009) Tomsick J. A. et al., 2009, ApJ, 701, 811
- Abdo A. et al. (2009) Vaughan, S. et al, 2006, ApJ, 638, 92
- Abdo A. et al. (2009) Warwick, R. S., Marshall, N., Fraser, G. W., et al. 1981, MNRAS, 197, 865
- Abdo A. et al. (2009) Williams S.J. et al., 2010, ApJ, 723, 93
- Abdo A. et al. (2009) Winkler C., Courvoisier T. J.-L., Di Cocco G., et al. 2003, AA, 411, L1
- Abdo A. et al. (2009) Zhang S. Collmar W., 2007, ApSS, 309, 23