On the association of the ultraluminous X-ray sources in the Antennae galaxies with young stellar clusters ††thanks: Based on observations obtained at the VLT/Melipal telescope, ESO, Paranal, Chile, in the framework of programmes 078.D-0766 and 080.D-0127.
Abstract
The nature of the ultra-luminous X-ray sources (ULXs) in the nearby galaxies is a matter of debates. One of the popular hypothesis associates them with accretion at a sub-Eddington rate on to intermediate mass black holes. Another possibility is a stellar-mass black hole in a high-mass X-ray binary accreting at super-Eddington rates. In this paper we find a highly significant association between brightest X-ray sources in the Antennae galaxies and stellar clusters. On the other hand, we show that most of the X-ray sources are located outside of these clusters. We study clusters associated with the ULXs using the ESO Very Large Telescope spectra and the Hubble Space Telescope data together with the theoretical evolutionary tracks and determine their ages to be below 6 Myr. This implies that the ULX progenitor masses certainly exceed 30 and for some objects are closer to 100 solar masses. We also estimate the ages of clusters situated close to the less luminous X-ray sources (with luminosity in the range erg s-1) and find that most of them are younger than 10 Myr, because they are surrounded by strong H emission. These findings are consistent with the idea that majority of ULXs are massive X-ray binaries that have been ejected in the process of formation of stellar clusters by a few-body encounters and at the same time rules out the proposal that most of the ULXs are intermediate mass black holes.
keywords:
accretion, accretion discs – galaxies: individual (NGC 4038/NGC4039) – galaxies: star clusters: general – X-rays: galaxies1 Introduction
Ultra-luminous X-ray sources (ULXs) are non-nuclear X-ray sources with luminosities exceeding an Eddington limit for a 10 black hole (see Feng & Soria, 2011, for a review). The most popular models for the ULXs involve either intermediate mass black holes (IMBH) with masses of or stellar-mass black holes (StMBH) accreting at highly super-Eddington rates. Both scenarios require massive donors in a close orbit (similar to SS 433, see Fabrika 2004), and the later model also requires some collimation of radiation into our line of sight (Fabrika & Mescheryakov, 2001; King et al., 2001; Poutanen et al., 2007) to explain the objects up to possibly erg s-1.
The X-ray luminosity functions in galaxies seems to have a universal powerlaw-like shape with a cut-off at luminosity of a few 1040 erg s-1 and a normalization proportional to the star formation rate (Grimm et al., 2003; Liu et al., 2006). This implies that most of the ULXs are probably a high-luminosity extension of the population of high-mass X-ray binaries.
IMBHs originating from low-metallicity Population III stars can form binary systems due to tidal captures of single stars. The expected frequency of such IMBHs is not high and does not agree with the ULX observed frequencies (Kuranov et al., 2007). Moreover, these sources should be distributed throughout the galaxy, while most of the ULXs are associated with the star-forming regions (Swartz et al., 2009). An IMBH produced in a runaway merging in a core of a young stellar cluster (Portegies Zwart et al., 2004; Freitag et al., 2006) should stay within it, because of the large IMBH mass.
On the other hand, stellar-mass black holes accreting at super-Eddington rates should be members of high-mass binaries. These objects are young and should be associated with clusters where are they born. However, they do not need to be in the cluster centres, instead they can be very effectively ejected from the clusters by few-body encounters at the initial stages of the cluster formation (Poveda et al., 1967; Heggie, 1975; Mikkola, 1983; Moeckel & Bate, 2010; Pflamm-Altenburg & Kroupa, 2010; Mapelli et al., 2011). Also the supernova explosions can eject massive binaries (Zwicky, 1957; Blaauw, 1961; Shklovskii, 1976; Woosley, 1987; Cordes & Chernoff, 1998; van den Heuvel et al., 2000), but probably with lower velocities and at a late stage of cluster evolution, when the massive stars had time to evolve.
Thus the distribution of the X-ray sources around stellar clusters as well as the cluster age can give us a clue on the nature of ULXs and on the ejection mechanism. Kaaret et al. (2004) have found that bright X-ray sources ( erg s-1) in three starburst galaxies are preferencially located near the star clusters, but not within them. In a search for optical counterparts of 44 ULXs in 26 nearby galaxies, Ptak et al. (2006) have found that 28 of them have potential optical counterparts within error circles and 10 of those have multiply counterparts. Their astrometric accuracy varied in the range 03–17 depending on the object and the method (the best accuracy was achieved for half of the galaxies which have an active nuclei in the centre).
The colliding star-forming Antennae galaxies constitute an obvious target for a detailed study of the separation between the X-ray sources and clusters, because they contain a couple of dozens bright X-ray sources (Zezas et al., 2006) and a thousand catalogued clusters (Whitmore & Schweizer, 1995). Zezas et al. (2002b) have noticed that most of the brightest X-ray sources are displaced from the neighbouring star clusters. However, their absolute astrometry has an error ( 160 pc), therefore they could not possibly measure displacements smaller than that and prove unambiguously an association between the X-ray sources and clusters. Thus the question about the association of the X-ray sources and clusters remains open.
The aim of the present paper is to determine the distances between the brightest X-ray sources and the stellar clusters in the Antennae galaxies using an accurate astrometric solution (with error ). We find significant displacement between the ULXs and the clusters as well as a highly significant association between them. We also estimate the ages of the stellar clusters. This allows us to determine the minimum masses of the ULX progenitors.
2 Observations and data reduction
2.1 X-ray source sample
The X-ray sources in the Antennae galaxies, NGC 4038/NGC 4039 (see Fig. 1), were surveyed by Zezas et al. (2002a, 2006) and Swartz et al. (2004). From the catalogue of Zezas et al. (2002a) we have selected sources situated in the main bodies of the galaxies to reduce the chance that they are background or foreground sources. We restrict the sample to those having more than 45 counts, which guaranties high accuracy of the coordinates. We then further down select the sources, which have average absorption corrected 0.1–10 keV luminosities in excess of erg s-1 as estimated by Zezas et al. (2006) assuming a power-law spectrum with photon index and the Galactic line-of-sight hydrogen column density (Stark et al., 1992). These luminosities were recomputed for the distance to the Antennae galaxies of 22 Mpc as recommended by Schweizer et al. (2008). This distance gives the scale of 107 pc/arcsec and the distance modulus .
| Objecta | RA (J2000) | Dec (J2000) | Offsetc | Clusterd | |
|---|---|---|---|---|---|
| ULX sample | |||||
| 11 | 12:01:51.33 | 18:52:24.9 | 39.90 | 0.15 | 253 |
| 1.71 | 244 | ||||
| 1.76 | 260 | ||||
| 16 | 12:01:52.09 | 18:51:33.2 | 39.92 | 1.26 | 706 |
| 1.44 | 709 | ||||
| 1.52 | 711 | ||||
| 1.56 | 707 | ||||
| 1.68 | 708 | ||||
| 29 | 12:01:53.50 | 18:53:10.5 | 39.57 | 0.30 | 49 |
| 31 | 12:01:54.28 | 18:52:01.4 | 39.34 | 2.50 | 498 |
| 2.61 | 514 | ||||
| 42 | 12:01:55.66 | 18:52:14.6 | 39.67 | 0.64 | 386 |
| 0.67 | 374 | ||||
| 0.90 | 388 | ||||
| 1.12 | 370 | ||||
| 1.13 | 368 | ||||
| 1.16 | 362 | ||||
| 44 | 12:01:56.44 | 18 51 57.4 | 39.86 | 3.26 | 518 |
| sub-ULX sample | |||||
| 5 | 12:01:50.48 | 18:52:15.4 | 38.57 | 1.42 | 387 |
| 1.48 | 381 | ||||
| 1.54 | 377 | ||||
| 6 | 12:01:50.52 | 18:52:04.2 | 38.59 | 0.36 | 491 |
| 0.79 | 487 | ||||
| 1.08 | 483 | ||||
| 1.13 | 495 | ||||
| 1.36 | 485 | ||||
| 1.44 | 479 | ||||
| 1.67 | 481 | ||||
| 13 | 12:01:51.63 | 18:52:31.3 | 39.09 | 2.02 | 206 |
| 18 | 12:01:52.40 | 18:52:06.3 | 39.28 | 1.92 | – |
| 19 | 12:01:52.43 | 18:53:13.7 | 38.91 | 1.07 | – |
| 20 | 12:01:52.75 | 18:51:29.5 | 38.48 | 0.30 | 720 |
| 0.52 | 717 | ||||
| 24 | 12:01:53.00 | 18:52:02.6 | 38.80 | 0.10 | 500 |
| 0.37 | 501 | ||||
| 0.72 | 503 | ||||
| 25 | 12:01:53.01 | 18:52:09.1 | 38.44 | 0.67 | 450 |
| 0.88 | 442 | ||||
| 1.40 | 451 | ||||
| 32 | 12:01:54.36 | 18:52:09.8 | 38.96 | 1.44 | 443 |
| 1.66 | 454 | ||||
| 1.92 | 453 | ||||
| 33 | 12:01:54.51 | 18:53:06.3 | 38.73 | 0.36 | 75 |
| 0.67 | 77 | ||||
| 1.25 | 65 | ||||
| 34 | 12:01:54.56 | 18:53:02.7 | 38.90 | 0.63 | 90 |
| 0.93 | 89 | ||||
| 1.23 | 87 | ||||
| 1.59 | 88 | ||||
| 1.84 | 86 | ||||
| 35 | 12:01:54.78 | 18:52:51.9 | 39.09 | 0.57 | 115 |
| 0.83 | – | ||||
| 1.95 | 109 | ||||
| 41 | 12:01:55.49 | 18:52:35.4 | 38.68 | 2.24 | 161 |
| 46 | 12:01:56.65 | 18:52:00.4 | 38.45 | 2.33 | 507 |
aSource number according to Zezas et al. (2002a). bLogarithm of luminosity in erg s-1 in the range 0.1–10 keV (Zezas et al., 2006) corrected for absorption and recomputed for the distance of 22 Mpc. cOffset (in arcsec; here 1″=107 pc) between the X-ray source and the stellar cluster. dCluster ID from the WS95 catalogue if available.
We further remove from the sample source X-37, which is a background quasar (Clark et al., 2005) and will be further used for accurate astrometry. This leaves us with 20 sources (see Table 1). Among these sources, X-24 and X-29 are situated very close to the northern and southern nuclei, with the offsets from the bright 2MASS nuclei of 16 and 03, respectively. Thus, with the worse astrometry, we could have assumed them to be the black holes in the galactic centers. However, this is not the case. There are no indications of any AGN activity in the nuclei (Zezas et al., 2002b; Ueda et al., 2012). Six sources with luminosities erg s-1 (Zezas et al., 2002a, 2006; Swartz et al., 2004) may be considered as bona fide ULXs (the “ULX sample”). We call other sources with luminosities in the range erg s-1 the “sub-ULX sample”. All the sources are located in the main bodies of the galaxies, however, a few sources (X-18, X-19) are located in the very obscured dusty regions.
2.2 Optical observations
For spectral study we have selected regions around four ULX X-11, 16, 31, 42 and also X-35. As X-32 is situated very close to X-31, it was also studied. We did not observe X-44, because it lies at the outskirts of the galaxies and we did not originally expect bright optical sources around it. Source X-29 was not observed, because it seemed to be associated with the nucleus of NGC 4039 (we, however, keep it in the ULX sample). We obtained two data sets on 2007 February and 2008 March with the Visible Multi-Object Spectrograph (VIMOS) Integral Field Unit (IFU) at the 8.2m Very Large Telescope Melipal at ESO’s Paranal Observatory in Chile.
The VIMOS IFU consists of 1600 (4040) fibres coupled to microlenses and operates with four EEV44 CCD detectors yielding four quadrants (Zanichelli et al., 2005). The field-of-view of 135135 was covered by 1600 spatial pixels (spaxels) at a spatial sampling of 033 per spaxel. Two different grisms were used, high resolution blue (0.51 Å/pixel), covering the wavelength range of 4150–6200 ÅÅ and high resolution orange (0.60 Å/pixel) covering the range of 5250–7400 ÅÅ. The spectral resolution measured using the sky emission lines is 1.86 and 1.88 Å for the blue and orange grisms, respectively. We have taken spectral images of each target with exposure times of 6900 s in the blue and 4900 s in the red regions.
For each VIMOS quadrant all the spectra were traced, identified, bias subtracted, flat field corrected, corrected for relative fiber transmission, and wavelength calibrated using the routines of the ESO Recipe EXecution pipeline (ESOrex).111ESOrex is developed and maintained by the European Southern Observatory. We have checked the fiber traces in the images and corrected them, when it was necessary, using bright night sky and nebular lines. Cosmic rays and bad pixels were identified and cleaned using standard IRAF 222IRAF is distributed by the National Optical Astronomy Observatory, which is operated by the Association of Universities for Research in Astronomy (AURA) under cooperative agreement with the National Science Foundation. routines. Finally, the intensity of the night-sky emission line [O i] was used to correct for the different relative transmission of the VIMOS quadrants.
The processed spectra were organized in data cubes using the tabulated correspondence between each fiber and its position in the field of view. The spectra were co-added after correcting for the position offset. The accuracy of the offset is 0.2 pixel (007). This slight deterioration of the spatial resolution does not affect the results.
We use also archival imaging observations taken with the Hubble Space Telescope (HST). The ACS-WFC images taken in F435W, F550M and F814W filters on 2005 July 21 and images in FR656N filter taken on 2005 June 29 were used for astrometry and for illustrations (Figs 1 and 2). The WFPC2 images taken on 1996 January 20 in F336W, F439W, F555W and F814W filters (Whitmore et al., 1999) were used for photometry of the clusters associated with the ULXs. The WFPC2 images were reduced in a standard way with hstphot (Dolphin, 2000). The same routine was used to measure all point-like sources in the images and to calibrate them in the standard , , and magnitudes (Johnson, 1966). Using standard IRAF tools we carried out aperture photometry of stellar clusters presumably associated with the ULXs. Corrections of the WFPC2 magnitudes for interstellar extinction were made according to Holtzman et al. (1995).
2.3 Astrometry of X-ray sources and stellar clusters
To have an accurate absolute astrometry in optical images we used the archival r-band images taken with the MegaCam at the Canada-France-Hawaii Telescope (CFHT). For an astrometric solution, we used 15 point-like 2MASS (Cutri et al., 2003) sources surrounding the Antennae galaxies in field of the CFHT images. The accuracy of coordinates (rms) is better than 015. In the next step we transfered this solution from CFHT to ACS images of the galaxies with 22 common point-like objects, the accuracy of this transfer is much better than 015. The same has been done with the WFPC2 images of the galaxies. We used a routine described by Gooch (1997). Our final accuracy in absolute astrometry of the optical HST images is the same as that in 2MASS, i.e. about 015.
The brightest 12 X-ray sources have 100 net source counts and the rest of the sources still have 45 cts in individual Chandra images. They are point-like sources and the internal accuracy of their coordinates is expected to be below 015 (Swartz et al., 2004). For the ULX-sample, we have averaged the source coordinates presented in surveys by Zezas et al. (2002a) and Swartz et al. (2004). The ULX coordinate difference in these two surveys is below 02 with one exception for X-35 where it is 03. For the sub-ULX-sample we adopt the coordinates from Zezas et al. (2002a). The final internal accuracy of the X-ray coordinates is better than 02. To determine the offset between the X-ray and optical images we used a background quasar (Clark et al., 2005), the source X-37 in the Antennae galaxies, which is a very bright point-like source both in the X-ray and optical images. The coordinates of the X-ray sources corrected for this offset are presented in Table 1. The final coordinate accuracy for the HST/ACS – Chandra solution is 02–025, depending on the brightness of the source.
Whitmore & Schweizer (1995, hereafter WS95) present a catalogue of stellar clusters obtained using HST/WFPC1 with the coordinates relative to the source N442. We recomputed the coordinates of all the clusters using our solution. For all clusters in the vicinity of X-ray sources (see Table 1) we have obtained independent measurements of the coordinates using ACS images and found the rms displacement from the corrected WS95 values of 012. This allows us to use the whole WS95 catalogue with the corrected coordinates for the statistical studies and modelling of the distribution of the offsets between X-ray sources and clusters.
3 Association with clusters
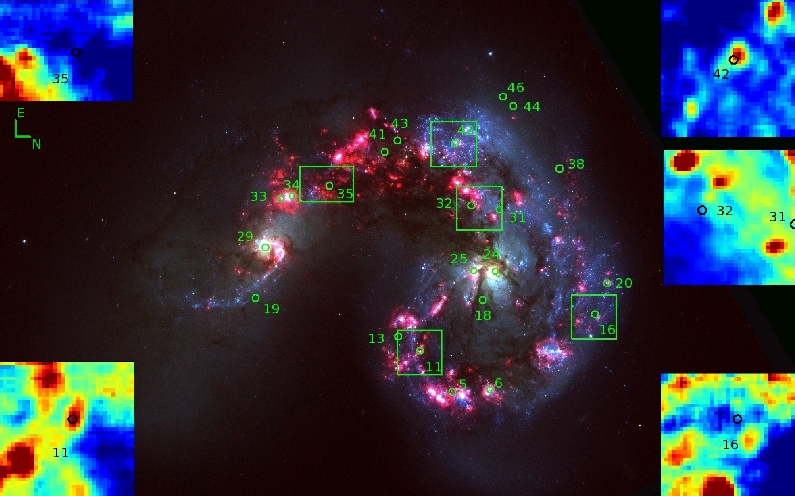
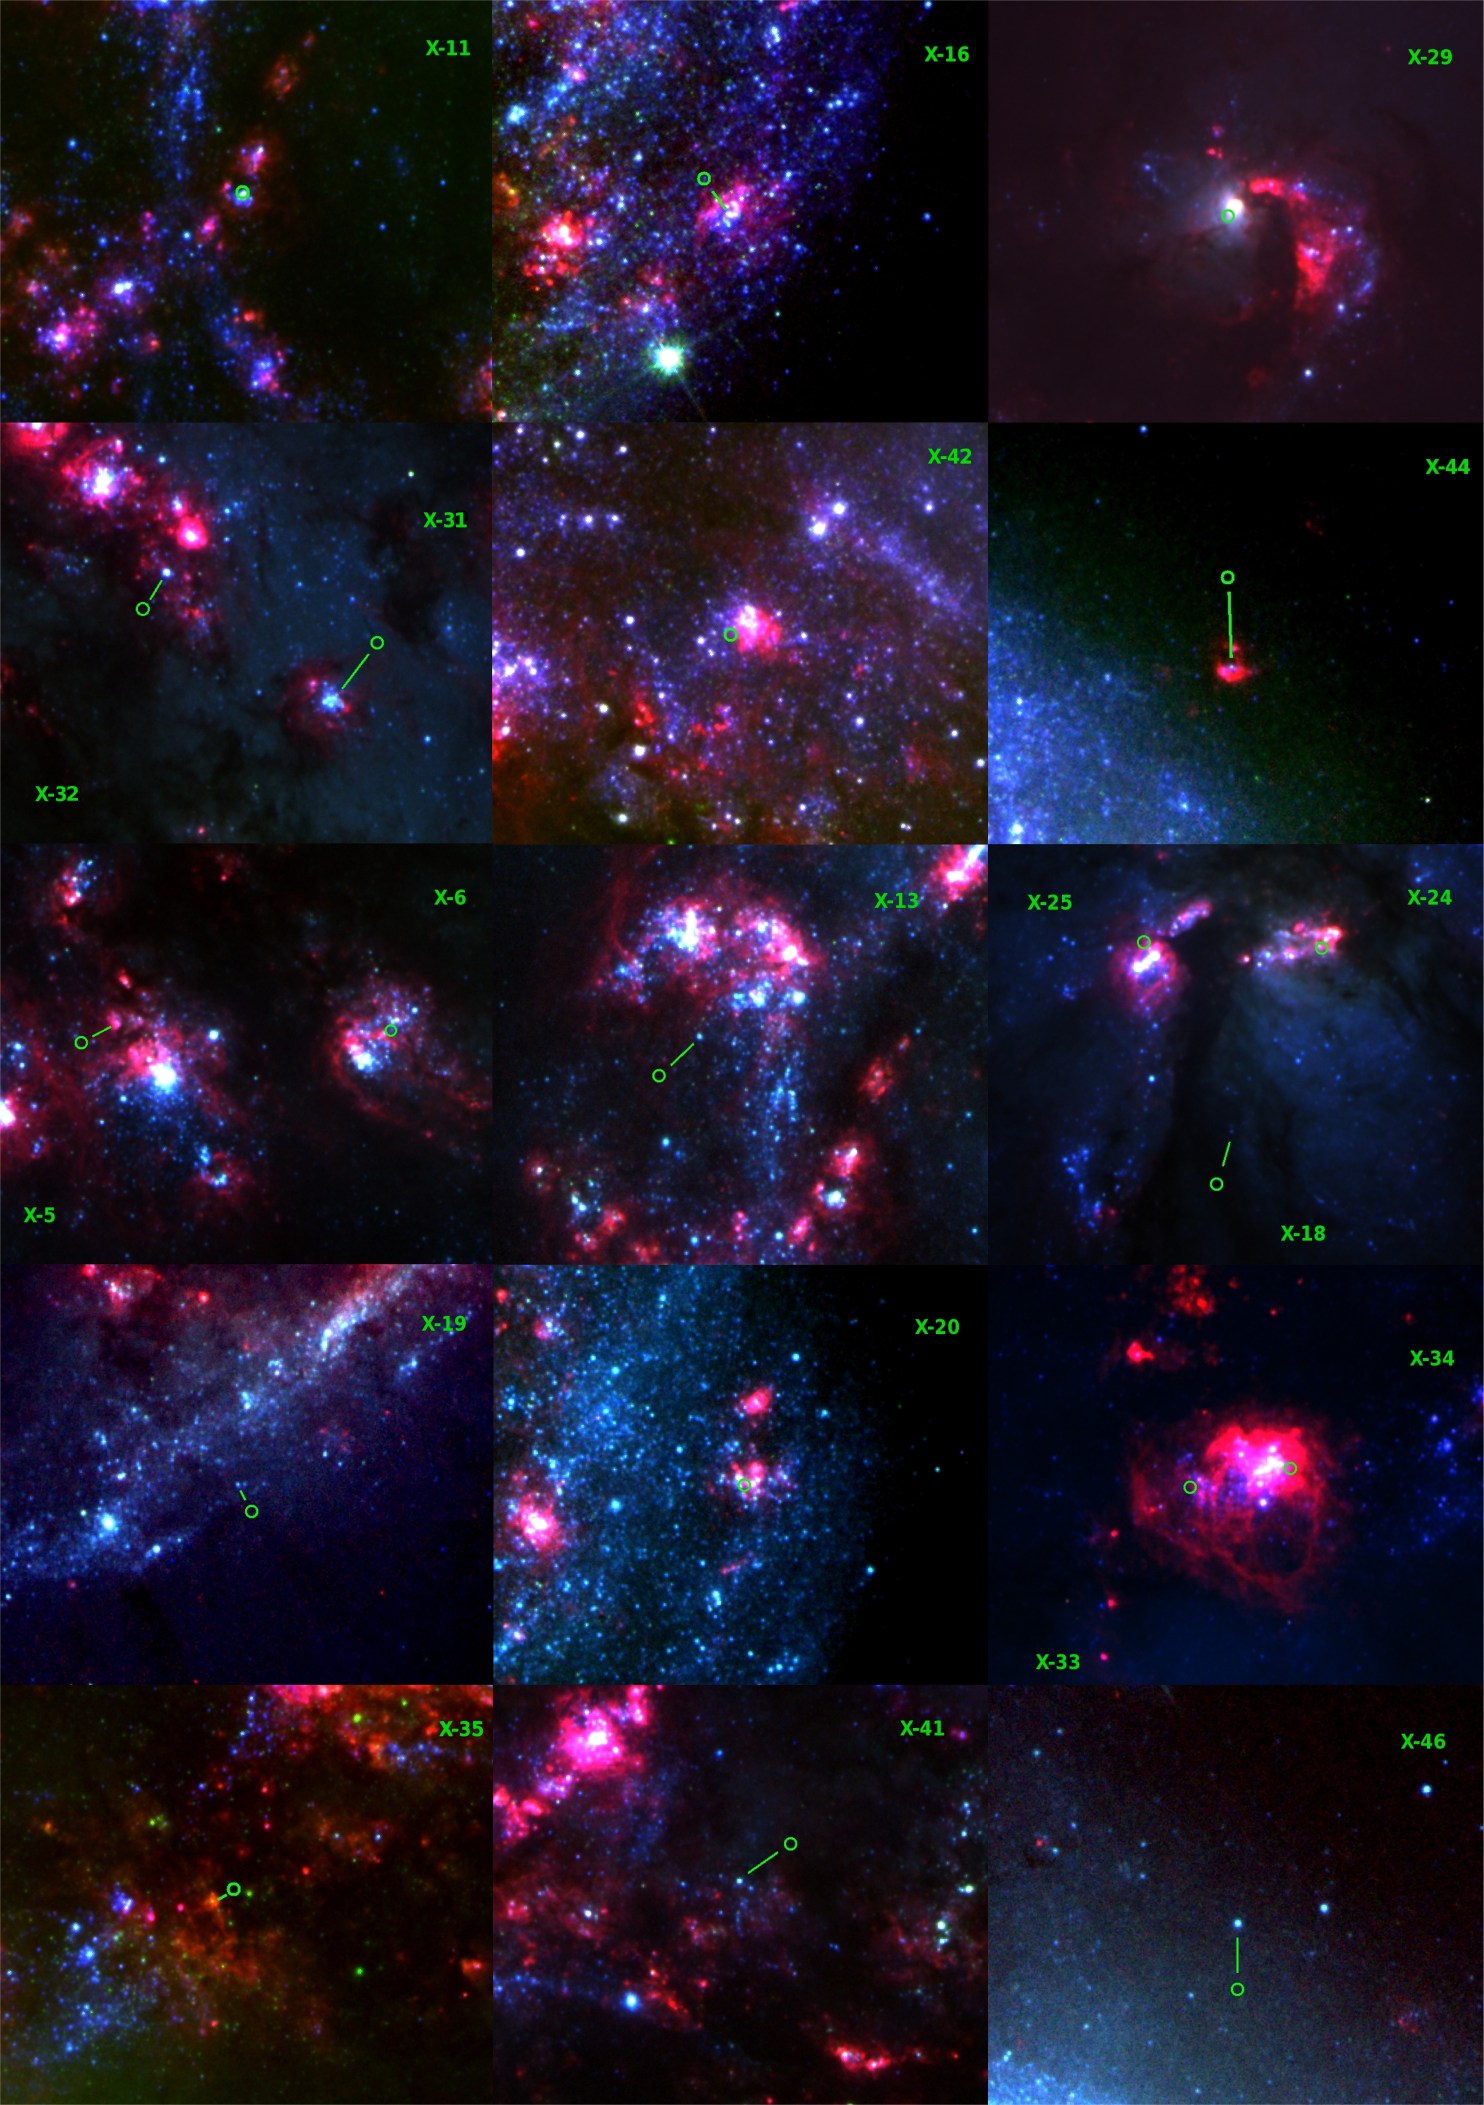
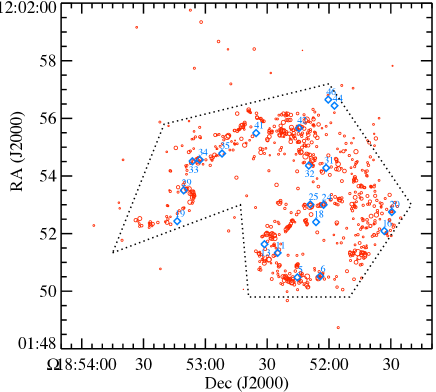
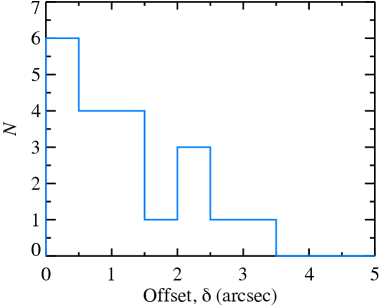
In Fig. 1 we show rgb image of the Antennae galaxies with the brightest X-ray sources. In Fig. 2 we show enlarged rgb images around the X-ray sources. The positions of stellar clusters from WS95 catalogue together with the X-ray sources from Table 1 are shown in Fig. 3. A remarkable property of the X-ray sources is they are located close to young stellar clusters and complexes. Only a few sources (X-11, X-20, X-24, X-29) can be claimed to coincide with the position of stellar clusters (within 03), for other sources the distances to the clusters is above the astrometric accuracy. In Fig. 4 we show distributions of the offsets between the positions of the X-ray sources and the nearest stellar clusters. All the sources have separation below 27 (290 pc), except X-44 (350 pc). Source X-18 is located in a heavily obscured region and X-19 is at the edge of the star formation belt, with the nearest bright WS95 clusters more that 4″way. However, for both these sources there exist much closer non-catalogued clusters (see Fig. 2).
The displacement between the X-ray source positions and optical clusters in Antennae was noticed by Zezas et al. (2002b) and discussed by Zezas & Fabbiano (2002). However, they have used the absolute astrometry of the WFPC2 images, which has an error, and considered X-ray sources to coincide with the optical sources if their separation is less than 2. Our accurate astrometry does not leave any doubts that the offsets of 05–3″are real.
| a | b | (″)c | d | e | ()f | g |
|---|---|---|---|---|---|---|
| 21.5 | 259 | 1.0 | 1.8 | 15 | 0.09 | 8 |
| 1.5 | 4.1 | 26 | 0.31 | 10 | ||
| 2.0 | 7.2 | 35 | 0.63 | 11 | ||
| 22.0 | 371 | 1.0 | 2.6 | 17 | 0.18 | 9 |
| 1.5 | 5.8 | 32 | 0.5 | 11 | ||
| 2.0 | 10.3 | 42 | 1.1 | 12 | ||
| 22.5 | 535 | 1.0 | 3.7 | 18 | 1.2 | 9 |
| 1.5 | 8.4 | 35 | 0.8 | 11 | ||
| 2.0 | 14.9 | 48 | 2.0 | 12 | ||
| 24.5 | 690 | 1.0 | 4.8 | 20 | 2.3 | 10 |
| 1.5 | 10.8 | 37 | 1.2 | 12 | ||
| 2.0 | 19.2 | 52 | 2.9 | 13 |
aCut in magnitude of the WS95 catalogue. bNumber of clusters from the WS95 catalogue brighter than . cMaximum offset. dExpectation number given by equation (1). eNumber of clusters within distance from all X-ray sources. fPoisson probability that the association between clusters and X-ray sources is random. gNumber of X-ray sources, which have at least one cluster within .
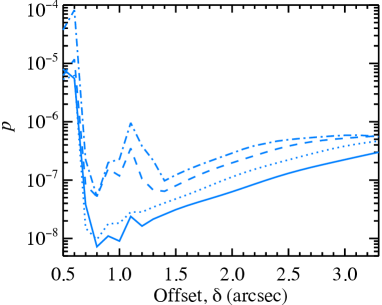
To estimate the statistical significance of the clustering of the bright X-ray sources near the stellar clusters we first use the usual two-point correlation function, counting the number of clusters from a given subset of the WS95 catalogue within an angle from each X-ray source. We then compare this number to the expectation for the null hypothesis that the X-ray sources are distributed randomly over the galaxies bodies
| (1) |
where is the number of clusters of magnitude below the cut , is the number of X-ray sources, and is the area containing stellar clusters (see Fig. 3). We introduce the measure of the signal as the probability of sampling or more hits from the Poisson distribution at expectation . This probability depends on and cuts in the stellar cluster catalogue . The null hypothesis is rejected with a very high significance for any tried and any reasonable cut (see Fig. 5 and Table 2). It reaches the minimum at the level for the correlation radius 07–15. The deepest minimum corresponding to the cuts and 22.0 indicates that the strongest correlation exists between X-ray sources and the brightest clusters. About half of the X-ray sources have at least one cluster within 1″–2″(see Table 2). Interestingly, that 15 out of 18 X-ray sources and all ULXs have nearest WS95 clusters brighter than . Besides that, practically all the clusters and cluster complexes associated with the X-ray sources (i.e. the closest WS95 clusters) are young (see Fig. 2), less than 10 Myrs, because they are surrounded by strong H emission (Leitherer et al., 1999). Because the fraction of so young clusters in the WS95 catalogue is below 30 per cent (Fall et al., 2005), the correlation between the X-ray sources and the young clusters is even stronger.
We can also check the hypothesis that the X-ray sources are distributed according to the stellar density (Rangelov et al., 2011). The stars, however, are distributed rather homogeneously over a larger area than the stellar clusters (Whitmore et al., 1999) and therefore the significance of the association would be even larger.
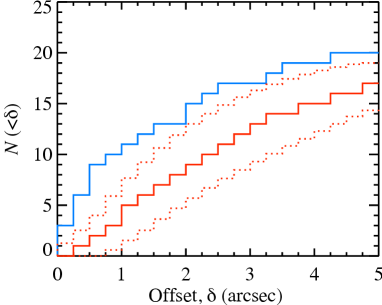
Fig. 6 shows the cumulative distributions of the offsets between the X-ray sources and stellar clusters from WS95 catalogue and those obtained from artificial X-ray source samples scattered randomly over the main body of the galaxies (limited by the dotted line in Fig. 3). We see that the observed distribution is significantly higher than the median of simulated offset distributions and even the distribution corresponding to the 90% confidence limit. Specifically, the observed distribution has about twice as much sources within 15 than the simulated one. This confirms the association between bright X-ray sources and stellar clusters.
| Objecta | Clusterb | c | d | e | f | g | Ageh | i | j | k |
|---|---|---|---|---|---|---|---|---|---|---|
| Myr | km s-1 | |||||||||
| 11 | 253 | 1.0 | 0.980.09 | 0.98 | 18.80 | 12.91 | 4.20.1 | 0.99 | – | 50 |
| 16 | 706 | 1.0 | 0.600.16 | 0.52 | 19.71 | 12.00 | 2.60.2 | 0.59 | 50 | 110 |
| 16 | 706 | 2.0 | 0.600.16 | 0.52 | 19.71 | 12.00 | 2.10.2 | 0.62 | 61 | 100 |
| 31 | 498 | 1.0 | 0.400.06 | 0.46 | 18.51 | 13.20 | 3.80.1 | 1.67 | 67 | 60 |
| 31 | 498 | 2.0 | 0.400.06 | 0.46 | 18.51 | 13.20 | 2.80.2 | 0.91 | 91 | 100 |
| 32 | 443 | 2.0 | 0.940.04 | 0.94 | 18.59 | 13.12 | 2.50.1 | 1.12 | 59 | 100 |
| 35 | – | 2.0 | 3.430.11 | 3.40 | 18.80 | 12.91 | 5.70.2 | 1.00 | 15 | 30 |
| 42 | 386 | 1.0 | 0.460.27 | 0.58 | 17.14 | 14.57 | 3.90.1 | 5.66 | 17 | 60 |
| 42 | 386 | 2.0 | 0.460.27 | 0.40 | 17.32 | 14.39 | 3.30.1 | 3.82 | 20 | 70 |
| 44 | 518 | 2.0 | – | 0.155 | 21.96 | 9.75 | 2.40.1 | 0.055 | 139 | 100 |
aSource number according to Zezas et al. (2002a). bNearest stellar clusters and their ID from the WS95 catalogue if available. cMetallicity in solar units. dMean extinction value and standard deviation determined from the VIMOS spectra in the field of pixels at the position of the cluster. eExtinction best matching the evolutionary tracks. fDereddened WFPC2 magnitude. gAbsolute magnitude for distance of 22 Mpc. hAge of the stellar cluster estimated from Fig. 7. iMass of the stellar cluster computed from the difference between the observed given in this Table and the theoretical value from Leitherer et al. (1999) at the best-fitting age and metallicity determined from Fig. 7. jThe minimum ejection velocity (not accounting for deprojection) of the X-ray source needed to reach the required displacement from the cluster at a given age. kMinimum mass of the ULX progenitor in obtained from maximum possible age of the cluster using the Geneva group stellar evolution models as described in Starburst99.
4 Cluster ages and the masses of ULX progenitors
The VIMOS images (Fig. 1) cover practically all the ULX sources in the Antenna galaxies. We first study the spectra of the nebulae emission in the VIMOS fields around the clusters (see Table 1 and Figs 9–13). We determine the H/H flux ratios and compare them to the theoretical value of 2.87 corresponding to the case B of gaseous nebulae (which is the same to within 10 per cent in a wide range of temperatures and densities, see Osterbrock & Ferland 2006). This allows us to find the extinction values all over the fields (see Table 1 and the extinction panels in Figs 9–13). The measured close the X-ray sources are in perfect agreement with the independent estimates from the hydrogen column density (Predehl & Schmitt, 1995) obtained from the Chandra spectra (see Table 5 in Zezas et al., 2002a). For cluster N518 next to X-44 we do not have VIMOS images and we use the Galactic extinction , which is the minimum possible value and is close to the maximum value consistent with the evolutionary tracks (see below).
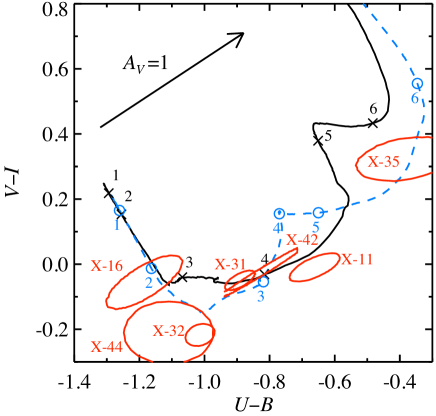
The dereddened , , and magnitudes for the clusters were obtained from the WFPC2 images as described in Sect. 2.2. On Fig. 7, we show the colour-colour and diagram with the error contours for each cluster, which are elongated along the vector . These colours are then compared to the cluster evolution tracks from the Geneva group computed using Starburst99 code333Starburst99 is available at http://www.stsci.edu/science/starburst99/ (Leitherer et al., 1999; Vázquez & Leitherer, 2005). We consider the instantaneous starburst model with the Kroupa (2001) initial mass function (IMF) extending to for solar and double-solar metallicities (see Fig. 7). The cluster next to X-11 is consistent with the solar metallicity and those next to X-32, 35 and X-44 with only double-solar metallicity. On the other hand, the colours of the clusters next to X-16, 31 and 42 can be described by any metallicity from solar to double-solar, which is consistent with the range of metallicities from to found by Bastian et al. (2009) in their study of 16 young clusters in the Antennae. For the cluster next to X-44 we took the Galactic extinction and increasing the value of would shift the cluster even further away from the theoretical tracks to the lower-left corner of the colour-colour diagram.
The overlap at the colour-colour diagram between the cluster error contours and the evolutionary tracks gives us an estimate of the cluster ages. We find that all clusters associated with the ULXs are extremely young with the age of less than 6 Myr (see Table 3).444For the cluster next to X-35 there is another solution with the age of 20 Myr, which we reject, because of the presence of the strong H emission. For the assumed metallicity, an improved estimate for can be obtained from the same overlap. Comparing thus obtained to the theoretical absolute magnitude from the Starburst99 models (for a cluster of mass ), we find the cluster masses using equation (see Table 3), which vary between and . For the clusters which are consistent with both metallicities, the difference in the ages gives us an estimate of the systematic error.
In the X-31/X-32 VIMOS image (see Fig. 11) there are also two bright stellar complexes N455 and N418 previously studied by Bastian et al. (2006) (named 5 and 6 there) and showing spectra with strong Wolf-Rayet emission features. This confirms the young age ( Myr) of the clusters in that region. In Fig. 8 we present VIMOS spectra of the clusters studied (together with spectra of the complexes N 5 and N 6) demonstrating very strong hydrogen, [O iii], [Ar iii] and other nebular lines, which demand strong photoionizing continua of the clusters and confirm their young age. However, the cluster age estimates from the photometric data are notably more accurate than those obtained from the spectroscopy. We note that the independent evaluation of from the spectra break the known –age degeneracy (see e.g. Bastian et al., 2009).
The clear association of the X-ray sources both in the ULX and sub-ULX samples with the young star clusters in the Antennae galaxies indicates that these sources originate from the massive binaries ejected from the star clusters. The extremely young ages of the clusters associated with the ULXs put the lower limit on the mass of their progenitor stars, which varies between 30 and 110 according to the Geneva stellar evolution models used in Leitherer et al. (1999) (see Table 3), indicating that all studied ULXs in the Antennae galaxies are associated with the most massive stars.
The distribution of displacements and the cluster age allows us to give an estimate for the minimum ejection velocity of the sources from the clusters. Among the ULX sample (Table 3) only one source X-11 resides in a cluster. Other six sources have an average ejection velocity (accounting for deprojection, which gives a factor of ) of 77 km s-1. As X-44 is situated rather far away from the suspected parent cluster and it requires a very large ejection velocity (for a given small cluster mass), their association is probably spurious.
5 Discussion
The correlation between X-ray source positions and stellar clusters was already noticed by Kaaret et al. (2004) for three starburst galaxies M 82, NGC 1569 and NGC 5253 (which lie closer than 4 Mpc). In spite of their astrometric accuracy of 1″, the proximity of the galaxies permitted them also to find the displacement between X-ray sources (with X-ray luminosities less than erg s-1) and bright clusters. They found that brighter X-ray sources preferentially occur closer to the clusters, and no sources at luminosities above erg s-1 are displaced by more than 200 pc. The lower luminosity sources are mostly low-mass X-ray binaries, which totally lose connection to their parent clusters because of their large ages or because the clusters disappear on that time frame. In their study only one galaxy (M 82) has sources brighter than erg s-1 and only one source was brighter than erg s-1.
Recently Rangelov et al. (2011) found that bright sources (with luminosities – erg s-1) in NGC 4449 are located close to the young stellar clusters with the age less than 6–8 Myr. This association was, however, only marginal, when they assumed that X-ray sources follow the light of the galaxy. It is worth mentioning that about half of the X-ray sources in NGC 4449 are probably low-mass X-ray binaries and the correlation between the remaining candidate high-mass X-ray binaries and stellar clusters is significant.
The Antennae galaxies have a relatively high star-formation rate and most of bright X-ray sources are probably high-mass X-ray binaries. Clark et al. (2011) identified there 38 infrared counterparts within the 10 error boxes of 120 X-ray sources from the Zezas et al. (2006) catalogue. The majority of these IR sources are star clusters. For ten of them they were able to measure masses of about and ages, which lie in a very narrow range around yr. Their study, however, was limited to the immediate surrounding of the X-ray sources and therefore it missed many clusters that still could be the birthplaces of the X-ray sources. The recent study by Rangelov et al. (2012) showed that 22 out of 82 X-ray sources from the same catalogue have star clusters as optical counterparts within 11 error box.555Their astrometry has 1 error of 054, but we note that the difference between the HST and Chandra coordinates of the QSO X-37 is certainly much smaller than quoted value of the mean shift of 25175 obtained by Rangelov et al. (2012). They have measured the age of these clusters and the extinction using and H magnitudes finding that 14 sources are situated next to young clusters with ages of 4–6 Myr. Among the clusters associated with ULXs, they found the age of 5 Myr for X-11 (their source X27), which is in agreement with our estimate of Myr. However, for X-42 (their X99), they find the age of 200 Myr, while we find it to be below 4 Myr. This discrepancy probably results from the –age degeneracy in colour-colour diagrams (see e.g. Bastian et al., 2009). On the other hand, our measurements of the are independent of the photometry. Similarly to Clark et al. (2011), Rangelov et al. (2012) have limited themselves to the clusters very close to the X-ray sources, which have led them to an erroneous conclusion that black holes stay within the clusters.
Neither Clark et al. (2011) nor Rangelov et al. (2012) have considered a possibility that the clusters and the X-ray sources separated by more that 1″ are related. We, however, find that majority of the X-ray sources in the Antennae galaxies with luminosities erg s-1 are located close to (but not within) very young clusters and there is a significant association between these types of sources. Together with findings by Kaaret et al. (2004) this means that the association with clusters and the displacements are the common properties of all high-mass X-ray binaries and the ULXs do not differ in this aspect from the less bright X-ray binaries. The correlation and the displacement of the brightest X-ray sources up to 300 pc from the clusters imply that they have been ejected from the clusters. It is not possible that the X-ray sources have been left behind their dissolved host clusters, because the extremely small ages of the clusters do not leave any time for the cluster (and nearby clusters) disintegration.
There exist three known runaway scenarios, which can explain these displacements:
- 1.
-
2.
Instantaneous momentum impulse, or “kick”, imparted through asymmetry of the supernova explosion in formation of a neutron star (Woosley, 1987; Cordes & Chernoff, 1998). A non-radial asymmetry in neutrino momentum distribution of only 1 % would give the neutron star a recoil velocity of a few hundred kilometers per second;
- 3.
The first two mechanisms cannot explain the data, because the binary is ejected after the SN explosion, and the system stays in the cluster for all the period of the primary evolution. This time is Myr for star (Leitherer et al., 1999), which leaves no time for relocation to their present positions.
Alternatively, the ejection of massive X-ray binaries from the clusters can occur already at the very beginning stages of the cluster evolution due to close encounters. This scenario is supported by the presence of the blue halos of massive stars around the clusters (Whitmore et al., 1999) as seen in Fig. 2. The belts of young blue stars close to the young clusters might indicate that some of the less massive clusters have already dissolved (Moeckel & Bate, 2010). Due to gas expulsion, young embedded star clusters become super-virial and start to expand on the typical time-scale of Myr (Kroupa et al., 2001; Pflamm-Altenburg & Kroupa, 2006). The relatively large displacement and high spatial velocities are consistent with the results of N-body simulations showing that the most massive stars (binaries) are ejected at early stages of formation of stellar clusters (Moeckel & Bate, 2010; Mapelli et al., 2011).
The short cluster life-times imply limitation on the ULX binary mass ratio. One may understand the association of the five ULXs with young clusters (see Table 3), if both companions are very massive and they evolve at approximately the same time-scale Myr. If the original mass ratio is large , the evolution of the pre-ULX system takes twice as long time , because after time the primary transfers its mass to the companion, which then evolves at the time-scale of .666We note that the companion has to be evolved to produce a super-Eddington accretion rate required to power a ULX (King et al., 2001; King, 2004). Depending on the original mass ratio (and the masses) the total binary evolution takes between and . Two sources, X-11 and X-35, may be associated with less massive binaries with 50–100 and .
The observations, however, are clearly inconsistent with the IMBH scenario as such massive black hole cannot be ejected from clusters at the required high (80 km s-1) velocities. In their displacements from young clusters, the ULXs do not differ from the sub-ULXs sources. In this property, the ULXs constitute a continuation of the high-mass X-ray binary population.
6 Conclusions
In this paper we have studied the environments around the brightest X-ray sources in the Antennae galaxies. Using a high-accuracy astrometric solution we found a highly significant association between the X-ray sources and the stellar clusters. We also showed that most of the bright X-ray sources are located outside of these clusters confirming previous findings. We have studied two samples of the X-ray sources, the ULX-sample ( erg s-1) and sub-ULX one ( erg s-1). Using VIMOS imaging we were able to determine the reddening towards to the clusters near the ULXs and to find their age, which was less than 5 Myr. The sub-ULX sample sources are also connected with young clusters ( Myr) because they surrounded by H emission.
The clear association of the young star clusters and the X-ray sources both in the ULX and sub-ULX samples in the Antennae demands these massive binaries to be ejected off the star clusters. All these sources belong to the runaway star population. The extremely young ages of the clusters associated with the ULXs put the lower limit on the mass of their progenitor stars. The minimum possible mass varies between 40 and 100, indicating that all studied ULXs in the Antennae galaxies are associated with the most massive binary stars. A few ULX sources associated with the youngest star clusters must originate from stars with the mass ratio . We conclude that the association with young star clusters and the displacements are the common properties of all high-mass X-ray binaries and the ULXs do not differ in this aspect from the less bright X-ray binaries. Our findings strongly rule out an alternative hypothesis that majority of ULXs are IMBHs.
The star ejection mechanisms based on a SN explosion (either symmetric explosion in a close binary or a direct “kick”, imparted through asymmetry of the SN) are ruled out because the binary is ejected after the SN explosion. Because the ULX-clusters are very young, 3–4 Myr, there is no time for the pre-SN evolution inside the cluster.
The relatively large displacements (up to 300 pc) and high spatial velocities (80 km s-1) found are consistent with the results of N-body simulations showing that the most massive stars (binaries) are ejected at the very beginning stages of the cluster evolution due to close encounters.
Acknowledgments
This work is based on observations made with the NASA/ESA Hubble Space Telescope, obtained from the data archive at the Space Telescope Science Institute. STScI is operated by the Association of Universities for Research in Astronomy, Inc. under NASA contract NAS 5-26555. This research used the facilities of the Canadian Astronomy Data Centre operated by the National Research Council of Canada with the support of the Canadian Space Agency. The research was supported by the Academy of Finland grants 127512 and 133179, the Russian RFBR grant 10-02-00463 and Russian grant of the Scientific Leading Schools 4308.2012.2. We thank an anonymous referee for many useful comments. We also thank Thomas Tauris for discussion.
References
- Bastian et al. (2006) Bastian N., Emsellem E., Kissler-Patig M., Maraston C., 2006, A&A, 445, 471
- Bastian et al. (2009) Bastian N., Trancho G., Konstantopoulos I. S., Miller B. W., 2009, ApJ, 701, 607
- Blaauw (1961) Blaauw A., 1961, Bull. Astron. Inst. Netherlands, 15, 265
- Clark et al. (2005) Clark D. M. et al., 2005, ApJL, 631, L109
- Clark et al. (2011) Clark D. M. et al., 2011, MNRAS, 410, 890
- Cordes & Chernoff (1998) Cordes J. M., Chernoff D. F., 1998, ApJ, 505, 315
- Cutri et al. (2003) Cutri R. M. et al., 2003, 2MASS All Sky Catalog of point sources. NASA/IPAC Infrared Science Archive
- Dolphin (2000) Dolphin A. E., 2000, PASP, 112, 1383
- Fabrika (2004) Fabrika S., 2004, ASPRv, 12, 1
- Fabrika & Mescheryakov (2001) Fabrika S., Mescheryakov, A., 2001, astro-ph/0103070
- Fall et al. (2005) Fall S. M., Chandar R., Whitmore B. C., 2005, ApJL, 631, L133
- Feng & Soria (2011) Feng H., Soria R., 2011, New Astron. Rev., 55, 166
- Freitag et al. (2006) Freitag M., Gürkan M. A., Rasio F. A., 2006, MNRAS, 368, 141
- Gooch (1997) Gooch R. E., 1997, PASA, 14, 106
- Grimm et al. (2003) Grimm H., Gilfanov M., Sunyaev R., 2003, MNRAS, 339, 793
- Heggie (1975) Heggie D. C., 1975, MNRAS, 173, 729
- Holtzman et al. (1995) Holtzman J. A., Burrows C. J., Casertano S., Hester J. J., Trauger J. T., Watson A. M., Worthey G., 1995, PASP, 107, 1065
- Johnson (1966) Johnson H. L., 1966, ARA&A, 4, 193
- Kaaret et al. (2004) Kaaret P., Alonso-Herrero A., Gallagher J. S., Fabbiano G., Zezas A., Rieke M. J., 2004, MNRAS, 348, L28
- King (2004) King A. R., 2004, MNRAS, 347, L18
- King et al. (2001) King A. R., Davies M. B., Ward M. J., Fabbiano G., Elvis M., 2001, ApJL, 552, L109
- Kroupa (2001) Kroupa P., 2001, MNRAS, 322, 231
- Kroupa et al. (2001) Kroupa P., Aarseth S., Hurley J., 2001, MNRAS, 321, 699
- Kuranov et al. (2007) Kuranov A. G., Popov S. B., Postnov K. A., Volonteri M., Perna R., 2007, MNRAS, 377, 835
- Leitherer et al. (1999) Leitherer C. et al., 1999, ApJS, 123, 3
- Liu et al. (2006) Liu J., Bregman J. N., Irwin J., 2006, ApJ, 642, 171
- Mapelli et al. (2011) Mapelli M., Ripamonti E., Zampieri L., Colpi M., 2011, MNRAS, 416, 1756
- Mikkola (1983) Mikkola S., 1983, MNRAS, 205, 733
- Moeckel & Bate (2010) Moeckel N., Bate M. R., 2010, MNRAS, 404, 721
- Osterbrock & Ferland (2006) Osterbrock D. E., Ferland G. J., 2006, Astrophysics of gaseous nebulae and active galactic nuclei. University Science Books, Sausalito
- Pflamm-Altenburg & Kroupa (2006) Pflamm-Altenburg J., Kroupa P., 2006, MNRAS, 373, 295
- Pflamm-Altenburg & Kroupa (2010) Pflamm-Altenburg J., Kroupa P., 2010, MNRAS, 404, 1564
- Portegies Zwart et al. (2004) Portegies Zwart S. F., Baumgardt H., Hut P., Makino J., McMillan S. L. W., 2004, Nature, 428, 724
- Poutanen et al. (2007) Poutanen J., Lipunova G., Fabrika S., Butkevich A. G., Abolmasov P., 2007, MNRAS, 377, 1187
- Poveda et al. (1967) Poveda A., Ruiz J., Allen C., 1967, Boletin de los Observatorios Tonantzintla y Tacubaya, 4, 86
- Predehl & Schmitt (1995) Predehl P., Schmitt J. H. M. M., 1995, A&A, 293, 889
- Ptak et al. (2006) Ptak A., Colbert E., van der Marel R. P., Roye E., Heckman T., Towne B., 2006, ApJS, 166, 154
- Rangelov et al. (2012) Rangelov B., Chandar R., Prestwich A., Whitmore B. C., 2012, ApJ, 758, 99
- Rangelov et al. (2011) Rangelov B., Prestwich A. H., Chandar R., 2011, ApJ, 741, 86
- Schweizer et al. (2008) Schweizer F. et al., 2008, AJ, 136, 1482
- Shklovskii (1976) Shklovskii I. S. 1976, Sov. Astron. Lett., 2, 46
- Stark et al. (1992) Stark A. A., Gammie C. F., Wilson R. W., Bally J., Linke R. A., Heiles C., Hurwitz M., 1992, ApJS, 79, 77
- Swartz et al. (2004) Swartz D. A., Ghosh K. K., Tennant A. F., Wu K., 2004, ApJS, 154, 519
- Swartz et al. (2009) Swartz D. A., Tennant A. F., Soria R., 2009, ApJ, 703, 159
- Tauris & Takens (1998) Tauris T. M., Takens R. J., 1998, A&A, 330, 1047
- Ueda et al. (2012) Ueda J. et al., 2012, ApJ, 745, 65
- van den Heuvel et al. (2000) van den Heuvel E. P. J., Portegies Zwart S. F., Bhattacharya D., Kaper L., 2000, A&A, 364, 563
- Vázquez & Leitherer (2005) Vázquez G. A., Leitherer C., 2005, ApJ, 621, 695
- Whitmore & Schweizer (1995) Whitmore B. C., Schweizer F., 1995, AJ, 109, 960 (WS95)
- Whitmore et al. (1999) Whitmore B. C., Zhang Q., Leitherer C., Fall S. M., Schweizer F., Miller B. W., 1999, AJ, 118, 1551
- Woosley (1987) Woosley S. E., 1987, in Helfand, D. J., Huang, J.-H., eds, The Origin and Evolution of Neutron Stars, Proc. IAU Symp. 125. D. Reidel Publishing, Dordrecht, p. 255
- Zanichelli et al. (2005) Zanichelli A. et al., 2005, PASP, 117, 1271
- Zezas & Fabbiano (2002) Zezas A., Fabbiano G., 2002, ApJ, 577, 726
- Zezas et al. (2006) Zezas A., Fabbiano G., Baldi A., Schweizer F., King A. R., Ponman T. J., Rots A. H., 2006, ApJS, 166, 211
- Zezas et al. (2002a) Zezas A., Fabbiano G., Rots A. H., Murray S. S., 2002a, ApJS, 142, 239
- Zezas et al. (2002b) Zezas A., Fabbiano G., Rots A. H., Murray S. S., 2002b, ApJ, 577, 710
- Zwicky (1957) Zwicky F., 1957, Morphological Astronomy. Springer, Berlin
Appendix A VIMOS imaging, spectra of clusters and comments on individual sources
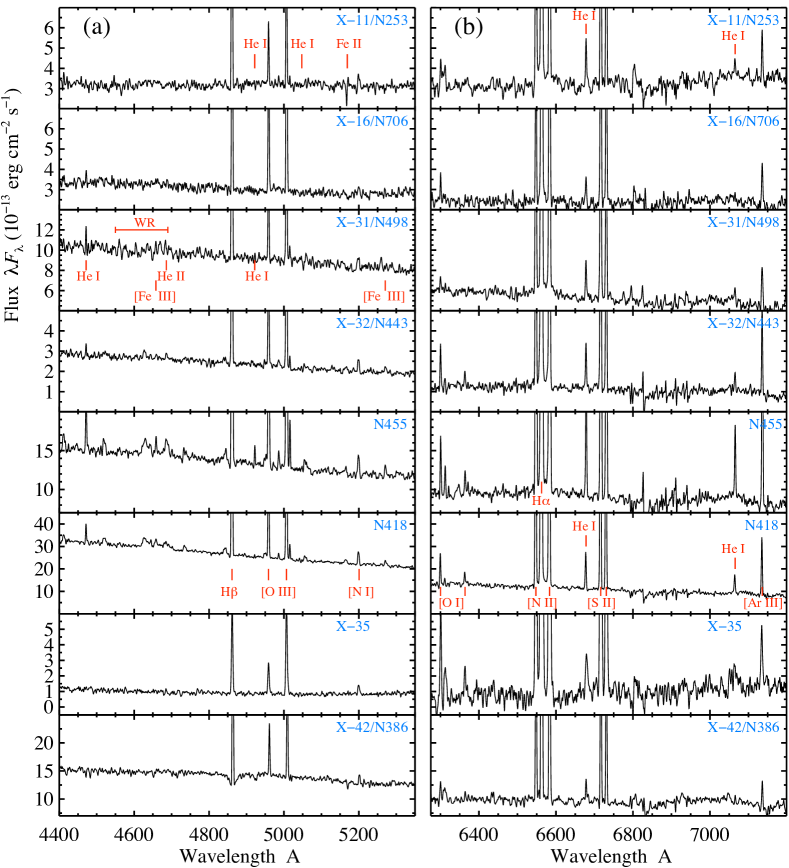
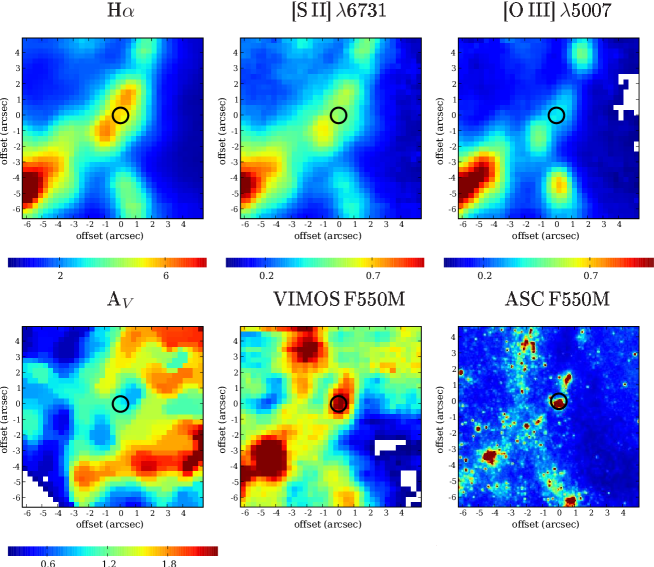
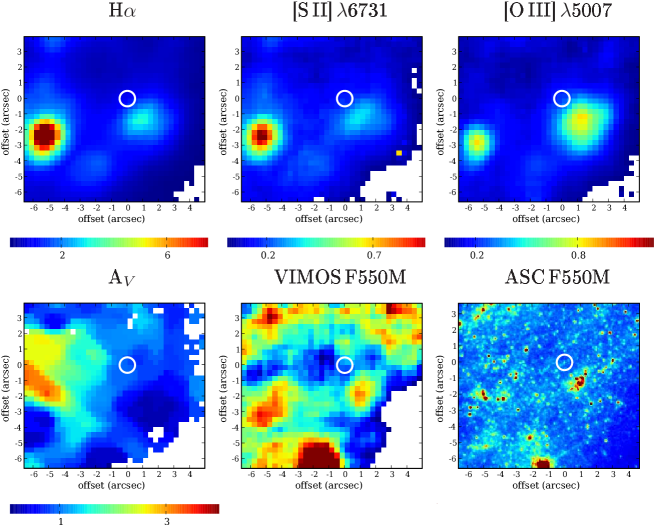
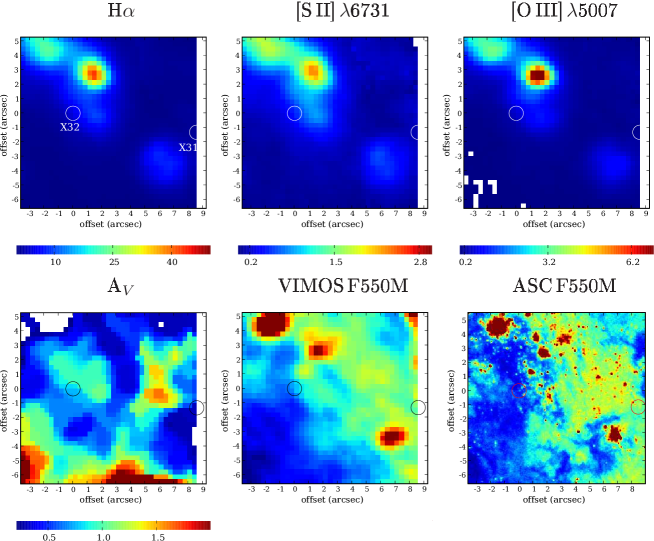
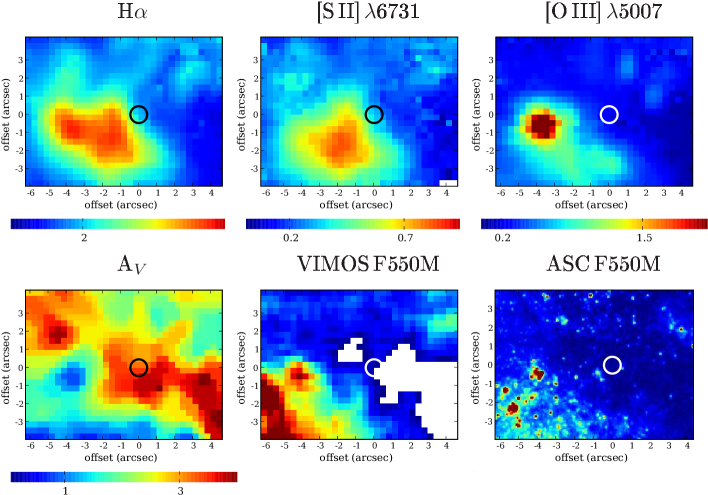
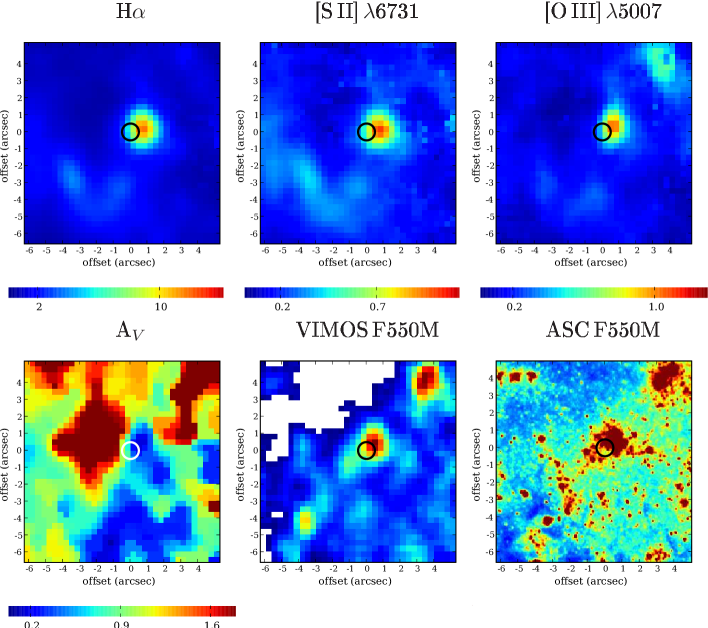
Fig. 8 presents the spectra of the bright stellar clusters next to the selected X-ray sources. In Figs 9–13 we show VIMOS images of regions around six brightest X-ray sources. The images were derived in H, [S ii] 6731, [O iii] 5007. There are also extinction maps and images in the continuum extracted in the ACS/F550M band and the ACS F550M image itself for comparison. In the estimates of the reddening we used the H/H flux ratios measured from the nebulae emission in the VIMOS fields. We adopt in the estimates.
The source X-18 (see Fig. 2) is located in a dusty zone, where there are no clusters from WS95 catalogue. There are also no known clusters around the source X-19. Source X-35 is located in a dust lane with two clusters at about the same distance (06–08) nearby. We have studied (Table 3) the brighter object, which is not from the WS95 catalogue, because another cluster is too weak for a detailed study. The objects associated with the X-ray sources X-16 and X-42 are cluster complexes and the brightest cluster in the complex was selected.
A.1 X-11
This X-ray source is located inside a cluster with dereddened (see Figs 2 and 9, Table 1). The cluster’s spectrum (see Fig. 8) has strong emission lines, which are formed in H ii regions, however, H line has broad wings indicating their stellar origin. In addition to the hydrogen lines H and H we see lines [O i] 6300, 6363, [O iii] 4959, 5007, [S ii] 6716, 6730, [N ii] 6548, 6583, [N ii] 5754. There are also lines indicating strong UV ionization sources, they are He i 4922, 5015, 5876, 6668, 7065, [N i] 5197, 5200 and [Ar iii] 7135. Although the [O i] lines are not resolved, other nebular lines are slightly broadened. Correcting for the spectral resolution we find FWHMs of hydrogen, [O iii], [Ar iii] lines of 50, 70 and 80 km s-1 respectively. There are numerous Fe ii narrow lines both in emission and in absorption and absorption line of Mg ii 4481. The strongest Fe ii 5169 line shows clear P Cygni-like profile. The absorption lines indicate their origin in stellar atmospheres. In the red spectral region, the Fe ii lines appear in emission. We suspect a presence of the [Fe ii], N ii, N iii and S ii emission lines in the spectrum, however, the spectrum quality is not enough to study these lines.
A.2 X-16
This X-ray source is located close (15) to a cluster with dereddened (see Figs 2 and 10, Table 1). The nebular lines in the cluster spectrum are about the same as those in cluster next to X-11, but the [O iii] 5007 line is brighter that H, which indicates a stronger UV ionization source. The narrow H shows broad wings. The Fe ii absorption lines and weak Si ii 6347, 6371 lines are present.
A.3 X-31 and X32
The spectra of the clusters located close to the X-ray sources X-31 (N498, dereddened , separation 25) and X-32 (N443, , separation 15) are shown in Fig. 8 together with the spectra of two other clusters N455 and N418 (named 5 and 6 in Bastian et al. 2006). Cluster N455 is located 35 to the NE and the brigth cluster N418 is located 5″to SE from X-ray positions of X-32 (see Figs 1, 2 and 11). We show spectra of these four clusters together because they are similar and all clusters are located close to each other. N455 and N418 show bright Wolf-Rayet spectral features, He ii 4686, Bowen blend (C iii/N iii emission lines, where N iii lines dominate strongly) together with the numerous [Fe iii] and [Fe ii] emission lines. Emission lines of Fe ii and Si iii are also detected. There are N ii–N iv emission lines as well, however, the Wolf-Rayet hump at Å (C iv and N iv lines) is not strong. The H lines show broad emission wings in the spectra. All these features point towards WN and LBV-like stars with extended winds in N455 and N418 clusters, indicating their ages to be less than 6 Myrs. The spectra of the clusters, which we accosiate with X-31 and X-32, show similar features. The cluster next to X-31 shows H line with broad wings, the N iii lines in the Bowen blend, many [Fe iii], [Fe ii] and N ii emission lines, as well as [Ar iv] 7170, 7237, 7262, 7331 lines in addition to the bright [Ar iii] 7135 line. Broad He ii 4686 is marginally detected. The cluster next to X-32 shows similar features, however, its [Fe iii] emission lines are notably broadened, and no [Ar iv] lines were detected in the spectrum. Emission lines of Fe ii, N ii and Si iii together with a faint He ii 4686 hump are detected.
A.4 X-35
This X-ray source is located close (06–08) to two clusters. The closest cluster N115 from WS95 catalogue (057 to the north) is too weak for a detailed study. Another apparently rather faint cluster (not mentioned in WS95, with dereddened ; see Figs 2 and 12, Table 1) is situated 083 to the SSW from X-35 at the edge of a strong dust line. The cluster is notably reddened () and its spectrum is noisy. We find about the same nebular spectrum as that in X-16 with the [O iii] 5007 line being brighter that H. However, in the red spectral region He i nebular lines and [Ar iii] are strong and broadened. Interestingly, there are [Fe iii] emission lines in the spectrum like those we observe in N 5 and N 6 clusters close to X-32. The [Fe ii] emission lines are marginally detected.
A.5 X-42
This X-ray source in located close (at 08) to a bright cluster complex with total (dereddened) (see Figs 2 and 13, Tables 1 and 3). The set of nebular lines is the same as in other clusters. However, this complex includes stars of different ages, there is a notable amount of A-type stars, because the H line has broad absorption wings. There are many stellar absorption lines in the spectrum indicating the B/A populations, numerous He i, Fe ii, C ii lines as well as the Mg ii and Si ii lines. He i lines appear in emission in the red part of the spectrum.