Discovery of an extremely gas-rich dwarf triplet near the center of the Lynx-Cancer void
Abstract
Giant Metrewave Radio Telescope (GMRT) H i observations, done as part of an ongoing study of dwarf galaxies in the Lynx-Cancer void, resulted in the discovery of a triplet of extremely gas rich galaxies located near the centre of the void.The triplet members SDSS J0723+3621, J0723+3622 and J0723+3624 have absolute magnitudes of –14.2, –11.9 and –9.7 and (H i)/ of 2.9, 10 and 25, respectively. The gas mass fractions, as derived from the SDSS photometry and the GMRT data are 0.93, 0.997, 0.997 respectively. The faintest member of this triplet SDSS J0723+3624 is one of the most gas rich galaxies known. We find that all three galaxies deviate significantly from the Tully-Fisher relation, but follow the baryonic Tully-Fisher relation. All three galaxies also have a baryon fraction that is significantly smaller than the cosmic baryon fraction. For the largest galaxy in the triplet, this is in contradiction to numerical simulations. The discovery of this very unique dwarf triplet lends support to the idea that the void environment is conducive to the formation of galaxies with unusual properties. These observations also provide further motivation to do deep searches of voids for a “hidden” very gas-rich galaxy population with .
keywords:
galaxies: dwarf – galaxies: evolution – galaxies: individual: SDSS J0723+3621, J0723+3622, J0723+3624 – galaxies: kinematics and dynamics – radio lines: galaxies – cosmology: large-scale structure of Universe1 Introduction
Early redshift surveys established that the spatial distribution of bright galaxies is highly inhomogeneous and that the properties of the galaxy population varies with environment. The spatial distribution was found to consist of large under dense regions (“voids”) surrounded by galaxies in sheets and walls (Jöeveer, Einasto & Tago, 1978; Kirshner et al., 1981; Geller & Huchra, 1989). Further, the morphological mix of galaxies was found to vary systematically with galaxy density. The fraction of late type galaxies monotonically increases as one goes from high density to low density regions (Postman & Geller, 1984). Subsequent numerical simulations showed that the existence of voids can be understood as a consequence of biasing in the formation of galaxy halos, with the most massive halos being formed in regions of high densities (White et al., 1987). However, numerical simulations also predicted that the voids should be filled with small mass halos (e.g. Davis et al., 1985; Gottlöber et al., 2003). Peebles (2001) pointed out that, contrary to this expectation, the known dwarf galaxies instead follow the same large scale distribution as the bright galaxies, a discrepancy that he dubbed the “void phenomenon”. We note that earlier (Pustilnik et al., 1995) as well as recent (Kreckel et al., 2012) studies do find dwarf galaxies inside voids, however it remains true that the brighter dwarfs generally lie near the void walls. Peebles (2001) also highlighted that if the small dark halos produced in voids preferentially fail to host galaxies, this would correspond to a discontinuous change in galaxy properties with density. This distinguishes the “void phenomenon” from the observed “morphology-density” relationship in which the morphological mix varies smoothly with density. Observational and theoretical studies of the void galaxy population have since been largely focused on these two (possibly related) issues viz. (i) a search for the “missing” dwarfs in voids and (ii) the influence of the large scale environment on galaxy properties.
Regarding the issue of missing dwarfs, deep searches of voids have shown that they do not contain dwarf galaxies in the numbers predicted by simulations (see e.g. Tikhonov & Klypin, 2009; Kreckel et al., 2012). The reason for this discrepancy is unclear, although there have been numerous suggestions that the formation of galaxies in small dark matter halos in voids is suppressed (e.g. Tinker & Conroy (2009); see also Kreckel et al. (2011)). Essentially, if small halos in voids are baryon deficient this would resolve the problem of missing dwarfs. Hoeft and Gottlöber (2010) examined the baryon fraction of small halos in both voids and filaments using high resolution simulations, and found no dependence of the baryon deficiency on environment. The discrepancy between numerical simulations and the observations hence remains a puzzle.
Regarding the issue of the effect of the large scale environment on the properties of void galaxies, studies using SDSS selected samples established that the void galaxy population is significantly bluer and has a higher star formation rate as compared to the high density galaxy population (Rojas et al., 2004, 2005). However Patiri et al. (2006) (see also (Park et al., 2007)) show that this difference is almost entirely due to the morphology-density relation. Late type galaxies which are more dominant in low density regions, have bluer colours and higher star formation rates than early type galaxies. At a fixed luminosity and morphology the properties of the detected void galaxies are statistically identical to that of galaxies in dense regions. It is worth noting here that these conclusions relate only to the upper part of the whole luminosity (or mass) range of void galaxies ( mag) and do not include study of possible differences in parameters such as the gas phase metallicity and gas mass fraction.
The gas mass fraction of void galaxies was studied in earlier works which looked at the distribution of (H i)/. Huchtmeier, Hopp, & Kuhn (1997) found that dwarf galaxies closer to the center of the void had a higher (H i)/ than galaxies close to the walls. Similarly, Pustilnik et al. (2002) found marginal evidence for low luminosity galaxies in voids to have a higher (H i)/ than those in higher density regions. Extrapolation of the obtained trends to the range indicated that for lower mass dwarfs the difference could be higher. On the other hand, Kreckel et al. (2012) show that the H i gas content of void galaxies are statistically indistinguishable from galaxies in filaments and walls, at least for galaxies brighter than mag. This result does not contradict earlier results, and underlines the need of deeper void galaxy samples.
A possible resolution of the discrepancy between the predictions of the numerical simulations and the observations is that the dwarfs predicted to exist in voids are fainter than what the observations have probed so far. For example, in their simulation, Kreckel et al. (2011) find that while luminous dwarfs ( brighter than mag) in voids are statistically indistinguishable from similar dwarfs in higher density regions, fainter dwarfs ( mag) are significantly bluer and have higher specific star formation rates than their higher density counter parts. They also find a significant excess of faint dwarf ( mag) galaxies that are preferentially located in low density regions near the void centre. To complement their numerical simulations Kreckel et al. (2012) used the SDSS to identify a population of void galaxies with mag. To identify and study still fainter objects one needs to focus on the nearby voids.
In a recent series of papers (Pustilnik & Tepliakova (2011) (Paper I), Pustilnik, Tepliakova & Kniazev (2011) (Paper II), Pustilnik et al. (2011c) (Paper III)) a sample of 79 galaxies residing in the nearby Lynx-Cancer void was presented. The sample galaxies have down to -12 mag, with reasonable completeness level at mag. For this completeness level, the average void galaxy density (0.04 Mpc-3) is about one order of magnitude smaller than the mean value for the faint SDSS galaxies derived by Blanton et al. (2005). More than half of the Lynx-Cancer void sample consists of low surface brightness dwarfs (LSBDs). Measurements of O/H are available for % of the sample, and shows that the metallicity of the void galaxies is on average lower than that of their counterparts in denser regions. About 10% of the sample are deficient in metals by factors of 2-7. A GMRT based H i study of these dwarfs is in progress. Here we report on a highly unusual system found in the course of the H i observations, viz. an extremely gas rich triplet of LSBD galaxies, located inside the central 10% of the void volume.
2 Observations and Results
| J0723+36 triplet | |
|---|---|
| Date of observations | 2011 Nov 25 |
| Field center R.A.(2000) | 07h23m07.40s |
| Field center Dec.(2000) | +36o2241.0" |
| Central Velocity () | 950.0 |
| Time on-source (h) | 6 |
| Number of channels | 256 |
| Channel separation () | 1.73 |
| Flux Calibrators | 3C48,3C286 |
| Phase Calibrators | 0741+312 |
| Resolution (arcsec2) | 40 40 |
| rms (mJy Bm-1) | 2.8 |
GMRT H i 21cm observations of the J0723+36 system were conducted on 25 Nov. 2011. The observational parameters are given in Table 1. The initial flagging and calibration was done using the flagcal package (Prasad & Chengalur, 2012) and further processing was done using standard tasks in the AIPS package. The hybrid resolution of the GMRT allows one to make maps at various resolutions, however, here we show only maps at resolution.


In Fig. 1[A] is shown the GMRT H i map of the J0723+36 system. At the time of the observations, only two galaxies, viz. SDSS J0723+3621, and SDSS J0723+3622 were known to lie within the observed data cube. At the adopted distance of 16 Mpc (see below) to this group the separation of the pair is 12.1 kpc. As can be seen from the figure, the GMRT observations detected one more H i source, which corresponds to the galaxy SDSS J0723+3624. The projected separation between this companion and the brighter of the two galaxies in the pair (viz. J0723+3621) is 23.9 kpc. SDSS band images showing these galaxies is shown in Fig. 2 and Fig. 3 (a colour composite for this pair is also shown in Paper III). The two brighter galaxies, J0723+3621, and J0723+3622 are clearly interacting, with a bridge of H i connecting them. For the third much smaller system there is a hint of an extension to the North-West, but the resolution is marginal. The velocity field (with isovelocity lines in steps of 6.0 ) for the whole system is shown in Fig. 1[B]. All three galaxies show clear velocity gradients, although in all cases the velocity field is disturbed. In the case of the galaxy pair, this is clearly due to the ongoing tidal interaction. The spins of both components of the pair are aligned with their orbital angular momentum, consistent with the pair undergoing a prograde collision. A prograde encounter geometry is also consistent with the significant tidal distortions seen.
A continuum image made using all the available channels shows no emission from the triplet galaxies. The rms noise level is mJy/Bm at an angular resolution of .


The main parameters of the three galaxies in the 0723+36 system are given in Tab. 2. The H i parameters are derived from the integrated single dish profiles shown in Fig 4. Because the velocity fields are disturbed, we do not attempt to derive rotation curves. Instead we use the velocity widths obtained from the integrated profiles to estimate the dynamical mass related quantities. The optical parameters are derived from the SDSS DR7 data (Abazajian et al., 2009). In the case of the newly discovered companion galaxy J0723+3624, there are two extended SDSS objects, separated by 5.5″ (0.4 kpc in projection) seen near the center of the H i emission. We refer below to these two objects associated with the companion J0723+3624 as the NE and SW components. The NE component (J072320.57+362440.8), has =21.42 and somewhat blue colours, (), albeit with large error bars. Independent photometry of this object based on the SDSS images resulted in very similar values, viz. =21.290.05 and . The SW component J072320.32+362436.7 is 1.3 mag fainter in -filter and is significantly redder (). Independent measurements from the SDSS data once again result in similar values, viz. a -flux that is 1.2-mag fainter and . This ‘red nebulosity’ looks similar to the very faint red galaxies seen to the North and East of the blue component, which could represent a small group of distant galaxies. We hence assume that the red nebulosity is unrelated to the H i-cloud. In any case, including this component would make only a minor difference to the total flux – making the object brighter in the -band by 0.26 mag.
The rows of Tab. 2 are as follows: the J2000 RA and Dec; , the Galactic extinction in -band; the total -magnitude, not corrected for , obtained by transformation from the total and , according to the formulae given in Lupton et al. (2006); the colour; the colour, computed from the observed and for the PEGASE2 constant evolutionary tracks with (or = ⊙/10). the heliocentric velocity, obtained from H i-profile in this paper; the adopted distance, accounting for the updated and the large negative velocity correction, described in Paper I; the calculated absolute blue magnitude, optical sizes (angular and linear), corrected for the Galactic extinction and inclination; the central inclination corrected surface brightness in -band; the measured H i-flux in units of Jy ; the profile widths and ; the inclination angle estimated from the SDSS images; the H i mass (H i); the total baryonic mass computed as . is the stellar mass computed from the SDSS data using the total magnitude in -filter and the total colour, corrected for the Galactic extinction (from NED, following to Schlegel et al. 1998), and the mass to luminosity ratio determined from the prescription given in Zibetti et al. (2009) (similar to used in Paper III); the total dynamical mass, computed using the formula M, where is the radius measured from the H i images at the atoms cm-2 level, and is the rotational velocity computed from after correction for inclination and turbulent motions using the prescription given in Verheijen & Sancisi (2001); , the virial mass, computed from the circular velocity estimated as above, and the formulae given in Hoeft et al. (2006); , the virial radius, computed from the circular velocity estimated as above, and the formulae given in Hoeft et al. (2006); the ratio of H i mass to blue luminosity, (H i)/ in solar units; the gas mass fraction ; the baryon fraction .
| Parameter | J0723+3621 | J0723+3622 | J0723+3624 |
|---|---|---|---|
| R.A.(J2000.0) | 07 23 01.42 | 07 23 13.46 | 07 23 20.57 |
| DEC.(J2000.0) | 36 21 17.1 | 36 22 13.0 | 36 24 40.8 |
| (from NED) | 0.23 | 0.23 | 0.23 |
| 17.010.03 | 19.310.03 | 21.56 | |
| 0.340.01 | –0.120.11 | 0.080.12 | |
| 0.340.01 | 0.020.08 | 0.170.09 | |
| (H i)() | 9171 | 9701 | 9381 |
| Distance (Mpc) | 16.0 | 16.0 | 16.0 |
| –14.24 | –11.94 | –9.68 | |
| Opt. size (″)5 | 4415(2) | 129.5 | 64: |
| Opt. size (kpc) | 3.411.16(2) | 0.930.74 | 0.470.31 |
| (mag arcsec-2) | 24.14 | 24.36 | 24.6: |
| H i int.flux | 3.740.4 | 1.590.2 | 0.480.05 |
| (km s-1) | 100.20.7 | 45.30.7 | 22.00.7 |
| (km s-1) | 122.51.0 | 69.01.0 | 33.51.0 |
| (degrees) | 90: | 60: | 60: |
| (H i)() | 54.0 | 35.2 | 15.3 |
| (H i) (10) | 22.6 | 9.61 | 2.9 |
| (10) | 32.37 | 12.8 | 3.86 |
| (10) | 623.8 | 132.5 | 16.91 |
| (10) | 359.5 | 102.3 | 8.9 |
| (kpc) | 87.3 | 57.4 | 25.4 |
| (H i)/ | 2.9 | 10.2 | 25 |
| 0.93 | 0.997 | 0.997 | |
| 0.009 | 0.013 | 0.043 |
3 Discussion

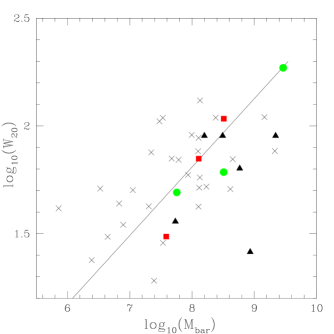
As can be seen from Tab. 2, all three galaxies have very large (H i)/ ratios; in fact J0723+3624 has one of the larges ratios known. The corresponding gas mass fractions are also extremely large. Even if we assume that the colours of J0723+3622 and J0723+3624 are redder by that the measured values, their gas mass fractions remain 0.99. For star forming galaxies the gas mass fraction is known to increase with decreasing luminosity (see e.g. McGaugh & de Blok, 1997; Geha et al., 2006). We show in Fig. 5 (H i)/ for the FIGGS ((Begum et al., 2008b)) sample, which also clearly shows this trend. The data for the galaxies from the J0723+36 triplet are also shown, and, as can be seen, for their given luminosities, all three galaxies lie at the extreme gas rich end of the distribution.
We also compare the galaxies location in the Tully-Fisher (TF) and Baryonic Tully-Fisher (BTF) diagrams. We note that the inclinations estimated for these galaxies are somewhat uncertain, however this should affect the TF and BTF relations equally. In Fig. 6[A] is shown the Tully Fisher relation for the FIGGS galaxies. Also overplotted is the TF relation for bright galaxies, as determined by Tully & Pierce (2000). As expected for dwarf galaxies, the FIGGS galaxies are underluminous for their velocity width ( see also Begum et al., 2008a). Once again, the triplet galaxies fall at the extreme end of the distribution. Fig. 6[B] shows the baryonic Tully-Fisher relation, with for reference the BTF relation shown from De Rijcke et al. (2007). Despite being extremely gas rich, the triplet galaxies do follow the BTF relation.
The baryon fraction of small galaxies is also an interesting quantity to compare against model predictions. For our extremely gas rich galaxies, the baryon fraction can be accurately measured. From numerical models (Hoeft et al., 2006; Hoeft and Gottlöber, 2010), one would expect that galaxies with circular velocities 50 would have a baryon fraction equal to that of the cosmic value of (Jarosik et al., 2011). For smaller galaxies, the baryon fraction drops sharply with circular velocity, at a circular velocity of 20 , the predicted baryon fraction is an order of magnitude below the cosmic value. As can be seen from Tab. 2, for all galaxies the baryon fraction is more than an order of magnitude lower than the cosmic baryon fraction. In the case of the brightest galaxy J0723+3621, the baryon fraction is that of the cosmic baryon fraction, while one would expect it to have the cosmic baryon fraction. This galaxy is clearly edge on, and this result is hence unlikely to be due to an uncertain inclination angle. McGaugh et al. (2010) has earlier highlighted that the measured baryon fraction for galaxies with rotation velocities in this range is significantly smaller than the cosmic baryon fraction. In this respect, J0723+3621 is similar to dwarf galaxies located outside of voids. Interestingly, appears to decrease with increasing velocity width, i.e. the reverse of what is predicted. One possible reason for this could be that for the smaller galaxies the baryons do not sample the flat part of the rotation curve, and hence underestimates the circular velocity. It is also worth noting that the expected virial radius of even the smallest galaxies dark matter halo is larger than the separation of the galaxies in this triplet. If one regards the entire triplet as a single system then the is , about 16 times smaller than the cosmic baryon fraction.

The triplet of galaxies that we are discussing here are found in the inner 10% volume of the Lynx-Cancer void. Kreckel et al. (2012) also find 3 similarly gas rich galaxies (VGS_7a, VGS_9a, VGS_12) in their void survey. Their absolute blue magnitudes computed from the SDSS magnitudes following the same procedures as for our triplet galaxies are of –13.86, –11.17 and -16.49 respectively. The corresponding (H i)/ ratios are is 5.9, 12.5 and 4.9. These very gas rich galaxies found in surveys of voids are interesting in view of the possibility highlighted by Peebles (2001) that the void environment could be conducive to the production of galaxies with extreme properties.
To examine this issue further, we take a look at the eleven galaxies with well measured (H i)/ 5 that we are aware of. The sample consists of three galaxies from the Kreckel et al. (2012) VGS sample, the two fainter members of the triplet discussed in this paper and six galaxies taken from the literature (see Tab. 3). For the two members of Lynx-Cancer void triplet and three most gas-rich VGS galaxies the type of global environment is clear from the sample selection. For the 6 galaxies from Tab. 3 the environment varies. The nearest two objects, UGC 292 and DDO 154, are situated on the periphery of the loose aggregate named Canis Venatici I Cloud (Karachentsev et al. 2003), which probably is still in the formation phase. The next most distant galaxy And IV is situated far from luminous galaxies, at 6.1 Mpc, and according to Ferguson, Gallagher, & Wise (2000) probably belongs to a loose dwarf group. However, its projected distances to the brightest dwarfs of this group are of more than 2 Mpc. The distance to the unusual pair of very gas-rich objects HI 1225+01 SW,NE is very uncertain, since it is unclear if this object lies in the foreground or background of the Virgo cluster. Because of this distance uncertainty, it is not possible to make a definitive statement about its environment. However, after a detailed analysis Salzer (1992) conclude that there is no evidence for a massive neighbour within Mpc of the system. The SBS 0335–052 system is at a projected separation of only 150 kpc from the large spiral galaxy NGC 1376 (Pustilnik et al., 2001). Peebles (2001) examined its location with respect to galaxies from the ORS (Santiago et al., 1995), and concluded that while it is not located in a dense region, neither is it located in a void. In summary, while all of the gas rich galaxies appear relatively isolated, it is not the case that they are all located deep inside voids.
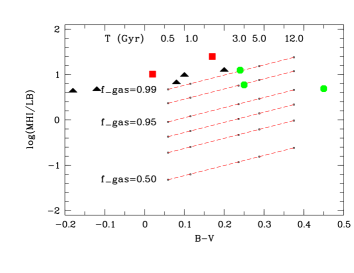
Next, we use star formation models to constrain the evolutionary history of these extremely gas rich galaxies. For 5 of these galaxies we only have the colour available, and we hence use this colour to constrain the star formation history. Unfortunately, due to the degeneracy of the evolutionary tracks for continuous and instantaneous star formation laws in diagrams one can not distinguish between 3 Gyr-old constant star formation rate and 1 Gyr-old burst. Including or band data in the analysis allows one in many cases to do this. For example Pustilnik et al. (2008, 2010, 2011b) use SDSS colours for similar gas-rich metal-poor blue galaxies to show that in most cases a continuous star formation law is preferable. Assuming that the LSB galaxies in the current sample have been forming stars at a constant rate, we used PEGASE2 models to compute the dependence (H i)/ and the colour on the age of the galaxy. We show in Fig. 7 a grid of models with =0.5, 0.8, 0.9, 0.95, 0.98 and 0.99, and star formation which started 0.5, 1, 3, 5, 12 Gyr ago. Consistent with the mass to light ratios that we have adopted in Tab. 2 one can see that models with do not match the observed (H i)/ and colours. Further, for the “blue” colours ( +0.25), typical of the gas-rich LSBDs considered here, the corresponding ages are 3 Gyr. The conclusion is that for a continuous star formation law all such blue gas-rich galaxies should have 0.98 and should have started their star formation relatively recently. These implied young ages are consistent with the conclusions of Pustilnik et al. (2008); Pustilnik et al (2010); Pustilnik, Tepliakova & Kniazev (2011) that the bulk of stellar populations in several very metal-poor dwarfs in the Lynx-Cancer void is relatively young.
| Parameter | And IV | SBS 0335–052W | HI 1225+01 SW | HI 1225+01 NE | UGCA 292 | DDO 154 |
|---|---|---|---|---|---|---|
| R.A.(J2000.0) | 00 42 32.30 | 03 37 38.40 | 12 26 55.00 | 12 27 46.29 | 12 38 44.63 | 12 54 05.20 |
| DEC.(J2000.0) | 40 34 18.7 | 05 02 36.4 | 01 24 35.0 | 01 35 57.1 | 32 45 01.5 | 27 08 59.0 |
| 16.56 | 19.14 | – | 16.0 | 16.10 | 13.94 | |
| Vhel(Hi)() | 234 | 4017 | 1226 | 1299 | 308 | 374 |
| Distance (Mpc) | 6.1 | 53.6 | 20.0 | 20.0 | 3.61 | 4.0 |
| M | –12.6 | –14.70 | –11.5 | –15.49 | –11.76 | –14.13 |
| 0.20: | –0.12 | – | +0.10 | +0.08 | –0.18 | |
| (mag arcsec-2) | 23.3 | 22.5 | 27 | 23.1 | 27.4 | 23.2 |
| 12+(O/H) | 7.50 | 7.00 | – | 7.63 | 7.30 | 7.54 |
| Hi int.flux(6) | 18.0 | 0.86 | 9.1 | 23.1 | 17.6 | 82.1 |
| (H i) (10) | 15.8 | 58.3 | 86 | 220 | 5.4 | 31.0 |
| (H i)/LB | 13.0 | 4.9 | 155 | 10.1 | 6.93 | 4.52 |
| 0.99 | 0.995 | 0.999 | 0.993 | 0.993 | 0.997 | |
| (1) – from NED; (2) – data for And IV: Ferguson et al. 2000, Chengalur et al. 2008, Pustilnik et al. 2008; (3) – data for SBS 0335–052W: Pustilnik et al. 2004, Ekta et al. 2009; Izotov et al. 2009; (4) – data for HI 1225+01 SW and HI 1225+01 NE: Salzer et al. 1991, Chengalur et al. 1995; Turner & MacFadyen 1997; we adopt =20 Mpc, while 10 and 15 Mpc are possible alternatives; (5) – data for UGCA 292: van Zee 2000, Makarova et al. 1998; (6) – data for DDO 154: Carignan & Freeman 1988, Carignan & Beaulieu 1989; Walter et al. 2008 (THINGS), O/H from Moustakas et al. 2010. | ||||||
As discussed in the introduction, one possible solution to the discrepancy between the number of dwarfs predicted by numerical solutions and the observed number of dwarfs in voids, is that the void dwarfs are fainter than the faintest levels probed by the current surveys. The ongoing blind H i-survey ALFALFA (Haynes et al. 2011) has a significantly higher sensitivity and angular resolution than previous surveys. However, even in the ALFALFA survey, objects like the faintest member of our triplet would be difficult to detect outside the Local Volume. J0723+3624 with (H i)=0.48 Jy would fall below the survey detection limit were it to be placed 1.5 times further than its current distance. ALFALFA is hence best placed to find galaxies such as this in voids with 20 Mpc. Detection of substructure in systems like this triplet would however require follow up synthesis imaging observations. We note in this context that Kreckel et al. (2012) find that void dwarfs show similar small scale clustering as dwarfs in denser environments. For distances 16 Mpc (distance moduli 31 mag) these faint LSBDs with will not be easily identified, either via blind H i-surveys, nor via recently conducted wide-field spectral surveys, like the SDSS or 2dFGRS. The existence in voids of ’unknown’ population of very gas-rich LSB dwarfs with –11 which escaped detection in previous studies, hence remains a viable option. Systematic searches for such faint dwarfs will require the next generation optical and radio surveys.
4 Summary and conclusions
In summary we report the discovery of an extremely gas rich triplet of galaxies near the centre of the nearby Lynx-Cancer void. The triplet consists of the LSB galaxies J0723+3621 (= –14.2), J0723+3622 (= –11.9) and J0723+3624 (= –9.7) which lie within a projected separation of 25 kpc, and a radial velocity interval of 55 . The (H i)/ ratios are 2.9, 10 and 25 respectively. All of the galaxies lie at the extreme gas rich end of the dwarf galaxy population. The faintest galaxy in the triplet J0723+3624 is one of the most gas rich galaxy known. The large (H i)/ and blue colours of the fainter two members of this triplet are consistent with star formation that started relatively recently (3 Gyr ago). All three galaxies deviate significantly from the Tully-Fisher relation, but follow the baryonic Tully-Fisher relation. For these extremely gas rich galaxies, the baryonic mass can be accurately, determined. We find that the baryon fraction (computed assuming they have dark matter halos with structures as predicted by CDM models) of all of the galaxies are significantly smaller than the cosmic baryon fraction. For the largest galaxy in the triplet, this is in contradiction to numerical simulations which predict that it should have a baryon fraction comparable to the cosmic mean value. The discovery of this very unusual dwarf triplet, along with the recent discovery by Kreckel et al. (2012) of other faint gas rich dwarfs in voids, lends support to the suggestion that the void environment is a fertile hunting ground for unusual, less evolved, galaxies, which in many ways resemble high redshift young galaxies.
Acknowledgements
SAP acknowledges the support of this work through the RFBR grants No. 10-02-92650-IND and 11-02-00261 and the Federal Target Innovative Program under the contract No.14.740.11.0901. The authors thank Y.Lyamina for providing the independent photometry for the faint galaxies prior publication. This paper used observations made using the GMRT, which is operated by NCRA-TIFR. The authors acknowledge the spectral and photometric data and related information available in the SDSS database used for this study. The Sloan Digital Sky Survey (SDSS) is a joint project of the University of Chicago, Fermilab, the Institute for Advanced Study, the Japan Participation Group, the Johns Hopkins University, the Max-Planck-Institute for Astronomy (MPIA), the Max-Planck-Institute for Astrophysics (MPA), New Mexico State University, Princeton University, the United States Naval Observatory, and the University of Washington. This research has made use of the NASA/IPAC Extragalactic Database (NED).
References
- Abazajian et al. (2009) Abazajian K.N., Adelman-McCarthy J.K., Agüeros M.A. et al., 2009, ApJS, 182, 543
- Begum et al. (2008a) Begum A., Chengalur J.N., Karachentsev I.D., Sharina M.E., 2008a, MNRAS, 386, 138
- Begum et al. (2008b) Begum A., Chengalur J.N., Karachentsev I.D., Sharina M.E., Kaisin S.S., 2008b, MNRAS, 386, 1667
- Blanton et al. (2005) Blanton M.B., Lupton R., Schlegel D.J., Strauss M.A., Brinkmann J., Fukugita M., Loveday J., 2005, ApJ, 631, 208
- Carignan & Freeman (1988) Carignan C. & Freeman K.C., 1988, ApJ, 332, L33
- Carignan & Beaulieu (1989) Carignan C. & Beaulieu S., 1989, ApJ, 347, 760
- Chengalur et al. (1995) Chengalur J.N., Giovanelli R., Haynes M.P., 1995, AJ, 109, 2415
- Chengalur et al. (2008) Chengalur J.N., Begum A., Karachentsev I.D., Sharina M., Kaisin S., 2008, Galaxies in the Local Volume, Astrophysics and Space Science Proceedings, Volume. ISBN 978-1-4020-6932-1. Springer Netherlands, 2008, p.65 (arXiv:0711.2153)
- Davis et al. (1985) Davis M., Efstathiou G., Frenk C. S., White S. D. M., 1985, ApJ, 292, 371
- De Rijcke et al. (2007) De Rijcke S., Zeilinger W. W., Hau G. K. T., Prugniel P., Dejonghe H., 2007, ApJ, 659, 1172
- (11) Ekta B., Pustilnik S.A., Chengalur J.N., 2009, MNRAS, 397, 963
- Ferguson, Gallagher, & Wise (2000) Ferguson A.M.N., Gallagher J.S., & Wise R.F.G., 2000, AJ, 120, 821
- Geha et al. (2006) Geha M., Blanton M.R., Masjedi M., West A.A., 2006, ApJ, 653, 240
- Geller & Huchra (1989) Geller M. J., Huchra J. P., 1989, Sci, 246, 897
- Gottlöber et al. (2003) Gottlöber S., Łokas E. L., Klypin A., Hoffman Y., 2003, MNRAS, 344, 715
- Haynes et al. (2011) Haynes M.P., Giovanelli R., Martin A.M., et al. 2011, AJ, 142, 170
- Hoeft and Gottlöber (2010) Hoeft M., Gottlöber S., 2010, Advances in Astronomy, v.2010, Article ID 693968, 16 pp.
- Hoeft et al. (2006) Hoeft M., Yepes G., Gottlöber S., Springel V., 2006, MNRAS, 371, 401
- Huchtmeier, Hopp, & Kuhn (1997) Huchtmeier W. K., Hopp U., Kuhn B., 1997, A&A, 319, 67
- Izotov et al. (2009) Izotov Y.I., Guseva N.G., Fricke K.J., Papaderos P., 2009, A&A, 503, 61
- Jarosik et al. (2011) Jarosik N., et al., 2011, ApJS, 192, 14
- Jöeveer, Einasto & Tago (1978) Jöeveer, M., Einasto J., & Tago E., 2078, MNRAS, 185, 357
- Karachentsev et al. (2003) Karachentsev I.D., Sharina M.E., Dolphin A.E., et al., 2003, A&A, 398, 467
- Kirshner et al. (1981) Kirshner R. P., Oemler A., Jr., Schechter P. L., Shectman S. A., 1981, ApJ, 248, L57
- Kreckel et al. (2011) Kreckel K., Joung M.R., Cen R., 2011, ApJ, 735, 132
- Kreckel et al. (2012) Kreckel K., Platen E., Aragon-Calvo M.A., van Gorkom J.H., van de Weygaert R., van der Hulst J.M., Beygu B., 2012, AJ, 144, 16
- Lindner et al. (1996) Lindner U., Einasto M., Einasto J., et al., 1996, A&A, 314, 1
- Lupton et al. (2001) Lupton R., Gunn J.E., Ivezić Z. et al., 2001, in: Harnden F.R., Jr., Primini F.A. , & Payne H.E., eds, Astronomical Data Analysis Software and Systems X, ASP Conf. Ser. 238, Astron. Soc. Pac., San Francisco, p. 269
-
Lupton et al. (2005)
Lupton R., et al. 2005,
http://www.sdss.org/dr5/algorithms
/sdssUBVRITransform.html#Lupton2005 - Makarova et al. (1998) Makarova L., Karachentsev I., Takalo L. O., Heinämäki P., Valtonen M., 1998, A&AS, 128, 459
- McGaugh & de Blok (1997) McGaugh S. S., de Blok W. J. G., 1997, ApJ, 481, 689
- McGaugh et al. (2010) McGaugh S. S., Schombert J. M., de Blok W. J. G., Zagursky M. J., 2010, ApJ, 708, L14
- Moustakas et al. (2010) Moustakas J., Kennicutt R.C., Tremonti C.A., Dale D.A.. Smith J.-D.T., Calzetti D., 2010, ApJS, 190, 233.
- Patiri et al. (2006) Patiri S.G., Prada F., Holtzman J., Klypin A., Betancort-Rijo J., 2006, MNRAS, 372, 1710
- Park et al. (2007) Park C., Choi Y.-Y., Vogeley M. S., Gott J. R., III, Blanton M. R., SDSS Collaboration, 2007, ApJ, 658, 898
- Peebles (2001) Peebles P.J.E., 2001, ApJ, 557, 459
- Postman & Geller (1984) Postman M., Geller M. J., 1984, ApJ, 281, 95
- Prasad & Chengalur (2012) Prasad J., Chengalur J., 2012, ExA, 33, 157
- Pustilnik et al. (1995) Pustilnik S.A., Ugryumov A.V., Lipovetsky V.A., Thuan T.X., Guseva N.G., 1995, ApJ, 443, 499
- Pustilnik et al. (2001) Pustilnik S.A., Brinks E., Thuan T.X., Lipovetsky V.A., Izotov Y. I., 2001, AJ, 121, 1413
- Pustilnik et al. (2002) Pustilnik S. A., Martin J.-M., Huchtmeier W. K., Brosch N., Lipovetsky V. A., Richter G. M., 2002, A&A, 389, 405
- Pustilnik et al. (2003) Pustilnik S.A, Kniazev A.Y., Pramsky A.G., Ugryumov A.V., Masegosa J., 2003, A&A, 409, 917
- Pustilnik, Pramskij, Kniazev (2004) Pustilnik S.A, Pramskij A.G., Kniazev A.Y., 2004, A&A, 425, 51
- Pustilnik et al. (2005) Pustilnik S.A., Kniazev A.Y., Pramskij A.G., 2005, A&A, 443, 91
- Pustilnik et al. (2008) Pustilnik S.A., Tepliakova A.L., Kniazev A.Y., Burenkov A.N., 2008, Astrophys. Bulletin, 63, 102 (arXiv:0712.4205)
- Pustilnik et al (2010) Pustilnik S.A., Tepliakova A.L., Kniazev A.Y., Martin J.-M., Burenkov A.N., 2010, MNRAS, 401, 333
- Pustilnik & Tepliakova (2011) Pustilnik S.A., Tepliakova A.L., 2011, MNRAS, 415, 1188 (Paper I)
- Pustilnik, Tepliakova & Kniazev (2011) Pustilnik S.A., Tepliakova A.L., Kniazev A.Y., 2011, Astrophys. Bulletin, 66, 255 (Paper II) (arXiv:1108.4850)
- Pustilnik et al. (2011c) Pustilnik S.A., Martin J.-M., Tepliakova A.L., Kniazev A.Y., 2011, MNRAS, 417, 1335 (Paper III)
- Roberts (1969) Roberts M.S., 1969, AJ, 74, 859
- Rojas et al. (2005) Rojas R. R., Vogeley M. S., Hoyle F., Brinkmann J., 2005, ApJ, 624, 571
- Rojas et al. (2004) Rojas R. R., Vogeley M. S., Hoyle F., Brinkmann J., 2004, ApJ, 617, 50
- Salzer et al. (1991) Salzer J.J., di Serego Alighieri S., Matteicci F., Giovanelli R., Haynes M.P., 1991, AJ, 101, 1258
- Salzer (1992) Salzer J. J., 1992, AJ, 103, 385
- Santiago et al. (1995) Santiago B. X., Strauss M. A., Lahav O., Davis M., Dressler A., Huchra J. P., 1995, ApJ, 446, 457
- Schlegel, Finkbeiner, Douglas (1998) Schlegel D.J., Finkbeiner D.P., Douglas M., 1998, ApJ, 500, 525
- Tikhonov & Klypin (2009) Tikhonov A. V., Klypin A., 2009, MNRAS, 395, 1915
- Tinker & Conroy (2009) Tinker J.L., & Conroy C., 2008, ApJ, 691, 633
- Tully & Pierce (2000) Tully R.B., Pierce M.J., 2000, ApJ, 533. 744
- Tully et al. (2008) Tully R.B., Shaya E.J., Karachentsev I.D., Courtois H.M., Kocevski D.D., Rizzi L., Peel A., 2008, ApJ, 676, 184
- Turner & MacFadyen (1997) Turner N.J.J., MacFadyen A., 1997, MNRAS, 285, 125
- van Zee (2000) van Zee L., 2000, ApJ, 543, L31
- Verheijen & Sancisi (2001) Verheijen M. A. W., Sancisi R., 2001, A&A, 370, 765
- Walter et al. (2009) Walter F., Brinks E., de Block W.J.G., Bigiel F., Kennicutt R.C., Thornley M.D., Leroy A., 2008, AJ, 136, 2563
- White et al. (1987) White S. D. M., Davis M., Efstathiou G., Frenk C. S., 1987, Nature, 330, 451
- Zackrisson, Bergvall & Östlin (2005) Zackrisson E., Bergvall N., Östlin G., 2005, A&A, 435, 29
- Zibetti et al. ( 2009) Zibetti S., Charlot S. & Rix H.-W., 2009, MNRAS, 400, 1181