22institutetext: School of Chemical & Physical Sciences, Victoria University of Wellington, Wellington 6140, New Zealand
33institutetext: CSIRO Astronomy & Space Science, Epping, NSW 1710, Australia
44institutetext: Leiden Observatory, Leiden University, Oort Gebouw, P.O. Box 9513, 2300 RA Leiden, The Netherlands
55institutetext: Argelander-Institut für Astronomie, Auf dem Hügel 71, 53121 Bonn, Germany
Radio Halos in future surveys in the radio continuum
Abstract
Aims. Giant radio halos are Mpc-scale synchrotron sources detected in a significant fraction of massive and merging galaxy clusters. The statistical properties of radio halos can be used to discriminate among various models for the origin of non-thermal particles in galaxy clusters. Therefore, theoretical predictions are important as new radio telescopes are about to begin to survey the sky at low and high frequencies with unprecedented sensitivity.
Methods. We carry out Monte Carlo simulations to model the formation and evolution of radio halos in a cosmological framework and extend previous calculations based on the hypothesis of turbulent-acceleration. We adopt a phenomenological approach by assuming that radio halos are either generated in turbulent merging clusters, or are purely hadronic sources generated in more relaxed clusters, “off-state” halos.
Results. The models predict that the luminosity function of radio halos at high radio luminosities is dominated by the contribution of halos generated in turbulent clusters. The generation of these halos becomes less efficient in less massive systems causing a flattening of the luminosity function at lower radio luminosities, as also pointed out in previous studies. However, we find that potentially this can be more than compensated for by the intervening contribution of “off-state” halos that dominate at lower radio luminosities. We derive the expected number of halos to explore the potential of the EMU+WODAN surveys that will be carried out with ASKAP and Aperitif, respectively, in the near future. By restricting to clusters at redshifts 0.6, we show that the planned EMU+WODAN surveys at 1.4 GHz have the potential to detect up to about 200 new radio halos, increasing their number by one order of magnitude. A fraction of these sources will be “off-state” halos that should be found at flux level mJy, presently accessible only to deep pointed observations. We also explore the synergy between surveys at different radio frequencies, the Tier 1 LOFAR survey at 150 MHz and the EMU+WODAN surveys at 1.4 GHz. We predict a larger number of radio halos in the LOFAR survey due to the high LOFAR sensitivity, but also due to the existence of halos with very steep spectrum that glow up preferentially at lower frequencies. These halos are only predicted in the framework of turbulent re-acceleration models and should not have counterparts in the EMU+WODAN surveys, thus the combination of the two surveys will test theoretical models.
Key Words.:
Radiation mechanism: non–thermal - galaxies: clusters: general - radio continuum: general - X–rays: general1 Introduction
Radio halos are diffuse Mpc–scale radio sources observed at the center of of massive galaxy clusters (e.g., Ferrari et al. 2008, Venturi 2011, Feretti et al. 2012 for recent reviews). These sources emit synchrotron radiation produced by GeV electrons diffusing through G magnetic fields and provide the most important evidence of non-thermal components in the intra-cluster medium (ICM).
Clusters hosting radio halos always display evidence of very recent or ongoing merger events (e.g., Buote 2001; Schuecker et al 2001; Govoni et al. 2004; Venturi et al. 2008; Cassano et al. 2010a). The connection between radio halos and cluster mergers suggests that the gravitational process of cluster formation provides the energy to generate the non-thermal components in clusters through the acceleration of high-energy particles via shocks and turbulence (e.g., Sarazin 2004, Brunetti 2011a, for review). A scenario proposed to explain the origin of the synchrotron emitting electrons in radio halos assumes that seed relativistic electrons in the ICM are re-accelerated by the interaction with merger-driven MHD turbulence in merging galaxy clusters (turbulent re-acceleration model, e.g., Brunetti et al. 2001; Petrosian 2001). According to this scenario, the formation and evolution of radio halos are tightly connected to the dynamics and evolution of the hosting clusters. The occurrence of radio halos at any redshift depends on the rate of cluster-cluster mergers and on the fraction of the merger energy channelled into MHD turbulence and re-acceleration of high energy particles. This latter point depends on microphysics of the ICM and it is difficult to estimate (see e.g., Brunetti & Lazarian 2011a).
Despite model details, one of the most important expectations of this scenario is the existence of a population of radio halos with very steep radio spectra which will be mostly visible al low radio frequencies (Cassano et al. 2006; Brunetti et al. 2008). The existence of this population can be tested with the upcoming surveys at low radio frequencies with the Low Frequency Array (LOFAR)111http://www.lofar.org, the Long Wavelength Array (LWA, e.g., Ellingson et al. 2009) and the Murchison Widefield Array (MWA, e.g., Tingay et al. 2012). Cassano et al. (2010b) have shown that the LOFAR Tier-1 “Large Area Survey” at 120-190 MHz (Röttgering 2010), with an expected rms sensitivity of 0.1-0.3 mJy/beam, should detect about 350 giant radio halos up to redshift , and half of them should have very steep radio spectra (with , ).
An alternative scenario relies on the production of secondary electrons. Inelastic collisions between cosmic ray protons and target thermal protons in the ICM produce a population of secondary electrons that can generate diffuse synchrotron emission on galaxy cluster-scale (e.g., Dennison 1980; Blasi & Colafrancesco 1999). Despite several observations pointed out that pure secondary models have difficulties in explaining the spectral and morphological properties of several nearby giant radio halos (e.g., Brunetti et al. 2008; Donnert et al. 2010; Brown & Rudnick 2011; Jeltema & Profumo 2011, for additional constraints based on -ray upper limits), synchrotron emission produced by secondary electrons must be present in galaxy clusters. This comes from the theoretical argument that galaxy clusters are efficient reservoirs of cosmic ray protons (accelerated by structure formation shock waves, injected from radio galaxies, or from supernova driven galactic winds) and consequently these protons accumulate with cluster life-time increasing the probability to have proton-proton collisions (Völk et al 1996; Berezinsky et al 1997; Enßlin et al 1997).
Recent Fermi-LAT and Cherenkov-telescopes observations have placed upper limits on the ratio of non-thermal CRp to thermal energy densities at the level of few% in a number of nearby clusters (Ackermann et al. 2010; Aleksić et al. 2012). Assuming these constraints, it has been suggested that during cluster mergers the re-acceleration of secondary electrons by compressible MHD turbulence can generate synchrotron radiation in good agreement with radio halos, while synchrotron emission times fainter is generated in dynamically relaxed clusters when turbulence is dissipated (Brunetti & Lazarian 2011b). This theoretical conjecture is consistent with the observed radio bimodality in galaxy clusters (e.g., Brunetti et al. 2009; Cassano et al. 2010a), although it predicts a level of emission (from pure secondaries) in relaxed clusters that is close the upper limits derived for these clusters from present radio observations. More recently, Brown et al. (2011) claimed the detection of radio emission from the stacking of SUMMS images of “off-state” (non-radio halo) clusters at a level times fainter than that of classical radio halos, potentially in line with the above theoretical picture.
In about the next 10 years several revolutionary radio telescopes will survey the sky with unprecedented sensitivity and spatial resolution at very low (LOFAR, LWA, MWA) and GHz frequencies (ASKAP; Johnston et al. 2008 and Aperitif; Oosterloo, Verheijen, van Cappellen 2010). This gives the opportunity to constrain the complex connection between cluster dynamics and diffuse radio emission in galaxy clusters by means of statistical studies of adequately large cluster sample. The combination of incoming surveys at low (LOFAR) and higher (e.g., the EMU survey with ASKAP) frequencies will add considerable value in the attempt to discriminate between different physical origins of giant radio halos in galaxy clusters and, in general, of non-thermal cluster components. The first LOFAR observation at MHz of the giant radio halo in Abell 2256 shows that the radio spectrum extracted in the region of the halo steepens at lower frequencies. This unexpected result suggests that physical scenario more complex than previously thought should be considered to explain the formation of the radio halo in this cluster (van Weeren et al. 2012). In fact, different populations of relativistic electrons may coexist in the volume of the radio halo if they originate from different acceleration mechanisms, or if electrons are accelerated in a non homogeneous turbulent region where the efficiency of particle acceleration change with space and time in the emitting volume (van Weeren et al. 2012).
In this paper, we extend previous statistical modeling of giant radio halos by combining a picture based on turbulent re-acceleration of relativistic electrons by MHD turbulence in cluster mergers with the process of continuous injection of secondary electrons via p-p collision in the ICM. This provide a novel approach to interpret future data from surveys of galaxy clusters. This has not the aim to reproduce particular spectral features such as those observed in Abell 2256, but its aim is to provide a simplified (but viable) description of the general observed properties of the population of radio halos in galaxy clusters.
In Sect. 2 we summarize the main ingredients used in the model calculations, derive the occurrence of radio halos in clusters (Sect. 2.2) and the expected radio halo luminosity functions (Sect. 2.3). In Sect. 3 we discuss and model the contribution to the diffuse cluster-scale synchrotron emission from secondary electrons. In Sect. 4 we describe the EMU and WODAN surveys, while in Sect. 5 we derive the expected number of radio halos at 1.4 GHz and discuss the potential of the EMU and WODAN surveys. In Sect. 6 we discuss the potential of combining LOFAR and EMU and WODAN surveys in addressing the physics of giant radio halos. Our conclusions are given in Sect.7.
A CDM ( , , ) cosmology is adopted throughout the paper.
2 Statistical modelling of giant radio halos from turbulent re-acceleration
2.1 Main ingredients
Turbulence generated during cluster mergers may re-accelerate relativistic particles and produce diffuse synchrotron emission from Mpc regions in galaxy clusters (e.g., Brunetti et al. 2008). Diffuse radio emission in the form of giant radio halos should be generated in connection with massive mergers and fade away as soon as turbulence is dissipated and the emitting electrons cool due to radiative losses. Attempts for estimating the statistical properties of giant radio halos in the context of this scenario have been carried out in the past few years (Cassano & Brunetti 2005; Cassano et al. 2006; Cassano et al. 2010b). These studies allowed for a comparison with the presently observed statistical properties of giant radio halos, while at the same time they provide predictions to test with future instruments.
In these calculations we model the properties of the halos and their cosmic evolution by means of a Monte Carlo approach, taking into account the main processes that play a role in this scenario: the rate of cluster-cluster mergers in the Universe and their mass ratios, and the fraction of the energy dissipated during these mergers that is channelled into MHD turbulence and acceleration of high energy particles. We refer the reader to the papers quoted above for details, here for the sake of completeness we briefly report the essential steps of those calculations :
-
i)
The formation and evolution of dark matter halos of galaxy clusters is computed by the extended Press & Schechter approach (1974, hearafter PS; Lacey & Cole 1993), which is based on the hierarchical theory of cluster formation. Given the present-day mass and temperature of the parent clusters, the cluster merger history (merger trees) is obtained by using Monte Carlo simulations.
-
ii)
The generation of the turbulence in the ICM is estimated for each merger identified in the merger trees. Turbulence is assumed to be generated (and dissipated) within a timescale of the order of the cluster-cluster crossing time in that merger. Furthermore, it is assumed that the turbulence is generated in the volume swept by the subcluster infalling into the main cluster. The injection rate of turbulent fast modeswaves, that are used to calculate particle acceleration, is assumed to be a fraction, , of the work done by this subcluster.
-
iii)
The resulting spectrum of MHD turbulence generated by the chain of mergers in any synthetic cluster and its evolution with cosmic time is computed by taking into account the injection of waves and their damping, due to thermal and relativistic particles, in a collisionless plasma. Acceleration of particles by this turbulence and their evolution is computed in connection with the evolution of synthetic clusters by solving Fokker-Planck equations and including all the relevant energy losses of particles.
-
iv)
Synchrotron losses, particle acceleration and emissivity are calculated assuming homogeneous models (see Cassano et al. 2006): radio halos are assumed to be homogeneous spheres of radius kpc, and volume-average values of turbulent energy, acceleration rate and magnetic field are adopted. We assume a value of the magnetic field which scales with the virial mass of clusters, as
(1) where , and is the value of the rms magnetic field associated with a cluster with mass (see next Sect. and Sect. 3 in Cassano et al. 2006, for details). This scaling is motivated by the results of cosmological MHD simulations that found that the magnetic field scales with the temperature (and mass) of the simulated clusters (e.g., Dolag et al. 2002)222Dolag et al. (2002) found a scaling , which would imply that if the virial scaling is assumed..
2.2 Occurrence of Radio Halos with redshift and cluster mass
Stochastic particle acceleration by MHD turbulence is a rather inefficient process in the ICM that accelerates electrons at energies several GeV, since at higher energies the radiation losses quench the acceleration process (see e.g., Brunetti 2011b and references therein). In the case of a homogeneous model this implies a steepening of the synchrotron spectrum that affects the capability to detect radio halos at frequencies substantially larger than the frequency, , where the steepening becomes severe. The frequency depends on the acceleration efficiency , , and on , as (e.g., Cassano et al. 2006, 2010b). Monte Carlo simulations of cluster mergers that occur during the hierarchical process of cluster formation (Sect. 2.1) allow for evaluating from the estimated rate of turbulence-generation and the physical condition in the ICM, and consequently to explore the dependence of on cluster mass, redshift, and merger parameters in a statistical sample of synthetic clusters.
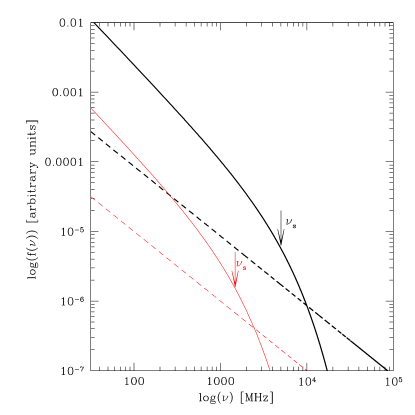
A reference example of spectra of “turbulent” radio halos as modeled in the present paper is shown in Fig.1. A simplified approach to estimate the occurrence of radio halos in surveys at different observing frequencies is to assume that only those halos with can be observable, being the observing frequency. Energy arguments imply that giant radio halos with 1 GHz are generated in connection with the most energetic merger-events in the Universe. Only these mergers can generate enough turbulence on Mpc scales and give the acceleration rate that is necessary to maintain the relativistic electrons emitting at these frequencies (Cassano & Brunetti 2005). Present surveys carried out at 1 GHz detect radio halos only in the most massive and merging clusters (e.g., Venturi 2011 and references therein, for a review). The fact that of X-ray luminous galaxy clusters host giant radio halos observed at GHz frequencies has been used to constrain the parameters for the generation of turbulence in the modeling described in Sect. 2.1 (, Cassano & Brunetti 2005; Cassano et al 2008a).
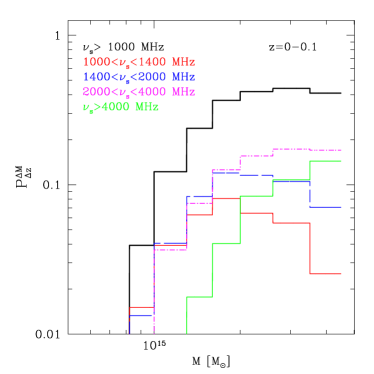
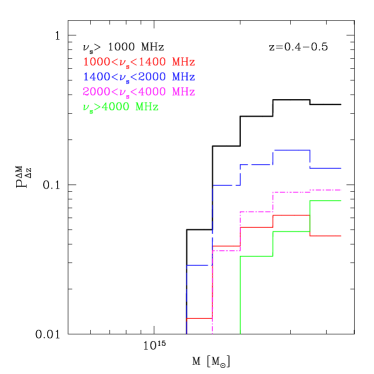
In Fig. 2, we plot the fraction of radio halos with 1 GHz (black upper line) and the differential contribution to this fraction from radio halos with in four frequency ranges (see figure caption for details). This is obtained by assuming a reference set of model parameters, namely G, , (see also Cassano et al. 2006).
At low redshift (), the fraction of clusters hosting radio halos with 2 GHz increases with the cluster mass, reaching a maximum value in the case of very massive clusters (). On the other hand, the fraction of clusters hosting radio halos with in the range 1-2 GHz (red and blue lines) reaches a maximum for clusters masses slightly below , and then decreases for more massive systems. This behavior is due to the fact that in general, in our model, the fraction of clusters with radio halos increases with the cluster mass, since more massive clusters are more turbulent, and thus are more likely to host a radio halo. The occurrence of halos with relatively lower values of ( GHz) also increase with the cluster mass, but lower the value of lower the value of the mass up to which the occurrence of these halos increases, for larger masses their occurrence decrease since those clusters preferentially form halos with larger values of .
Consequently we expect that very massive (and hot) clusters tend to generate giant radio halos with radio spectra flatter (higher values of ) than those in less massive systems. A tendency to have halos with flatter spectra in more massive (hot) systems have been reported in literature (Feretti et al. 2004; Giovannini et al. 2009, Venturi et al. 2012, sub.). If confirmed these findings would support our expectations.
In addition, we find that giant radio halos with higher values of become rarer with increasing redshift, mainly because of the inverse Compton losses that increase with redshift and limit the maximum energy of the accelerated electrons.

2.3 The radio halo luminosity function
The luminosity functions of radio halos (RHLFs) with (i.e., the expected number of halos per comoving volume and radio power “observable” at frequency ) can be estimated by :
| (2) |
where is the theoretical mass function of radio halos with , that is obtained by combining Monte Carlo calculations of the fraction of clusters with radio halos and the PS mass function of clusters (e.g., Cassano et al. 2006).
depends on (is proportional to) the unknown number of seeds electrons (or that of cosmic ray protons) in the ICM. Following Cassano et al.(2006) we estimate from the correlation observed for giant radio halos between the 1.4 GHz radio power, , and the mass of the parent clusters (e.g., Govoni et al. 2001; Cassano et al. 2006). The observed correlation allows us to normalize the radio luminosity of giant radio halos under the assumption that “all” radio halos with 1 GHz follow the correlation. In addition, in the context of the modeling described in Sect. 2.1, the value of the derivative depends on the set of parameters (, ), consequently the slope of the observed correlation ( with ) can be used to constrain model parameters selecting an allowed region in the parameter space (, ) (Cassano et al. 2006). In this paper we shall adopt a reference set of model parameters, i.e., G and (and ), that falls in this region; in this case .
To derive the RHLF at frequency MHz, we consider the contribution of all radio halos with GHz. We first obtained the RHLF for halos with in the frequency interval , and then combined the different contributions from the considered intervals :
| (3) |
The relation between the monochromatic radio luminosity of halos with a given (with ) and that of halos with GHz has been derived by Cassano et al.(2010b) :
| (4) |
allowing a prompt evaluation of in Eq. 3.
Taking , from Eq.4 one has:
| (5) |
i.e., radio halos with synchrotron spectra that steepen at lower frequencies will also have smaller monochromatic radio powers at the observing frequency .
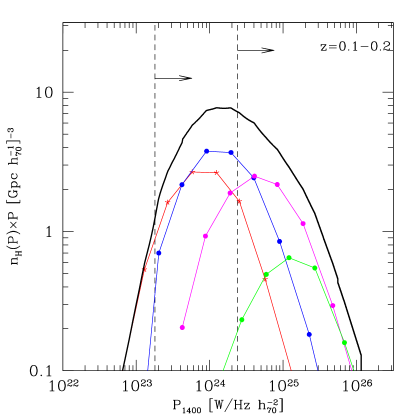
As a relevant example, in Fig.3 we report the expected RHLF at 1.4 GHz (black lines) for (solid thick lines), where we also mark the relative contributions from halos with different values of (see caption).
As already discussed in Cassano et al. (2006) and Cassano et al. (2010b), the shape of the RHLF flattens at lower radio powers because of the expected decrease of the efficiency of particle acceleration in the case of less massive clusters. We note that halos with GHz (green and magenta lines, Fig. 3) do not contribute significantly to the RHLF at lower radio luminosities. This is because higher-frequency halos are generated in very energetic merger events that are extremely rare in smaller systems, and have large monochromatic radio luminosities (Eq.5) (red and blue lines, Fig. 3). Finally, we note that the normalization of the RHLFs decreases with increasing redshift (Fig.4) due to the evolution with of both the cluster mass function and the fraction of galaxy clusters with radio halos (Fig. 2, see also Cassano et al. 2006).
3 Secondary electrons
An additional contribution to the Mpc-scale synchrotron emission from galaxy clusters comes from the process of continuous injection of secondary electrons via p-p collisions in the ICM.
A self-consistent modeling of the re-acceleration of primary cosmic rays and secondary electronspositrons by compressible MHD turbulence in the ICM has been developed in Brunetti & Lazarian (2011b). Implementing their formalism in our cosmological Monte Carlo framework is challenging and out of the main focus of the present paper.
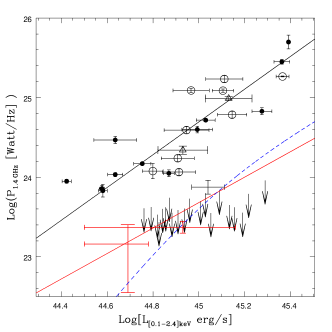
Here we adopt a simplified approach based on two separate cluster radio-populations. We assume that presently observed radio halos are mainly generated in merging clusters by particle acceleration by turbulence. In more relaxed clusters, turbulence cannot maintain a population of relativistic electrons emitting at the observing frequencies, , and in these cases the dominant contribution to Mpc-scale radio emission is due to the generation of secondary particles. As a first approximation we can assume that the level of the emission from secondary particles in these clusters is stationary, i.e., it does not depend on cluster dynamics, since the primary protons accumulate in galaxy clusters over the cluster lifetime and continuously generate secondaries (Blasi 2001) 333We do not consider here possible modifications of the synchrotron emission in these clusters due to magnetic field amplification and cosmic-ray diffusion (e.g., Kushnir et al. 2009; Enßlin et al. 2011).. Under our hypothesis the emission produced by secondary particles can be constrained from the limits derived from deep radio observations of “radio quiet” galaxy clusters (e.g., Brunetti et al. 2007, 2009). These limits are about one order of magnitude below the radio-X-ray luminosity correlation for classical giant radio halos (Fig. 5). More recently, Brown et al. (2011) have detected diffuse emission from “off-state” galaxy clusters by stacking SUMSS images of 100 clusters. Potentially, this signal can be contributed by secondary particles in less turbulent systems. Motivated by these recent observations, here we assume that clusters where turbulence is not enough to produce giant radio halos emitting at the observing frequency (i.e., with , see Sect.2) host diffuse radio emission powered by pure secondaries with a luminosity that is similar to the upper limits in Fig. 5. Following Brown et al. (2011) we refer to these halos as to “off-state” radio halos.
The massfunction of “off-state” halos is given by:
| (6) |
where is the fraction of clusters of mass with radio halos due to turbulence re-acceleration (with ) and is the cluster mass function. The luminosity function of “off-state” halos is:
| (7) |
We derive from the expected relation between the radio luminosity of “off-state” halos and the mass (or ) of the host clusters. In their most simple formulation, secondary models predict a correlation between the radio luminosity of halos and the cluster X-ray luminosity (e.g., Kushnir, Katz & Waxman 2009)444Here we modify Kushnir et al. formalism to account also for the case of weak magnetic fields. that is slightly flatter than that of giant radio halos (see Brunetti et al. 2009):
| (8) |
where the second equivalence is obtained by assuming the correlation (taken from Cassano et al. 2006). The normalization factors and are derived in order to be consistent with the radio upper limits in the plane obtained for “radio quiet” systems (Brunetti et al. 2007, 2009). Specifically, we adopt two different approaches and obtain two scalings (see Fig.5): a) in the first one we use the scaling of the magnetic field with the cluster mass in Eq.1 with and G, and adopt Watt/Hz for erg/sec (blue line in Fig.5); b) in the second one we consider a constant magnetic field G and a slightly higher normalization, Watt/Hz for erg/sec (red line in Fig.5). The latter approach maximizes the contribution from secondary electrons. A reference example of spectra of “off-state” (hadronic) halos in the case a) is show in Fig.1.
Apparently, the adopted scalings for secondaries are not fully consistent with non-detections of higher luminosity clusters, however some of these clusters are cool-core systems and their luminosity is likely to be boosted (up to times) by the emission produced in the core (Cassano et al. in, prep). In addition, upper limits reported in Fig.5 have been obtained at 610 MHz and scaled to 1.4 GHz by adopting a spectral index , while the spectrum of secondary halos assumed in the present paper is implying that a fair comparison with theoretical models should use shallower limits.


In Fig. 6 we report the total RHLF, obtained by combining the contributions from “turbulent” radio halos and from (purely hadronic) “off-state” halos, in the case a) (left panel) and b) (right panel). Under our assumptions, “off-state” halos dominate the RHLF at lower radio luminosities where the RHLF due to turbulent radio halos flattens.
4 The EMU+WODAN Surveys
4.1 ASKAP: EMU survey
The Australian SKA Pathfinder (ASKAP) (Johnston et al. 2008) is a new radio telescope being built at the Murchison Radio-astronomy Observatory in Western Australia. It consists of 36 12-metre antennas distributed over a region 6 km in diameter. ASKAP will have an instantaneous field of view of 30 deg2, enabling surveys of a scope that cannot be contemplated with current-generation telescopes. The ASKAP array configuration balances the need for high sensitivity to extended structures with the need for high resolution. To achieve this, 30 antennas follow a roughly Gaussian distribution with a scale of 700 m, corresponding to a point spread function of 30, with a further six antennas extending to a maximum baseline of 6 km, corresponding to a point spread function of 10. These short spacings of ASKAP deliver excellent sensitivity to low-surface brightness emission, which is essential for studies of radio emission from clusters.
Science data processing will take place in an automated pipeline processor in real time. The on-line imaging uses neither natural nor uniform weighting, but instead uses an algorithm called preconditioning, which, together with multi-scale clean, gives a similar sensitivity to uniform weighting at small spatial scales, and a similar sensitivity to natural weighting at large spatial scales. So near-optimum sensitivity is obtained at all scales without needing to reweight the data. The Jy/beam rms continuum sensitivity in 12 hours is approximately constant for beam sizes from 10 to 30 arcsec, then increases to Jy/beam for a 90 arcsec beam and Jy/beam for a 3 arcmin beam.
One important key project of ASKAP will be EMU, the “Evolutionary Map of the Universe” (Norris et al 2011), an all-sky continuum survey. The primary goal of EMU is to make a deep (10 Jy/beam rms) radio continuum survey of the entire Southern Sky, extending as far North as . EMU will cover roughly the same fraction (75%) of the sky as the benchmark NVSS survey (Condon et al. 1998) , but will be 45 times more sensitive, and will have an angular resolution (10 arcsec) 4.5 times better. Because of the excellent short-spacing uv coverage of ASKAP, EMU will also have higher sensitivity to extended structures such as cluster haloes.
4.2 APERTIF: WODAN survey
APERTIF, the new Phased Array Feed (PAF) system that will be installed on the Westerbork Synthesis Radio Telescope (WSRT), will dramatically increase, at frequencies from 1.0 to 1.7 GHz, the instantaneous field of view of the WSRT and its observing bandwidth (e.g., Oosterloo et al 2010). Many beams can be formed simultaneously for each dish making it possible to image an area of about 8 square degree on the sky, which is an increase of about a factor 30 compared to the current WSRT. This entire field of view will be imaged with 15 arcseconds spatial resolution over a bandwidth of 300 MHz with a spectral resolution of about 4 km/s. The survey speed of APERTIF, and many of the other characteristics, will be very similar to ASKAP.
The extremely large field of view of APERTIF would enable the WODAN (Westerbork Observations of the Deep APERTIF Northern-Sky) project (e.g., Röttgering et al. 2011). This project has been proposed with the aim to chart the entire accessible northern sky at 1400 MHz down to 10 Jy rms and about 1000 deg2 down to 5 Jy. WODAN will be an important complement of the EMU project in the northern sky.
5 Number of radio halos in the EMU+WODAN survey

It has been shown that results based on calculations carried out according to Sect.2 are consistent with the observed increase of the fraction of clusters with radio halos with the cluster mass (or X-ray luminosity; Cassano et al. 2008a) and with the observed number of nearby radio halos (Cassano et al. 2006). In particular, Cassano et al. (2010b) showed that model expectations also produce the flux distribution of giant radio halos observed in the redshift ranges (derived from the NVSS; Giovannini et al. 1999) and (derived from the GMRT radio halo survey; Venturi et al. 2007, 2008).
The EMU+WODAN survey will explore the radio sky with a sensitivity 10 times better than present surveys, making it possible to test models in a totally unexplored range of radio halo luminosities and masses of the host systems. In this Section we shall derive the expected number of radio halos at 1400 MHz and explore the potential of the upcoming EMU+WODAN survey.
At this point it is important to estimate the minimum flux of a radio halo (integrated over a scale of 1 Mpc) that can be detected in the survey. We will consider two possible approaches: i) a brightness-based criterion and ii) a flux-based criterion.
i) The criterion based on a threshold in brightness guarantees that halos are detected in the images generated by the survey. From this threshold we derive the flux (luminosity, z) of radio halos that can be detected by assuming a spatial distribution of their brightness. The brightness profile of giant radio halos is known to smoothly decrease with distance from the cluster center (e.g., Murgia et al. 2009) implying that the outermost, low brightness, regions of halos are very difficult to detect. However what is important is the capability to detect at least, the brightest regions, of the radio halos. Radio halos emit about half of their total radio flux within their half radius (Brunetti et al. 2007, Fig. 1). Following Cassano et al. (2010b) we estimate the minimum flux of a halo, , that can be detected in the survey by requiring that the mean halo brightness within half halo radius () is times the noise level in the map, i.e., , where is the number of independent beams within and is the rms noise per beam.
This gives:
| (9) |
where is the angular size of radio halos at a given redshift in arcseconds and is the beam angular size of the survey in arcseconds.
ii) A second possible approach to derive is to assume that the halo is detectable when the integrated flux within gives a signal to noise ratio . This is:
| (10) |
From Eq. 10 it follows
| (11) |
In the following, for a better comparison with previous works (Cassano et al. 2010b), we will consider i) as our reference approach, and will give some results also based on ii).
The number of radio halos with in the redshift interval, , can be obtained by combining the RHLF () and :
| (12) |
Estimating and is the more critical point in this procedure. Considering case i), in Cassano et al. (2008a) we analysed VLA radio observations in D-array configuration of empty fields where we injected fake radio halos in the (u,v) plane of the interferometric data; the injected radio halos were placed at z=0.1 assuming a diameter 1 Mpc. Cassano et al. concluded that radio halos become visible in the images as soon as their flux approaches that in Eq. 9 with . At redshift the number of independent beams that cover the half-radius region of the halos decreases, so based on our experience a value yields a more reliable threshold if we are interested in addressing the detection of halos over a wider redshift range, e.g., z=0-0.6. Brunetti et al. (2007) and Venturi et al. (2008) injected “fake” radio halos in the (u,v) plane of GMRT data to evaluate the flux of detectable radio halos. Based on their findings (Fig. 3 in Brunetti et al. 2007) we adopt Eq. 11 with .
As a consistency check we derive the expected number of radio halos to be detected in the NVSS up to and compare them with those derived from the cross-correlation of the XBACs sample (Ebeling et al. 1996) with the NVSS (from Giovannini et al. 1999). This is shown in Fig. 7: values of and gives a predicted number of radio halos consistent with that observed in the NVSS 555We note that case i) gives a more fair comparison because Giovannini et al. (1999) selected halos and candidate halos from the inspection of the NVSS images.. In the following we will use Eq. 9 with to compute the minimum flux of detectable radio halos, and we will provide also expectations by considering Eq. 11 with in a number of cases.
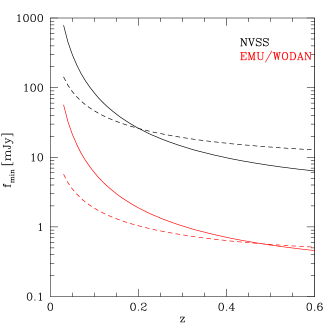
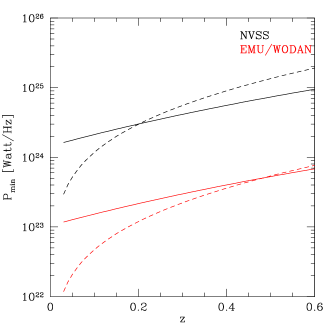
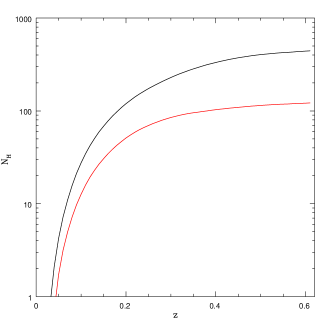
Figure. 8 shows of giant radio halos as a function of redshift (left panel), and the corresponding minimum radio luminosity (right panel), obtained according to case i) and ii). Calculations are shown for the NVSS (black upper lines) and for the EMU+WODAN survey (red lower lines). For the EMU+WODAN survey we assume Jy and arcsec 666We note that such noise level is of the same order of the confusion noise expected in this configuration, however it can be reached after subtraction of uv components of the sources detected at more than 100 in the survey images obtained at the highest resolution..
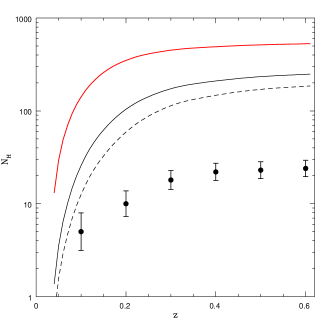
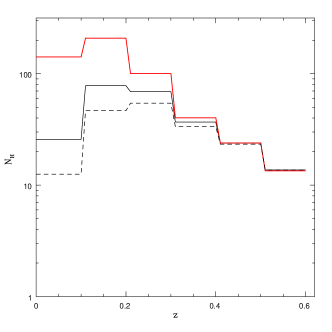
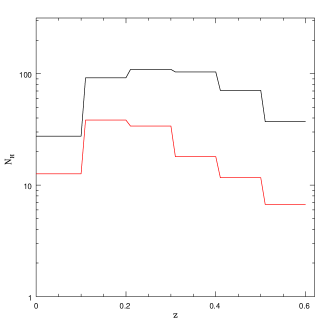
In Fig. 9, (left panel) we show the all-sky number of radio halos expected in the EMU+WODAN survey. We consider both giant radio halos that originate from turbulent re-acceleration in merging clusters and “off-state” halos assuming the optimistic case b) in Sect. 3 (see caption for details). We consider the flux limit derived according to Eq. 9 with (black lines) and report also the total number of halos expected according to Eq. 11 with (red lines).
We note that “off-state” halos are expected to contribute significantly (about 30%) to the total number of radio halos that are expected in the EMU+WODAN survey. Their contribution is larger at lower redshift ().
We predict that the EMU+WODAN survey will detect up to 100-200 radio halos in the redshift range 0–0.6. This will increase the number of presently known giant radio halos by about one order of magnitude. About 2/3 of these radio halos are expected in the redshift range (Fig.9, right panel). The number of radio halos expected in the EMU+WODAN surveys increases by a factor when considering the flux limit given by Eq. 11. This increase is due to an increasing number of “off-state” radio halos that become detectable in low redshift () clusters according to this prescription.
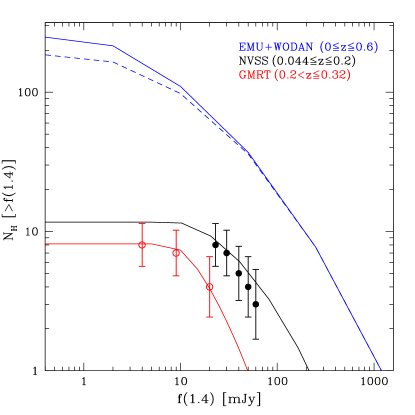
Finally, in Fig.10 we report the all-sky number distribution of the radio halos detectable by EMU+WODAN as a function of the radio flux. “Off-state” halos contribute potentially at smaller radio fluxes, mJy, i.e., at fluxes presently accessible only to deep pointed observations. To further highlight the potential improvement that will be provided by EMU+WODAN with respect to the present statistics of radio halos, in the same figure we report the number of radio halos detected in the NVSS survey (by inspection of XBAC clusters up to redshift , Giovannini et al 1999) and in the GMRT RH Survey (Venturi et al. 2007, 2008; in the redshift range 0.2-0.32). For a sanity/consistency check, the number of radio halos in present surveys are also compared with model expectations derived for turbulent giant radio halos according to Eqs.9–12 and by taking into account the specification of these surveys.
6 Comparison between LOFAR and EMU surveys
The revolutionary radio telescope LOFAR will carry out surveys between 15 MHz and 210 MHz with unprecedented sensitivity and spatial resolution (e.g., Röttgering et al. 2006), providing a breakthrough in the exploration of the Universe at the low radio frequencies. In particular the Tier 1 “Large Area” survey of the northern sky is planned to reach sensitivities 0.1 mJy/beam in the frequency range 120-190 MHz. The combination of observing frequency and sensitivity to diffuse emission of Tier 1 make this survey the most sensitive survey in the pre-SKA era for the exploration of non-thermal radio emission from galaxy clusters and large scale structure.
Based on the hypothesis that giant radio halos originate from turbulent re-acceleration in merging clusters, Cassano et al. (2010b) predict the discovery of about 400 giant radio halos at redshifts from the analysis of the Tier 1 survey data. This would increase the statistics of these sources by a factor of with respect to present day surveys. Remarkably about 1/2 of these halos are expected with a synchrotron spectral index between 250-600 MHz of , and consequently they would brighten only at low frequencies, unaccessible to both present observations and future observations with ASKAP and APERTIF.
The surveys planned with the ASKAP array and with the APERTIF onboard of WSRT will provide information complementary to that coming from LOFAR. These surveys are planned to reach a sensitivity similar to that of the Tier 1 survey in the case of extended emission with radio spectral index in the range . Their synergy with LOFAR will add considerable value to discriminate between different physical origin of giant radio halos in galaxy clusters and, in general, to constrain the evolution of cluster non-thermal components.
In this Section we shall focus on the comparison between expectations for the statistics of radio halos in LOFAR and EMU+WODAN. LOFAR surveys and EMU will overlap by about one steradiant, while WODAN will be looking at the same sky as LOFAR.
Here we calculate the expected number of giant radio halos in the LOFAR Tier 1 survey following Cassano et al. (2010b). We upgrade these calculations (i) by using merger trees from Monte Carlo simulations of cluster formation history with increased statistics with respect to what previously done (i.e., increased number of trials), and (ii) by adopting a tighter grid to sample the values of the steepening frequency of radio halos, . In addition, following Sect.3 we include the contribution to the halos statistics at 120-190 MHz from “off-state” halos in more relaxed clusters. We adopt a spectral index to estimate the radio luminosity of these halos at lower frequencies.
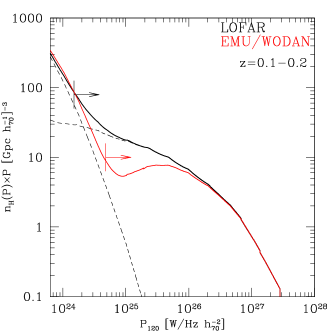
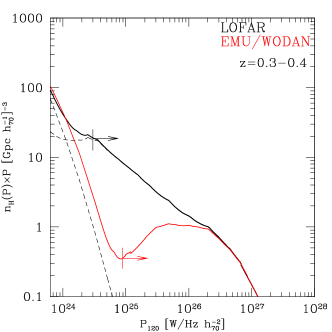
LOFAR and EMU+WODAN will observe different populations of giant radio halos, because LOFAR will explore also the population of halos with steepening frequency GHz. As a first step we calculate the RHLF of these two population of halos. As a relevant example, Fig. 11 shows the RHLF of halos with MHz (black solid lines) and that of halos with GHz (red lines) in two different redshift ranges z= (left panel) and z= (right panel). For a prompt comparison between the two populations, the luminosities of halos with GHz, which emit in the frequency band spanned by EMU+WODAN, are extrapolated at 120 MHz by assuming a spectral index . The difference between the two RHLF is maximized at higher redshift where the RHLF of high-frequency halos shows a dip at radio luminosities Watt/Hz (at 120 MHz). It reflects the difficulty of generating high-frequency giant halos via turbulent re-acceleration in the presence of stronger inverse Compton losses (higher z). Indeed those high-frequency halos can be generated at higher redshift only by very massive merging events, which however preferentially produce halos with larger radio luminosities (e.g., Eqs. 4–5). On the other hand, we find that radio halos emitting at lower frequencies can still be generated efficiently at higher redshifts. Consequently the detection at low frequencies of a number of radio halos with luminosities W/Hz in excess of that of radio halos observed at higher frequencies with luminosities W/Hz would confirm our theoretical expectations; the sensitivities of the LOFAR Tier 1 survey and of the planned EMU survey will be suitable to perform this test (Fig. 11).
At lower luminosities both the high-frequency and low-frequency RHLF are dominated by the contribution of “off-state” halos. We note that the number density of these halos at lower frequencies is slightly smaller than that at higher frequencies (red curves are slightly higher than the black curves, Fig. 11) because at lower frequencies an increasing number of clusters can generate giant radio halos via turbulent re-acceleration. In other words, some of the clusters hosting low luminosity “off-state” (“secondary”) halos become “on-state” (turbulent) when observed at LOFAR frequencies, and migrate from low to high radio luminosities in the LOFAR luminosity function. Fig. 11 shows that both LOFAR and EMU+WODAN will be able to detect “off-state” halos (assuming the optimistic case b) in Sect.3).
Since LOFAR and WODAN will be looking at the same sky with the same sky coverage, here we report a comparison between the expected number of radio halos in these two surveys. To derive the number of radio halos we follow the procedure in Sect. 5, assuming a threshold value for both LOFAR and WODAN. In Fig. 12 (left panel) we show the integral number of giant radio halos (in the LOFAR sky, i.e., in square degrees) as a function of redshift in the WODAN (red line) and LOFAR (black line) surveys, and in Fig. 12 (right panel) we report the number of radio halos in redshift intervals. The LOFAR Tier 1 survey is expected to detect about 500 radio halos, times more than WODAN. This is because of the better sensitivity of the LOFAR survey (see also Fig. 11) and from the possibility to detect low-frequency radio halos (i.e., GHz) at the frequencies spanned by LOFAR. The difference between the two surveys increases with redshift mainly due to the increasing number of low-frequency radio halos that are generated in cluster mergers at higher redshifts.
Giant radio halos with very steep spectrum (low-frequency halos) are only expected in the framework of the turbulent re-acceleration models (e.g., Cassano et al. 2006; Brunetti et al. 2008) thus unveiling a substantial population of these radio sources will promptly discriminate among different models proposed for the origin of diffuse radio emission in galaxy clusters.
7 Discussion and conclusions
In this paper we have presented results from Monte Carlo simulations to model the formation and evolution of giant radio halos in the framework of the merger-induced particle acceleration scenario (see Sec. 2) and extended previous calculations by including the contribution of secondary electrons generating “off-state” halos in more relaxed galaxy clusters (Sect. 3). To combine these two mechanisms we follow a phenomenological approach in which we assume that those clusters where turbulence is not sufficient to generate radio halos emitting at the observing frequency, , host “off-state” halos generated only by the emission from secondary electrons. We assume that presently observed giant radio halos are mainly driven by turbulent re-acceleration in merging clusters and constrain the level of the “off-state” halos using limits derived for “radio quiet” galaxy clusters (Brunetti et al. 2007; Brown et al. 2011). Under this assumption “off-state” halos are faint with luminosities typically times smaller than those of giant radio halos in turbulent/merging clusters. On the other hand, these “off-state” halos are expected to be more numerous than turbulent halos and thus they may contribute significantly to the number of radio halos in future radio surveys.
The most important expectation of turbulent re-acceleration scenarios is that the synchrotron spectrum of radio halos should become gradually steeper above a frequency, , that is determined by the competition between acceleration and energy losses and that is connected to the energetics of the merger events that generate the halos (e.g., Fujita et al. 2003; Cassano & Brunetti 2005). Consequently, in this scenario the population of radio halos is expected to be made of a complex mixture of sources with different spectra, with massive (and hot) clusters that have a tendency to generate halos with spectra flatter than those in less massive systems. Contrary to turbulent halos, “off-state” halos are expected with power-law spectra with fairly similar slopes. Consequently, surveying the sky at different radio frequencies and with appropriate sensitivities allows to disentangle these two populations.
In Sects. 2-3 we derive the expected radio halo luminosity functions (RHLF) at frequency , that account for radio halos originated from turbulent re-acceleration, with steepening frequency , and “off-state” radio halos. As a relevant case we discuss the RHLF at GHz. The RHLF is characterized by a flattening at low radio luminosity, W/Hz, due to the decrease of the efficiency of turbulent acceleration in less massive systems, and by an upturn at lower radio luminosities due to the contribution of “off-state” halos. The flattening/dip is expected to become more prominent at higher redshift due to the increase of IC losses that quench the acceleration process especially in lower massive systems.
Future radio surveys have the potential to constrain the formation and evolution of halos with cosmic time allowing for detailed tests of models. Specifically, in Sect. 5 we derive the expected number of radio halos in the EMU+WODAN survey. The EMU+WODAN surveys will probe the radio sky in the frequency range 1-2 GHz with a sensitivity 10 times better than present surveys. They will allow comparison of model predictions and observations in a totally unexplored range of radio halos luminosities and masses of the hosting clusters. A critical point in our paper is to derive a meaningful estimate of the sensitivity of these surveys to radio halo emission at different redshifts. We explore two possible ways, one based on a brightness threshold of the radio emission and another one based on a threshold in flux density. Threshold values in both cases have been estimated from the injection of “fake” radio halos in existing surveys (the GMRT RH Survey and the NVSS) under the assumption that the brightness distribution of presently known halos is representative. A better determination of the sensitivity of EMU and WODAN will become available only when ASKAP and APERTIF on WSRT will start the commissioning phase. Despite the uncertainties on survey sensitivities, the expected number of radio halos highlights the potential of the future EMU+WODAN surveys. By using a brightness based criterion for the detection of halos and assuming the expected sensitivity of EMU (Norris et al. 2011) and WODAN (Röttgering et al. 2011), rms Jy/b, we predict that these surveys will potentially discover up to 200 new giant radio halos at redshift . Most of these halos are predicted in the redshift range . This will increase the present number of known radio halos by almost a factor 10. The number of halos expected in these surveys further increases if a flux based threshold is used to estimate the sensitivity of the surveys. In particular, according to this method, more radio halos can be discovered at with respect to the case of a threshold based on brightness.
The leap forward of these surveys with respect to present observations is due to the fact that the increasing sensitivity will make possible the detection of both turbulent radio halos associated with less massive systems (or with erg/s) and of “off-state” halos in more relaxed clusters. We derive also the flux distribution of expected radio halos, showing that “off-state” halos contribute at fluxes mJy that are presently accessible only to deep pointed observations; still no clear detection of these halos has been obtained so far.
The most important step in our understanding of the physics of radio halos is expected from surveys at lower frequencies and from their combination with surveys at higher frequencies. In Sect.6 we compare model expectations for the statistics of giant radio halos at lower and higher frequencies. We upgraded previous calculations used to derive the number of radio halos at lower frequencies, MHz, (from Cassano et al. 2010b) i) by using Monte Carlo with improved statistics, and ii) by adopting a scenario based on two-populations of halos (as in Sect. 5, “off-state” and “turbulent” halos). These calculations allow us to explore the potential of the synergy between surveys at lower and higher frequencies with LOFAR and EMU/WODAN, respectively. According to the model based on turbulent re-acceleration in galaxy clusters different population of giant radio halos should become visible at different frequencies. Based on our hypothesis of two-populations of halos, also the population of “off-state” halos changes with frequencies because more clusters generate radio halos via turbulent re-acceleration at lower frequencies. We find that the LOFAR Tier 1 survey will detect about 4 times more halos than the WODAN survey, thanks to its better sensitivity and to its lower observing frequency that allows the detection of turbulent radio halos that become more frequent and luminous at lower frequencies. The majority of radio halos with very steep spectrum (i.e., lower values of ) in the LOFAR Tier 1 survey are predicted with luminosities W/Hz at 120 MHz and do not have counterparts detectable at higher frequencies. As a consequence, the RHLFs at 1.4 GHz exhibit a dip/flattening (at the luminosities W/Hz W/Hz at 1.4 GHz). The comparison between RHLFs at different frequencies is thus very important as it allows to promptly unveil the existence of different populations of radio halos. For instance, we have shown that comparing for radio halos in the LOFAR and in the WODAN surveys will allow a prompt test of the existence of radio halos with extremely steep spectra.
We predict that both the LOFAR and EMU+WODAN surveys will have the potential to unveil “off-state” radio halos, opening the possibility to study diffuse Mpc-scale emission also in more relaxed systems. This is currently impossible with present radio surveys, and will allow to better understand the effect of cluster mergers on the evolution of non-thermal radio emission in galaxy clusters.
More generally, LOFAR and EMU+WODAN surveys will allow to readily discriminate between a turbulent re-acceleration and a purely “hadronic” origin of radio halos. Indeed, if we assume that turbulence does not play a role, and all halos are of “hadronic” origin, the luminosity function of “hadronic” halos in Fig.11 should be boosted up by at least one order of magnitude to explain present number counts, implying a very larger number of halos at lower luminosities. Although a quantitative comparison between predictions derived by different authours is difficult because of the very different hypothesis on (poorly constrained) model parameters777See, for example, the large discrepancies between Sutter & Ricker (2011) and Zandanel et al. (2012) which attempt to derive expectations using the “hadronic” model with different assumptions on the B-mass scalings and cosmic ray dynamics., we stress that the most important difference between the two scenarios is in the spectral shape of halos and in its consequences. Indeed, re-acceleration models lead to the unique predictions of complex spectra, whereas in the “hadronic” models the spectra of secondary particles (and thus the synchrotron spectra) are rather power-laws which extend in principle to very high energies (frequencies). The important consequences are that in re-acceleration models i) a still hidden population of radio halos with very steep spectra is predicted to glow up at low radio frequencies (e.g., Cassano et al. 2006; Brunetti et al. 2008; Cassano et al. 2010b) and ii) the shape of the luminosity function of giant radio halos depends on the observing frequency (Fig.11); both predictions will be readily tested by future surveys at different frequencies.
7.1 Model Simplifications
Our calculations provide a first step for interpreting future surveys at the light of models that combine turbulent re-acceleration of relativistic particles and the generation of secondary electrons in the ICM. The most important simplification in our approach is that the evolution of magnetic field in the ICM does not account for the possible connection with the level of turbulence, yet the magnetic field is simply anchored to cluster mass at any redshift. Present data do not show evidence for a direct connection between the magnetic field and the cluster dynamics and turbulence (Govoni et al. 2010; Bonafede et al. 2011) thus for the aim of the present paper we prefer to keep the models as simple as possible. In this paper, we have shown results based on a reference set of model parameters (,b and ). According to Cassano et al. (2006) we expect that the general results given in the present paper should be poorly dependent on the adopted parameter values. The expected number of radio halos in a given survey is expected to change by a factor of about 2 when considering different values of parameters (see also Figs.14 and 15 in Cassano et al. 2006). Our two-population scenario for halos does not consider self-consistently the evolution of protons and of their secondaries in the ICM, rather we use a phenomenological approach based on the two “extreme situations” where halos originate from turbulence and pure hadronic collisions, respectively. Brunetti & Lazarian (2011) modeled the acceleration of relativistic protons and their secondaries in compressible MHD turbulence in a self-consistent way showing that radio halos become bright when turbulence is generated in the ICM and gradually evolve into fainter “off-state” halos when turbulence is dissipated. This complex evolution occurs in a time-scale shorter than the life-time of halos and of the hosting clusters, thus our approach still provides a valuable way to model the basic statistical properties of halos (see discussion in Cassano et al. 2010b). As a final remark, in this paper we focussed only on the case of Mpc-sized radio halos. In reality, smaller halos could be generated in dynamically disturbed and relaxed systems by several mechanisms, including turbulent re-acceleration in sloshing cores and in the region of AGN-driven bubbles (Cassano et al. 2008b; Mazzotta & Giacintucci 2008; ZuHone et al. 2012), reconnection regions (Lazarian & Brunetti 2011) and hadronic collisions (Pfrommer & Enßlin 2004; Keshet & Loeb 2010). All these halos constitute an additional population of diffuse synchrotron source in galaxy cluster to investigate with future radio surveys.
Finally, it’s worth mentioning that there are a few radio halos found in clusters with X-ray luminosity lower than that of typical radio-halo clusters, that are over-luminous in radio (by about one order of magnitude) with respect to the radio-X-ray luminosity correlation (e.g., Giovannini et al. 2011 and ref. therein). These halos have radio luminosities similar to those of classical radio halos and are hosted in clusters that are more common than the very massive systems hosting classical radio halos. Consequently, their observed rarity suggests that they could be intrinsically rare. For this reason in our model we do not attempt to take into account these sources; future surveys (LOFAR, EMU/WODAN) are necessary to get a firm conclusion on the occurrence of these sources in clusters.
Acknowledgements.
We thank the referee for useful comments. RC and GB acknowledge partial support by PRIN- INAF2009 and ASI-INAF I/088/06/0.References
- Ackermann et al. (2010) Ackermann, M., Ajello, M., Allafort, A., et al. 2010, ApJ, 717, L71
- Aleksić et al. (2012) Aleksić, J., Alvarez, E. A., Antonelli, L. A., et al. 2012, A&A, 541, A99
- Berezinsky et al. (1997) Berezinsky, V. S., Blasi, P., & Ptuskin, V. S. 1997, ApJ, 487, 529
- (4) Blasi P., 2001, APh 15, 223
- Blasi & Colafrancesco (1999) Blasi, P., & Colafrancesco, S. 1999, Astroparticle Physics, 12, 169
- Bonafede et al. (2011) Bonafede, A., Govoni, F., Feretti, L., et al. 2011, A&A, 530, A24
- Brown & Rudnick (2011) Brown, S., & Rudnick, L. 2011, MNRAS, 412, 2
- Brown et al. (2011) Brown, S., Emerick, A., Rudnick, L., & Brunetti, G. 2011, ApJ, 740, L28
- Brunetti (2011) Brunetti, G. 2011a, Mem. Soc. Astron. Italiana, 82, 515
- Brunetti (2011) Brunetti, G. 2011b, Journal of Astrophysics and Astronomy, 32, 437
- (11) Brunetti G., Setti G., Feretti L., Giovannini G., 2001, MNRAS 320, 365
- (12) Brunetti, G.; Venturi, T.; Dallacasa, D., 2007, et al. ApJ, 670, 5
- (13) Brunetti, G., Giacintucci, S., Cassano, R., et al. 2008, Nature, 455, 944
- Brunetti et al. (2009) Brunetti, G., Cassano, R., Dolag, K., & Setti, G. 2009, A&A, 507, 661
- Brunetti & Lazarian (2011) Brunetti, G., & Lazarian, A. 2011a, MNRAS, 412, 817
- Brunetti & Lazarian (2011) Brunetti, G., & Lazarian, A. 2011b, MNRAS, 410, 127
- (17) Buote D.A, 2001, ApJ 553, 15
- (18) Cassano R. & Brunetti G., 2005, MNRAS 357, 1313
- (19) Cassano R., Brunetti G., Setti G., 2006, MNRAS 369,1577
- (20) Cassano, R.; Brunetti, G.; Venturi, T., 2008a, et al. A&A, 480, 687
- Cassano et al. (2008) Cassano, R., Gitti, M., & Brunetti, G. 2008b, A&A, 486, L31
- (22) Cassano, R., Ettori, S., Giacintucci, S., et al. 2010a, ApJ, 721, L82
- (23) Cassano, R., Brunetti, G., Röttgering, H. J. A., & Brüggen, M. 2010b, A&A, 509, A68
- (24) Condon J.J., Cotton W.D., Greisen E.W., et al. 1998, AJ 115, 1693
- (25) Dennison B., 1980, ApJ 239
- Dolag et al. (2002) Dolag, K., Bartelmann, M., & Lesch, H. 2002, A&A, 387, 383
- Donnert et al. (2010) Donnert, J., Dolag, K., Brunetti, G., Cassano, R., & Bonafede, A. 2010, MNRAS, 401, 47
- (28) Ebeling H., Voges W., Bohringer H., et al. 1996, MNRAS 281, 799
- Ellingson et al. (2009) Ellingson, S. W., Clarke, T. E., Cohen, A., et al. 2009, IEEE Proceedings, 97, 1421
- Ensslin et al. (1997) Enßlin, T., Biermann, P. L., Kronberg, P. P., & Wu, X.-P. 1997, ApJ, 477, 560
- Enßlin et al. (2011) Enßlin, T., Pfrommer, C., Miniati, F., & Subramanian, K. 2011, A&A, 527, A99
- Feretti et al. (2004) Feretti, L., Brunetti, G., Giovannini, G., et al. 2004, Journal of Korean Astronomical Society, 37, 315
- Feretti et al. (2012) Feretti, L., Giovannini, G., Govoni, F., & Murgia, M. 2012, A&A Rev., 20, 54
- (34) Ferrari, C., Govoni, F., Schindler, S., Bykov, A. M., Rephaeli, Y., 2008, Space Science Reviews, 134, 93
- (35) Fujita Y., Takizawa M., Sarazin C.L., 2003, ApJ 584, 190
- (36) Giovannini G., Tordi M., Feretti L., 1999, NewA 4, 141
- Giovannini et al. (2009) Giovannini, G., Bonafede, A., Feretti, L., et al. 2009, A&A, 507, 1257
- Giovannini et al. (2011) Giovannini, G., Feretti, L., Girardi, M., et al. 2011, A&A, 530, L5
- Govoni et al. (2001) Govoni, F., Feretti, L., Giovannini, G., et al. 2001, A&A, 376, 803
- (40) Govoni F., Markevitch M., Vikhlinin A., et al. 2004, ApJ 605, 695
- Govoni et al. (2010) Govoni, F., Dolag, K., Murgia, M., et al. 2010, A&A, 522, A105
- Jeltema & Profumo (2011) Jeltema, T. E., & Profumo, S. 2011, ApJ, 728, 53
- (43) Johnston, S., et al. 2008, Experimental Astronomy, 22, 151
- Keshet & Loeb (2010) Keshet, U., & Loeb, A. 2010, ApJ, 722, 737
- Kushnir et al. (2009) Kushnir, D., Katz, B., & Waxman, E. 2009, J. Cosmology Astropart. Phys., 9, 24
- Lazarian & Brunetti (2011) Lazarian, A., & Brunetti, G. 2011, Mem. Soc. Astron. Italiana, 82, 636
- (47) Lacey, C., & Cole, S. 1993, MNRAS, 262, 627
- Mazzotta & Giacintucci (2008) Mazzotta, P., & Giacintucci, S. 2008, ApJ, 675, L9
- Murgia et al. (2009) Murgia, M., Govoni, F., Markevitch, M., et al. 2009, A&A, 499, 679
- (50) Norris, R. P., Hopkins, A. M., Afonso, J., et al. 2011, PASA, 28, 215
- Oosterloo et al. (2010) Oosterloo, T., Verheijen, M., & van Cappellen, W. 2010, ISKAF2010 Science Meeting,
- (52) Petrosian V., 2001, ApJ 557, 560
- Pfrommer & Enßlin (2004) Pfrommer, C., & Enßlin, T. A. 2004, A&A, 413, 17
- (54) Press W.H., Schechter P., 1974, ApJ 187, 425
- Röttgering (2010) Röttgering, H. J. A. 2010, ISKAF2010 Science Meeting
- (56) Röttgering, H. J. A.; Braun, R.; Barthel, P. D., et al. 2006, proceedings of the conference “Cosmology, galaxy formation and astroparticle physics on the pathway to the SKA”, Oxford, April 10-12 2006, astro-ph/0610596
- Röttgering et al. (2011) Röttgering, H., Afonso, J., Barthel, P., et al. 2011, Journal of Astrophysics and Astronomy, 32, 557
- Sarazin (2004) Sarazin, C. L. 2004, Journal of Korean Astronomical Society, 37, 433
- (59) Schuecker P., Böhringer H.; Reiprich T.H., Feretti L., 2001, A&A 378, 408
- Sutter & Ricker (2011) Sutter, P. M., & Ricker, P. M. 2011, arXiv:1110.2786
- Tingay et al. (2012) Tingay, S. J., Goeke, R., Bowman, J. D., et al. 2012, arXiv:1206.6945
- van Weeren et al. (2012) van Weeren, R. J., Röttgering, H. J. A., Rafferty, D. A., et al. 2012, A&A, 543, A43
- (63) Venturi, T. 2011, Mem. Soc. Astron. Italiana, 82, 499
- (64) Venturi T., Giacintucci S., Brunetti G., et al. 2007, A&A 463, 937
- (65) Venturi, T., Giacintucci, S., Dallacasa, et al. 2008, A&A, 484, 327
- Völk et al. (1996) Völk, H. J., Aharonian, F. A., & Breitschwerdt, D. 1996, Space Sci. Rev., 75, 279
- Zandanel et al. (2012) Zandanel, F., Pfrommer, C., & Prada, F. 2012, arXiv:1207.6410
- ZuHone et al. (2012) ZuHone, J., Markevitch, M., Brunetti, G., & Giacintucci, S. 2012, arXiv:1203.2994