A blurred reflection interpretation for the intermediate flux state in Mrk 335
Abstract
As part of a long term monitoring campaign of Mrk 335, deep XMM-Newton observations catch the narrow-line Seyfert 1 galaxy (NLS1) in a complex, intermediate flux interval as the active galaxy is transiting from low- to high-flux. Other works on these same data examined the general behaviour of the NLS1 (Grupe et al. ) and the conditions of its warm absorber (Longinotti et al. ). The analysis presented here demonstrates the X-ray continuum and timing properties can be described in a self-consistent manner adopting a blurred reflection model with no need to invoke partial covering. The rapid spectral variability appears to be driven by changes in the shape of the primary emitter that is illuminating the inner accretion disc around a rapidly spinning black hole (). While light bending is certainly prominent, the rather constant emissivity profile and break radius obtained in our spectral fitting suggest that the blurring parameters are not changing as would be expected if the primary source is varying its distance from the disc. Instead changes could be intrinsic to the power law component. One possibility is that material in an unresolved jet above the disc falls to combine with material at the base of the jet producing the changes in the primary emitter (spectral slope and flux) without changing its distance from the disc.
keywords:
galaxies: active – galaxies: nuclei – galaxies: individual: Mrk 335 – X-ray: galaxies1 Introduction
The narrow-line Seyfert 1 galaxy (NLS1), Mrk 335 (), has always been the subject of intense scrutiny. As one of the brighter active galactic nuclei (AGNs) in the X-ray sky it has been observed by most major missions so its long term behaviour is relatively well established (Grupe et al. 2008). Its X-ray continuum has normally been described with a power law and soft-excess (e.g. Pounds et al. 1987). More sensitive observations revealed a narrow emission line around along with a broader emission feature in the Fe K region. The combination of the soft excess and broad emission feature is indicative of reflection from the inner region of an ionised disc (e.g. Ross & Fabian 2005) and such models have been successful in fitting the spectra of Mrk 335 (e.g. Ballantyne, Iwasawa & Fabian 2001; Crummy et al. 2006; O’Neill et al. 2007; Longinotti et al. 2007; Larsson et al. 2008).
A 2007 Swift snap-shot of Mrk 335 found the NLS1 in an unprecedented low state where the X-ray flux had diminished to about 1/30 of the previously lowest observed flux state (Grupe et al. 2007). The Swift observation showed considerable curvature in the X-ray spectrum, and simultaneous optical data found that the AGN was in an X-ray weak state. Both factors are indicative of either absorption or reflection dominating the spectrum (Gallo 2006). The Swift observation prompted a XMM-Newton Target of Opportunity observation that revealed low-energy emission lines from a photoionised gas likely originating far from the inner accretion disc and close to the broad line region (Grupe et al. 2008; Longinotti et al. 2008). During this low state the continuum could be described equally well as arising from either partial covering or blurred reflection (Grupe et al. 2008).
Since 2007 Mrk 335 has undergone continuous monitoring with Swift. The AGN has exhibited significant UV and X-ray variability while remaining in a moderately low X-ray flux state. A deep pointed XMM-Newton observation in 2009 attempted to catch the AGN in a minimum in order to study the properties of the photoionised gas observed in the 2007 low state; however, the AGN was instead caught in a transition as it brightened to an intermediate flux level (Grupe et al. 2012, hereafter G12). Interestingly, while the emitting gas is less evident in this intermediate state due to the higher continuum flux compared to the 2007 low state, a warm absorber is now clearly detected (G12; Longinotti et al. 2012, hereafter L12). Based on their analysis of the RGS data, L12 describe the warm absorber as a combination of three different zones with distinct temperatures and ionisation parameters. However, the RGS analysis shows that the ionized gas does not produce the variability observed during this intermediate flux state. The curvature in the X-ray spectrum again could be described by partial covering prompting the suggestion that clouds of absorbing material have been entering the line of sight since 2007 and variations in covering fraction are responsible for the recent low state and variability exhibited by Mrk 335 (G12). Grupe et al. (2008) point to Tanaka et al. (2005) for a partial covering explanation of Mrk 335 in the high-flux state when the covering fraction would have been low.
If the recent diminished flux is due to increased photoelectric absorption from additional partial covering, then it should be accompanied by increased emission in the narrow Fe K line (e.g. Reynolds et al. 2009). G12 find that within uncertainties the Fe K flux in Mrk 335 is identical in the intermediate- and low-flux states, both of which are comparable (perhaps even lower) than the Fe K flux reported by Grupe et al. (2008) in the high-flux state. In addition, one may expect to find markers of absorption in the UV. There is some indication of absorption in a recent HST-COS spectrum of Mrk 335 (L12). However if and how this is linked to any absorption in the X-ray is difficult to establish since the UV and X-ray observations were not simultaneous.
In this work we test the blurred reflection interpretation for Mrk 335 when the AGN is in an intermediate low-flux state and is significantly modified by a warm absorber, to determine if partial covering is necessary to describe the behaviour of the source in recent years. The observations and data reduction are described in the following section. Spectral modelling is explored in Section 3 and the temporal analysis is described in Section 4. We discuss and summarize our results in Section 5 and 6, respectively.
2 Observations and data reduction
Mrk 335 has been observed with XMM-Newton (Jansen et al. 2001) on five occasions between 2000 and 2009. In this work we report on the long 200 ks observation spread over two consecutive orbits (revolutions 1741 and 1742) in 2009. During the observations the EPIC pn detector (Strüder et al. 2001) was operated in large-window mode and with the thin filter in place. The MOS (MOS1 and MOS2; Turner et al. 2001) cameras were operated in full-frame mode and with the medium filter. The Reflection Grating Spectrometers (RGS1 and RGS2; den Herder et al. 2001) also collected data during these observations, as did the Optical Monitor (OM; Mason et al. 2001). The OM data have been presented in G12 and will not be reanalyzed in this work. These data will be discussed as needed. The RGS analysis is the subject of an in-depth study of the warm absorber (L12). We will incorporate the results of L12 in this work, but we will not reanalysis the RGS data here.
The XMM-Newton Observation Data Files (ODFs) from each observations were processed to produce calibrated event lists using the XMM-Newton Science Analysis System (SAS v11.0.0). Unwanted hot, dead, or flickering pixels were removed as were events due to electronic noise. Event energies were corrected for charge-transfer inefficiencies. Light curves were extracted from these event lists to search for periods of high background flaring and such periods have been neglected. Pile-up was negligible during the observations. The background photons were extracted from an off-source region on the same CCD. Single and double events were selected for the pn detector, and single-quadruple events were selected for the MOS. EPIC response matrices were generated using the SAS tasks ARFGEN and RMFGEN. The MOS and pn data at each epoch were compared for consistency and determined to be in agreement within known uncertainties (Guainazzi et al. 2010) as was the case in G12. For simplicity we will only present the pn data at each epoch. The total amount of good exposure for the pn during revolution 1741 and 1742 is 96.4, and , respectively.
The XMM-Newton X-ray spectra were grouped such that each bin contained at least 30 counts. Spectral fitting was performed using XSPEC v12.7.1 (Arnaud 1996). All parameters are reported in the rest frame of the source unless specified otherwise. Figures remain in the observed frame and are binned for display purposes only. Unless stated otherwise, black, open symbols identify data from revolution 1741; and filled, red squares represent data from orbit 1742. The quoted errors on the model parameters correspond to a 90% confidence level for one interesting parameter (i.e. a = 2.7 criterion). A value for the Galactic column density toward Mrk 335 of (Kalberla et al. 2005) is adopted in all of the spectral fits and abundances are from Anders & Grevesse (1989). Luminosities are calculated using a Hubble constant of = and a standard flat cosmology with = 0.3 and = 0.7.
3 Spectral Modeling
3.1 The high-energy spectral region
The band in Mrk 335 typically displays curvature both in the high- and low-flux states that can be attributed to blurred reflection (e.g. O’Neill et al. 2007; Larsson et al. 2008; Grupe et al. 2008) or partial covering (e.g. Grupe et al. 2008; G12). Narrow features have also been detected. A narrow emission line arising from Fe K is regularly observed, while narrow emission features from a highly ionized plasma (Fe xxvi Ly-, O’Neill et al. 2007) or absorption features attributed to relativistic inflows (Longinotti et al. 2007) are transient.
The spectrum from each epoch was fitted with a power law and a second component to mimic distant reflection. For the distant reflector we consider two models, pexmon (Nandra et al. 2007) and reflionx (Ross & Fabian 2005). Both models self-consistently include Fe K, the Compton shoulder, and Compton hump. In addition, pexmon includes Fe K and Ni K emission. However, pexmon is for reflection off neutral material and does not consider the features that arise below the iron-K band. For reflionx the material is also considered nearly neutral as the ionisation parameter (, where is the incident flux and is the density of the gas) was set to (the lowest allowed by the model). Iron abundance is also fixed to the solar value. While there is evidence that the inner accretion disc can show super-solar iron abundances (e.g. Fabian et al. 2009; Reynolds et al. 2012) it is not obvious that this characteristic extends to the distant reflector. However, we note that Walton et al. (2012a) was able to model the Suzaku spectrum of Mrk 335 when they allowed the distant reflector (torus) and the inner accretion disc to share common abundances.
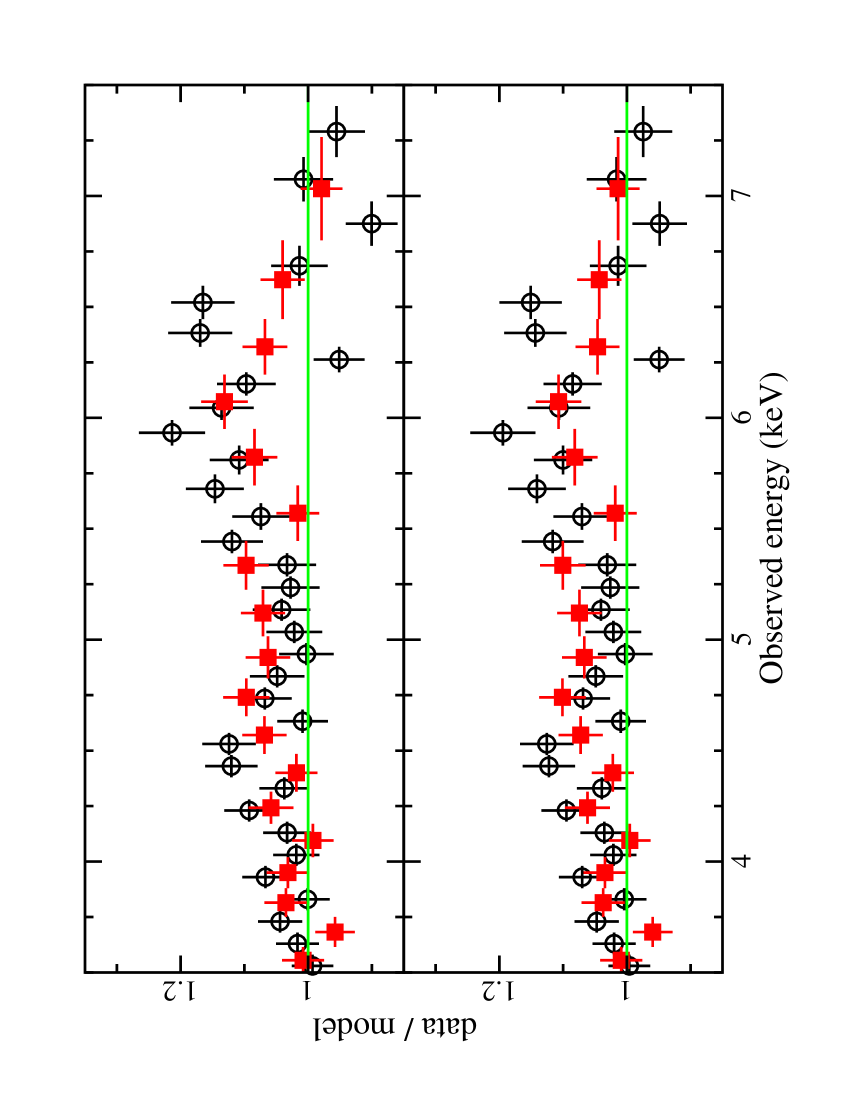
Statistically the models fit reasonably well ( and for the pexmon and reflionx, respectively), but both models show excess in the residuals between (Fig. 1). G12 interpreted this excess as evidence for partial covering, we examine this in terms of blurred, ionised reflection from the inner accretion disc. Adding a single Laor profile to both models improved the fits () and residuals significantly in both cases. The equivalent width of the line is in both models. The fitted line parameters are the energy (), disc emissivity index (), inner disc radius (, []), and disc inclination (). We do not examine these parameters in detail at this point as they will serve as initial values for more realistic models in the remaining analysis.
3.2 The mean spectrum
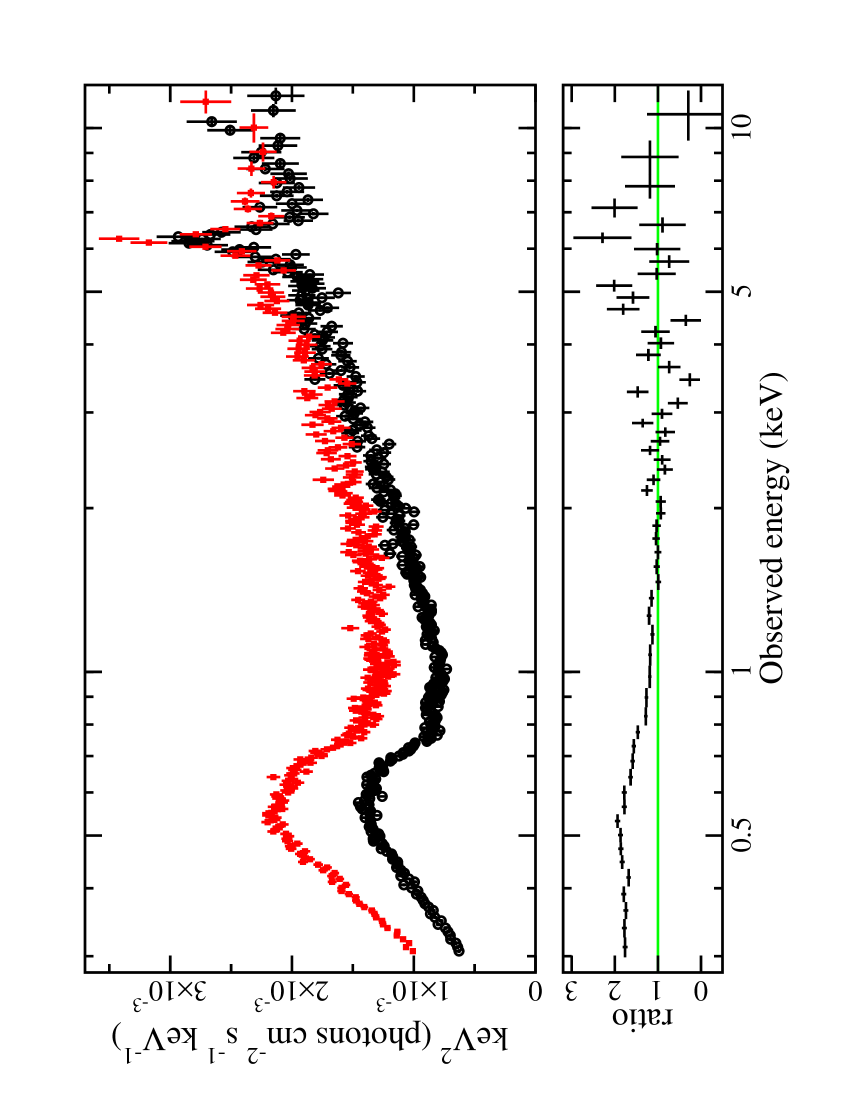
As seen in Fig. 2 the average spectrum undergoes significant changes between revolution 1741 and 1742. The difference between the two spectra (i.e. rev. 1742 – rev. 1741) fitted with an absorbed power law () between and extrapolated to lower energies is shown in the lower panel of Fig. 2. The changes are substantial below , but there is also indication for variability above . For this reason we will treat the data from each epoch separately when examining the spectra.
There is a significant warm absorber present at both epochs, which is clearly seen in the RGS spectra, and is the subject of other work (L12). This is the first time that a warm absorber has been unambiguously observed in Mrk 335. L12 identified three distinct ionized components, all outflowing at high velocity (). However, since L12 determined that the warm absorber itself is not variable during these observations, it cannot be the warm absorber that is responsible for the changes seen in Fig. 2. To remain consistent with the RGS analysis, we constructed XSTAR (Kallman & Bautista 2001) grids that are comparable with the three warm absorbers found in L12. These components are included in our spectral fitting and are linked between the epochs.
The neutral reflector originating from distant matter is modelled with reflionx rather than pexmon since it offers a more complete treatment of the reflection at low energies. This component should not be confused with the reflection from the inner disc as it is not subject to any blurring effects. The ionisation parameter of this distant reflector is fixed at (i.e. the lowest value permitted by the model) and the iron abundance is fixed to solar. The photon index of the ionising power law is fixed to the canonical value of (Nandra & Pounds 1994). It is not clear if this assumption is accurate as the photon index is clearly variable in Mrk 335 (e.g. have been reported). It is also not obvious that the torus would be illuminated by the same power law that is seen by the observer since the line-of-sight through the corona, and hence the optical depth is likely different from each perspective. The normalisation of this component is linked at both epochs.
In the 2007 low flux state observation, Grupe et al. (2008) and Longinotti et al. (2008) identified narrow emission features attributed to a distant photoionised plasma. The CCD spectra were fitted with a MEKAL model to account for this emission (Grupe et al. 2008), but the fitting was rather ad hoc and did not account for some of the strongest features in the spectrum (e.g. a emission feature and the narrow Fe K emission line). Such emission is not prominent in the 2009 RGS data (L12) and this could simply be a matter of the higher continuum flux overwhelming the hot, diffuse plasma. We do not specifically consider the reasonable assumption that a constant MEKAL component (e.g. fixed to the 2007 values) is present in these 2009 data, but we note that the distant reflector modelled by the unblurred reflionx component can similarly describe this emission. The flux of the MEKAL component in the low-flux spectrum was , comparable to the flux of the distant reflector used in these models (see Table LABEL:tab:fits).
After fitting the three-phase warm absorber to the RGS data, L12 attributed the remaining residuals between about to intrinsically narrow emission corresponding to O viii and N vii Ly-, as well as the O vii triplet. Adding Gaussian profiles with fixed energies and widths, but free normalisations, to the CCD data did not result in any detection of these features. For each line, the measured equivalent width was . Including the Gaussian features with all parameters fixed to the RGS measured values generated an entirely comparable fit to the one presented in Table LABEL:tab:fits.
The broadband continuum is described with a power law plus reflection from the accretion disc. It is then modified by a three-zone warm absorber and a distant neutral absorber. The reflection component is blurred for dynamical effects in the disc close to the black hole using kdblur2 with a broken power law emissivity profile. The objective was to obtain a self-consistent model that described both observations. Despite the significant variability the observations were separated by only , consequently we were selective in what we allowed to vary between the observations. In addition to the distant reflector, the inclination (), iron abundance (), inner () and outer () disc radius were linked between the observations. Initial fits were conducted with the inner emissivity profile () and the break radius () free to vary at each epoch. The outer emissivity profile () was fixed to 3 as would be expected in the case for illumination of the disc from a distant source. Finding no significant differences in the values of and during revolution 1741 and 1742, the parameters were also linked in subsequent fits. The best-fitting model reported here allow only the photon index and normalisation of the power law component; and the ionisation and normalisation of the reflector to vary at each epoch.
| (1) | (2) | (3) | (4) |
|---|---|---|---|
| Model Component | Model Parameter | 1741 | 1742 |
| Warm Absorber 1 | () | ||
| log [] | |||
| Warm Absorber 2 | () | ||
| log [] | |||
| Warm Absorber 3 | () | ||
| log [] | |||
| Power law | |||
| log | |||
| Blurring | |||
| () | |||
| () | |||
| () | |||
| (∘) | |||
| Reflection | () | ||
| (Fe/solar) | |||
| log | |||
| Distant Reflector | () | ||
| (Fe/solar) | |||
| log | |||
| Fit Quality |
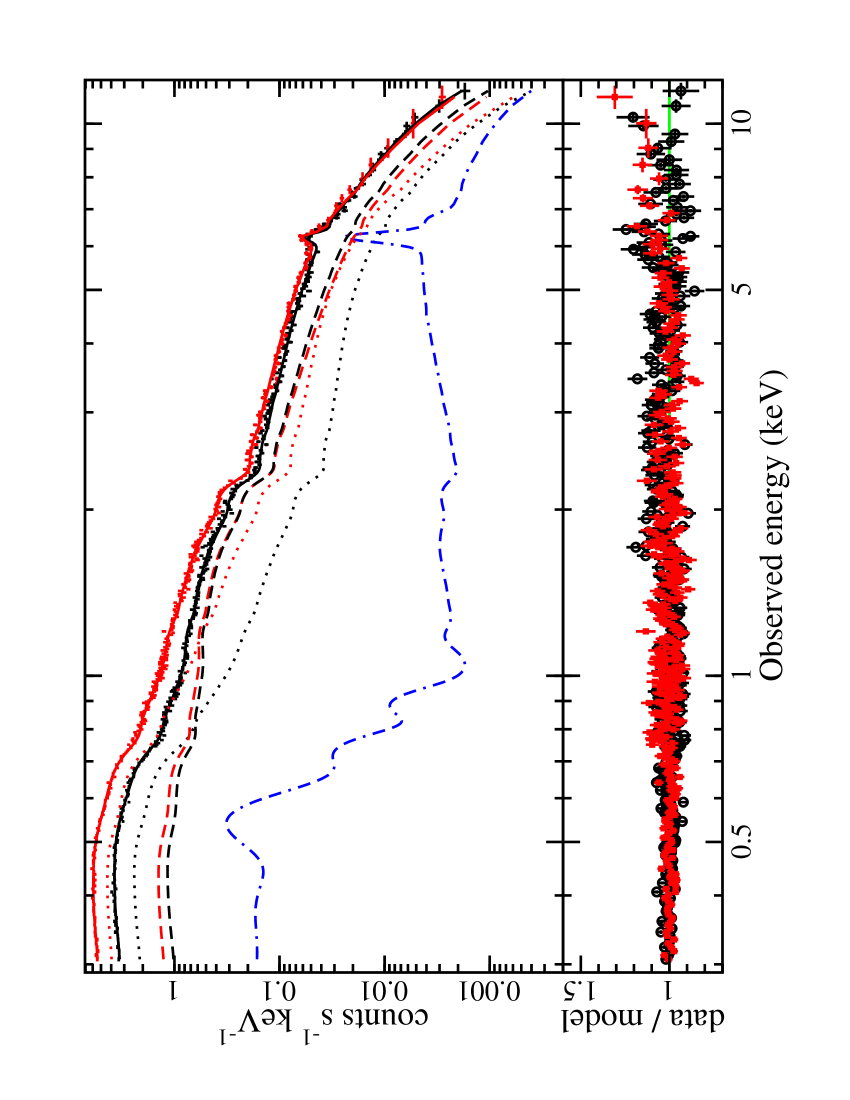
The model adequately fits the data (). The model parameters and fit are shown in Table LABEL:tab:fits and Fig. 3, respectively. The reflection model makes specific predictions of the spectral appearance above . While simultaneous observations above do not exist, the average Swift BAT spectrum is available for comparison (Fig. 4). The Swift data agree well with blurred reflection spectral model.
The differences between the two epoch require changes in the normalisations as well as the shape of the reflection and power law components. In contrast to typical observations the reflection component appears more dominant during revolution 1742 when the AGN is in a higher flux state.
3.3 Black hole spin
In accordance with the small inner radius found in the fit (Table LABEL:tab:fits) a high black hole spin value is expected in Mrk 335. In order to estimate the black hole spin we conservatively concentrate efforts on the high-energy spectrum above . When fitting the broadband spectrum the spin value is often highly dependent on the interpretation and modeling of the smooth soft excess where the statistics are highest, and as we know from L12, this region is significantly modified by the three-zone warm absorber.
We begin with the power law plus distant reflector model described in Section 3.1. To this we add a reflector that is blurred using kerrconv (Brenneman & Reynolds 2006; instead of kdblur2), which includes black hole spin as a model parameter. As in the broadband spectral analysis, all model parameters are tied except for the power law photon index and normalisation, and the blurred reflector ionisation and normalisation. A good fit to the data is found () with all model parameters in agreement with the broadband results in Table LABEL:tab:fits (albeit with larger uncertainties).
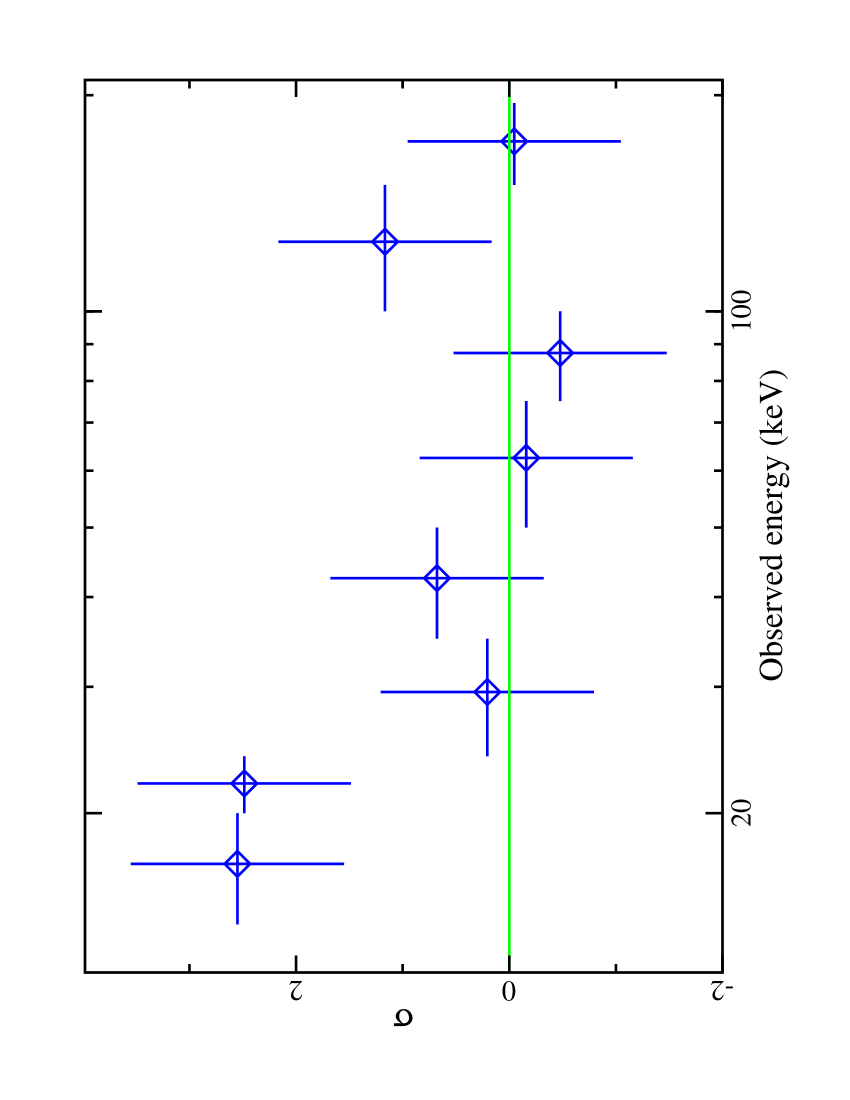
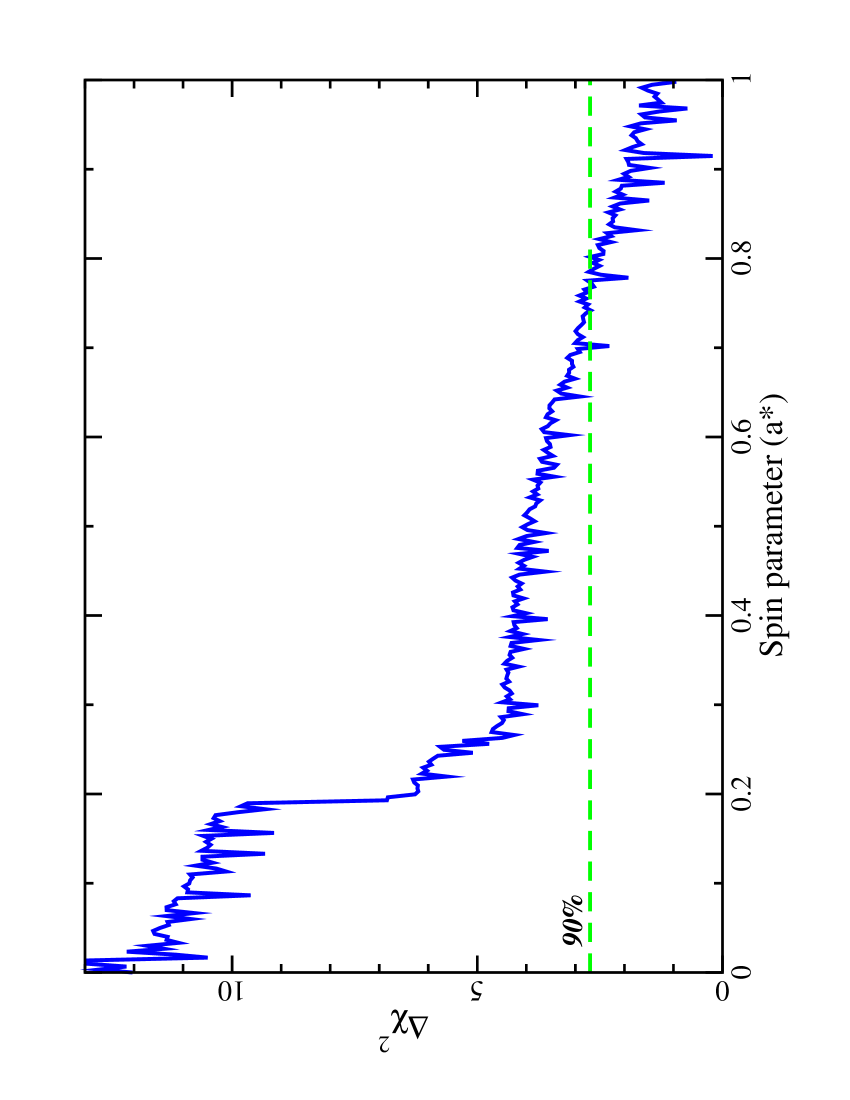
In order to estimate the uncertainty on the measured spin we examine the variation in the quality of the fit associated with the changes in the spin parameter (Fig. 5). Relatively high spin values are preferred by the fit () at 90 per cent confidence. Very low spin values () are rejected at the level. The spin parameter measured from these data of Mrk 335 in a warm absorber dominated, intermediate flux state is in agreement with that measured by Walton et al. (2012a) using Suzaku XIS and PIN spectra of Mrk 335 in an unabsorbed, high-flux state (), and commensurate with the small inner disc radius found by Crummy et al. (2006).
4 X-ray variability
G12 reported significant flux and spectral variability over the intermediate flux level observations examined here (see their Fig. 5). We attempt to describe the variability in Mrk 335 based on the blurred reflection model presented in Section 3.2. As noted in Section 3.2, variability is seen in power law normalisation and shape as well as in the ionisation and flux of the reflector. Here we examine how the model can account for the spectral variability as a function of time and flux level.
4.1 Flux resolved spectroscopy
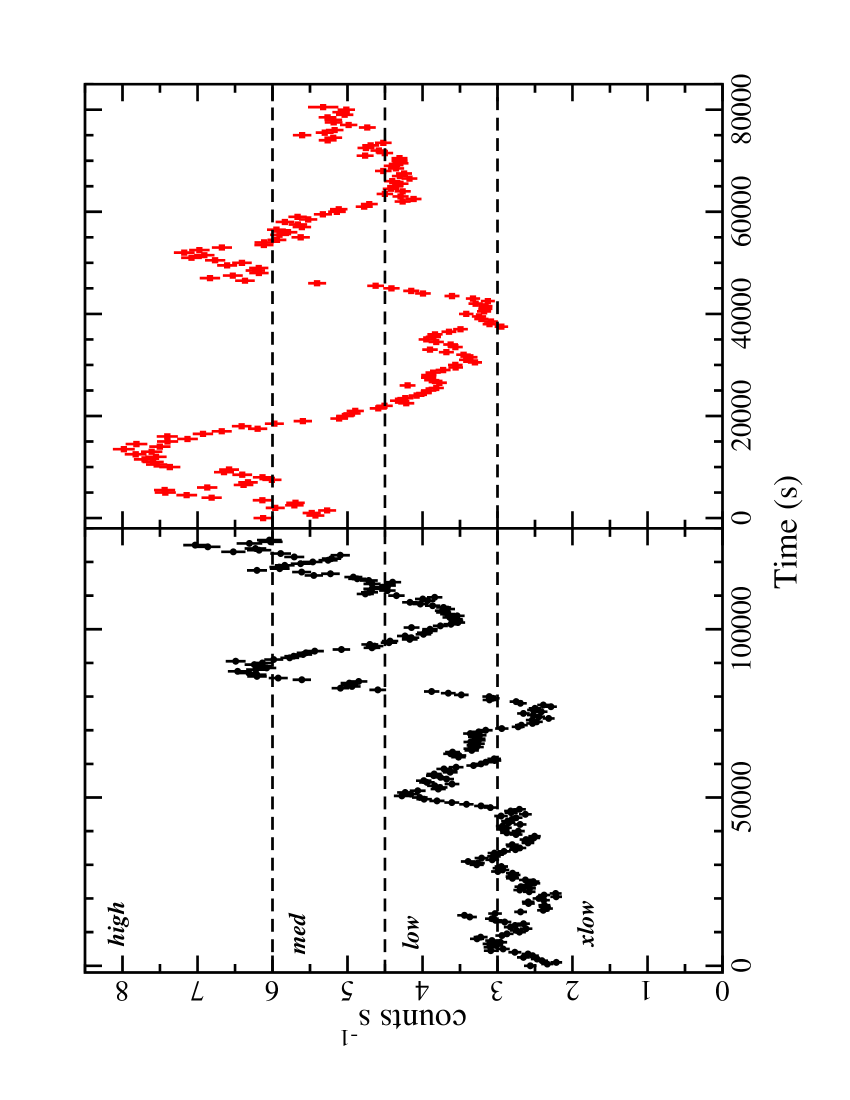
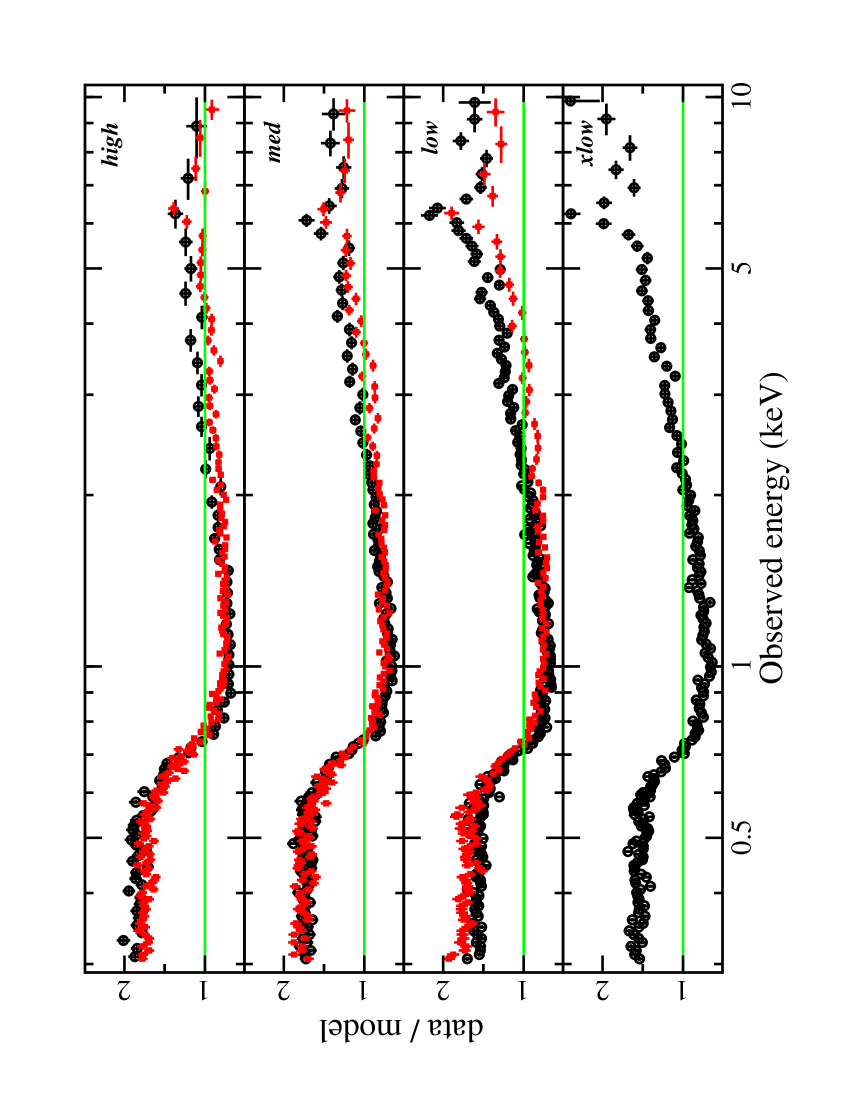
Spectra are created in four flux bins during revolution 1741 and three flux bins during revolution 1742, as defined in Fig. 6. The high-, medium-, and low-flux states are defined identically in 1741 and 1742. The extra-low-flux state (i.e. xlow) is unique to 1741 as the AGN brightness does not dip to this level during 1742. In Fig. 7 we plot the spectra from each flux state against a power law () absorbed by Galactic column density. Despite the comparable brightness the flux-resolved spectra differ notably between 1741 and 1742.
The various flux states during each orbit were fitted simultaneously using the best-fit model from Section 3.2 as the starting condition. The warm absorber and distant reflector parameters were fixed to their average values. Initially, the blurring parameters and were free, but since neither demonstrated noticeable variability they were fixed to their average values as well. The only free parameters were the photon index of the power law continuum, ionisation parameter of the reflector, and the normalisation of both components.
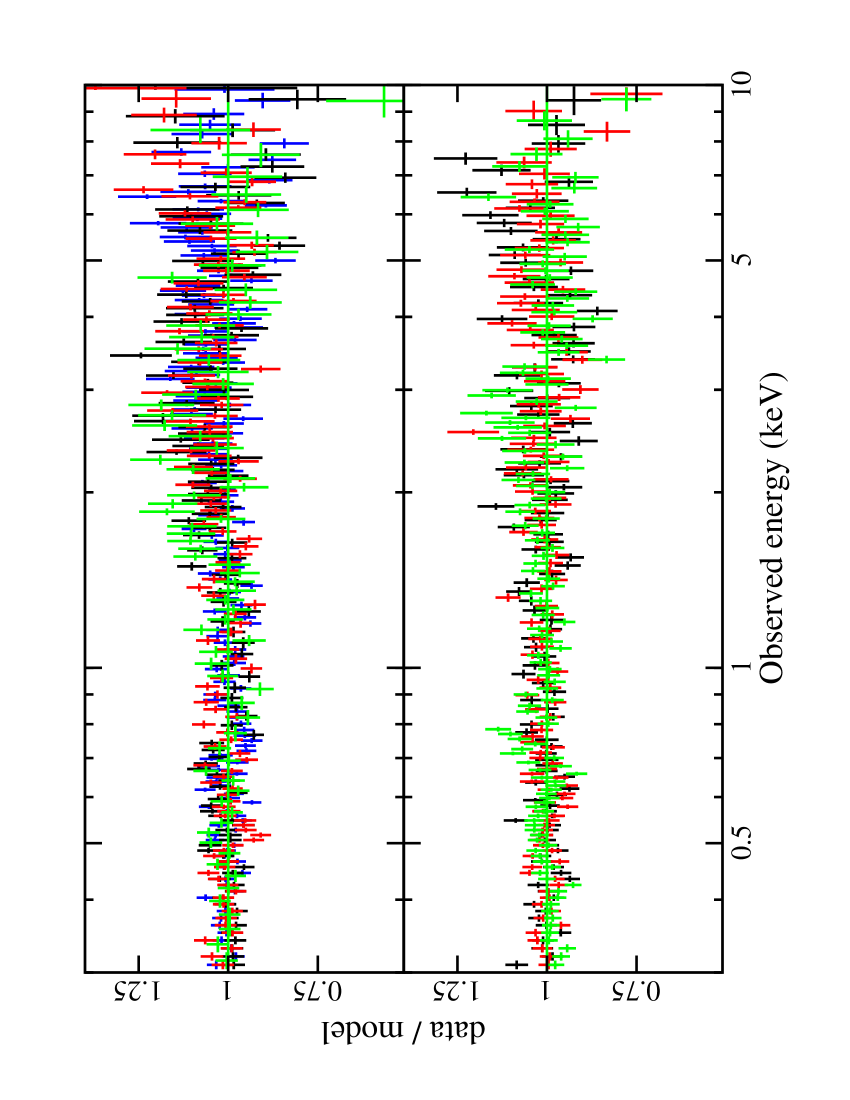
The spectral variations are well fitted by allowing only these parameters to vary ( for revolution 1741 and for revolution 1742). The residuals from the fits are shown in Fig. 8. Some trends resulting from fitting the flux-resolved spectra are shown in Fig. 9. As found when modelling the average spectra, the ionisation parameter of the blurred reflector is distinctly higher during revolution 1742. This is seen in the flux-resolved spectra as well; however, there does not appear to be a gradual change with increasing flux that might be expected (Fig 9a). We note the telescope does not collect data for between revolution 1741 and 1742, which makes it difficult to draw strong conclusions as to when the change in the ionisation parameter occurs.
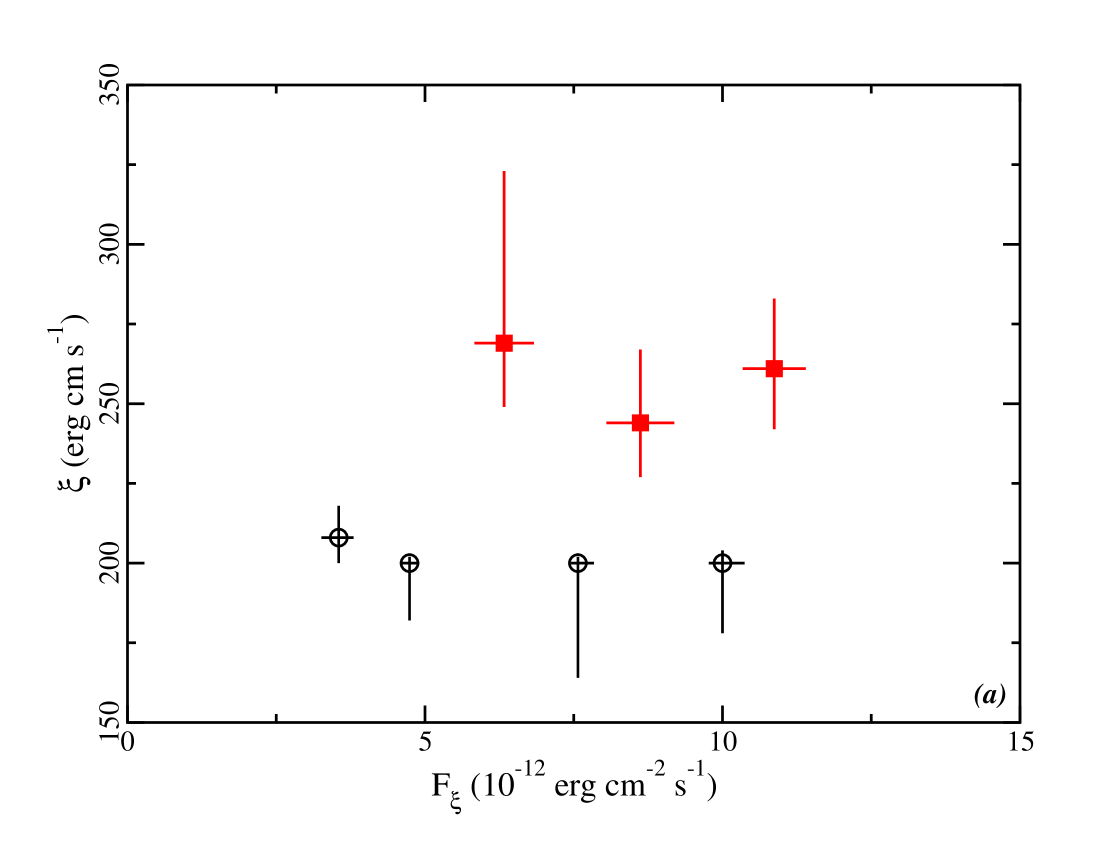
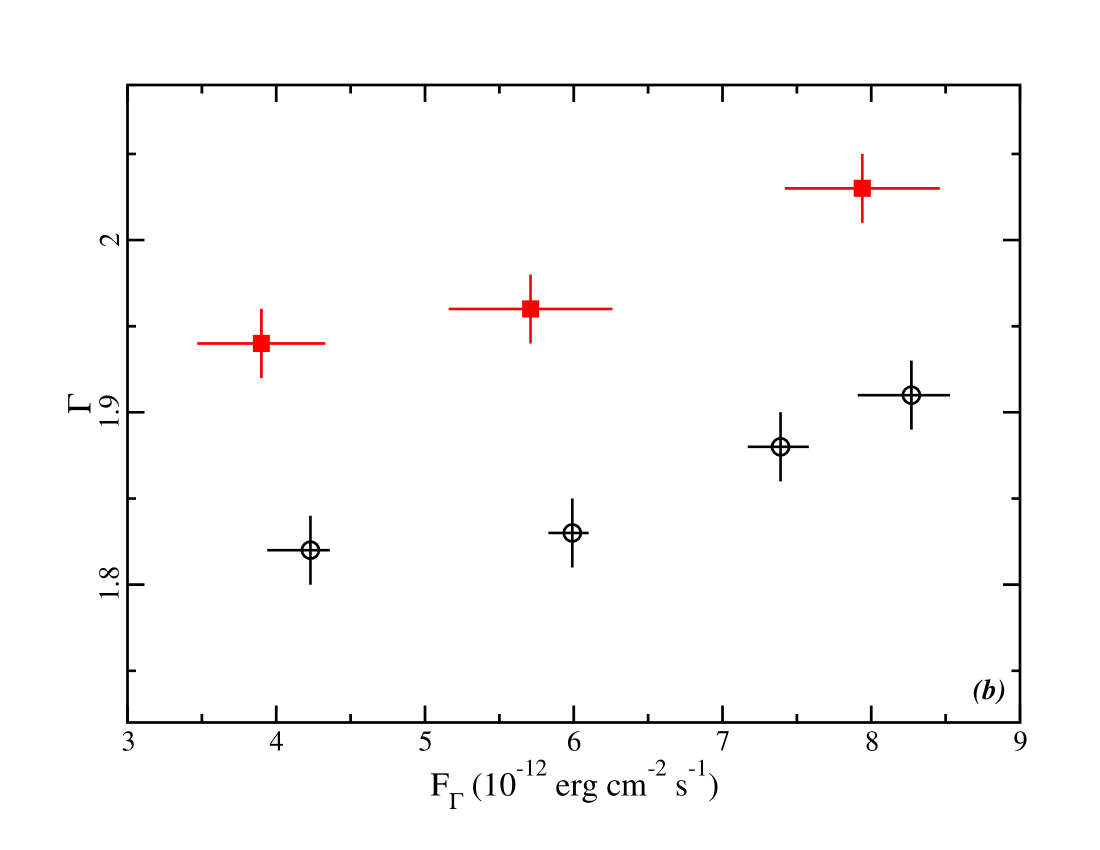
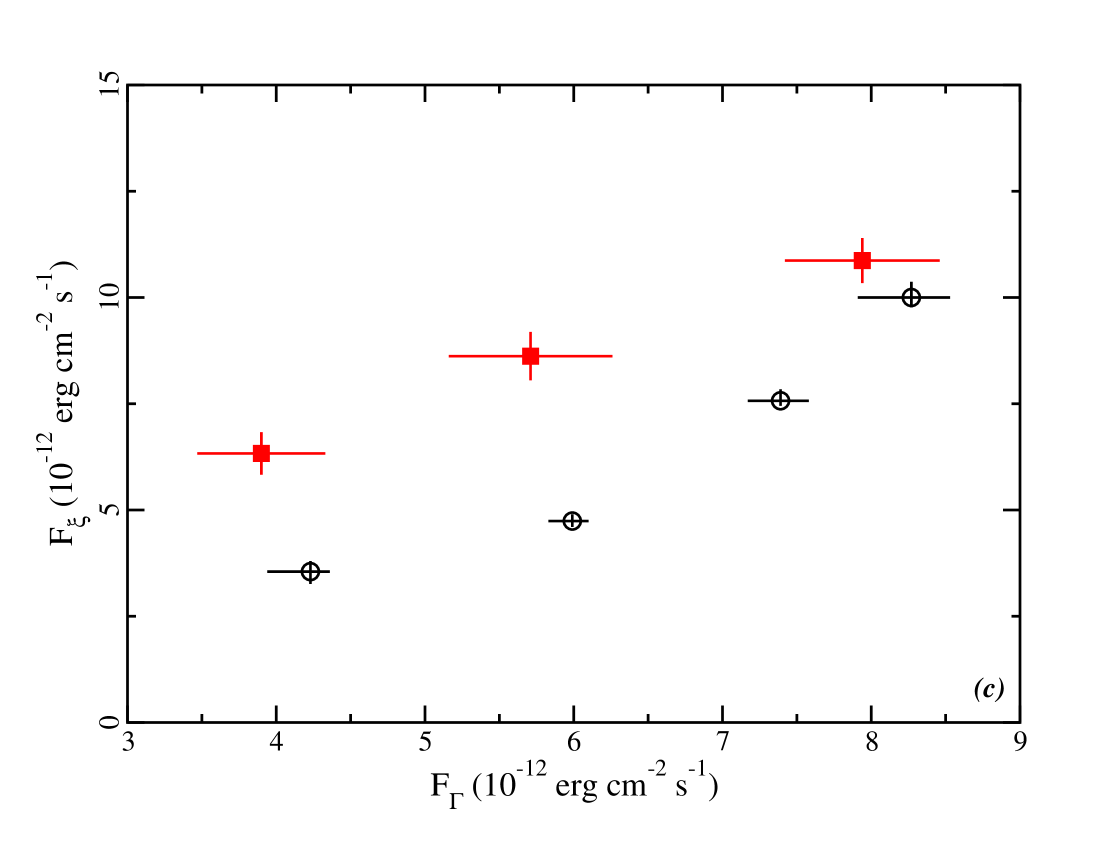
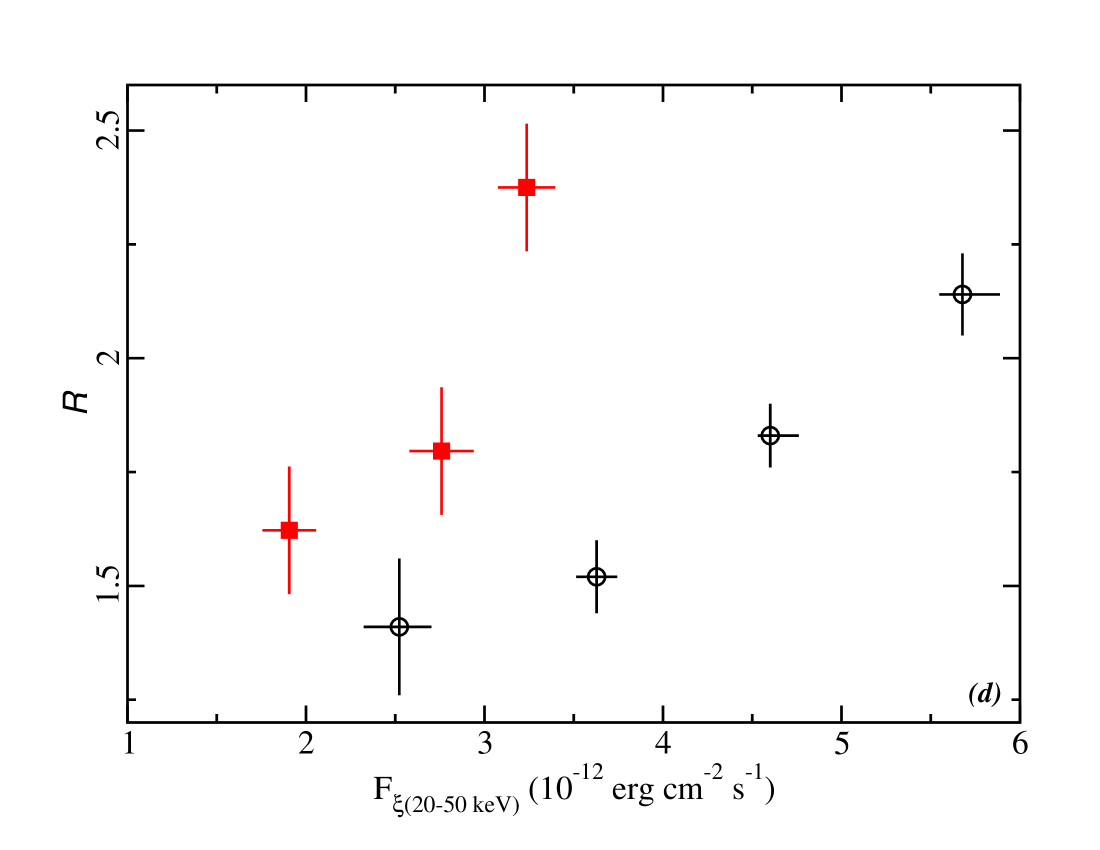
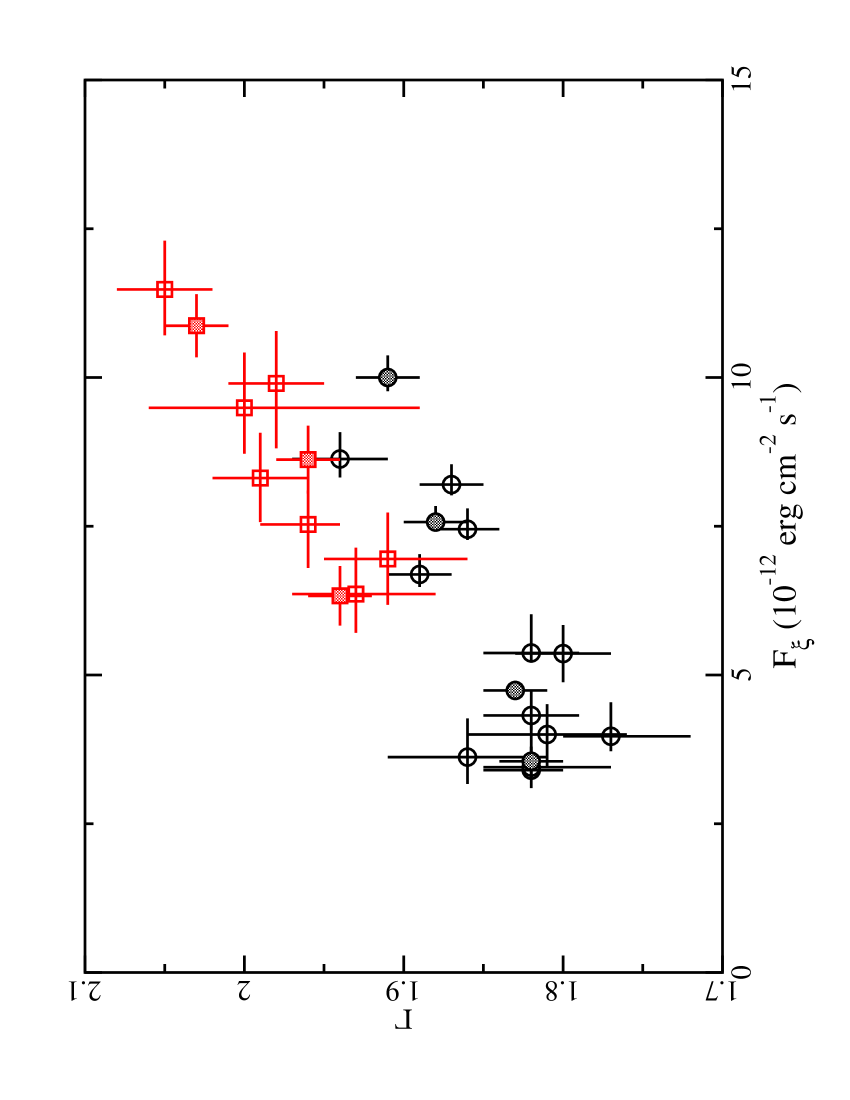
Other parameters do appear to exhibit predicable behaviour. The power law slope is seen to steepen with increasing flux (Fig 9b). The power law flux and reflected flux are also correlated, which would occur if the primary emitter is brightening intrinsically and illuminating the disc more (Fig 9c). The reflection fraction (), which is taken to be the ratio between the reflected and power law flux between , is also correlated with the reflected flux (Fig 9d). We note the relationship between the two parameters is different at each epoch, which could be due to the simultaneous changes in the power law photon indices.
4.2 Time resolved spectroscopy
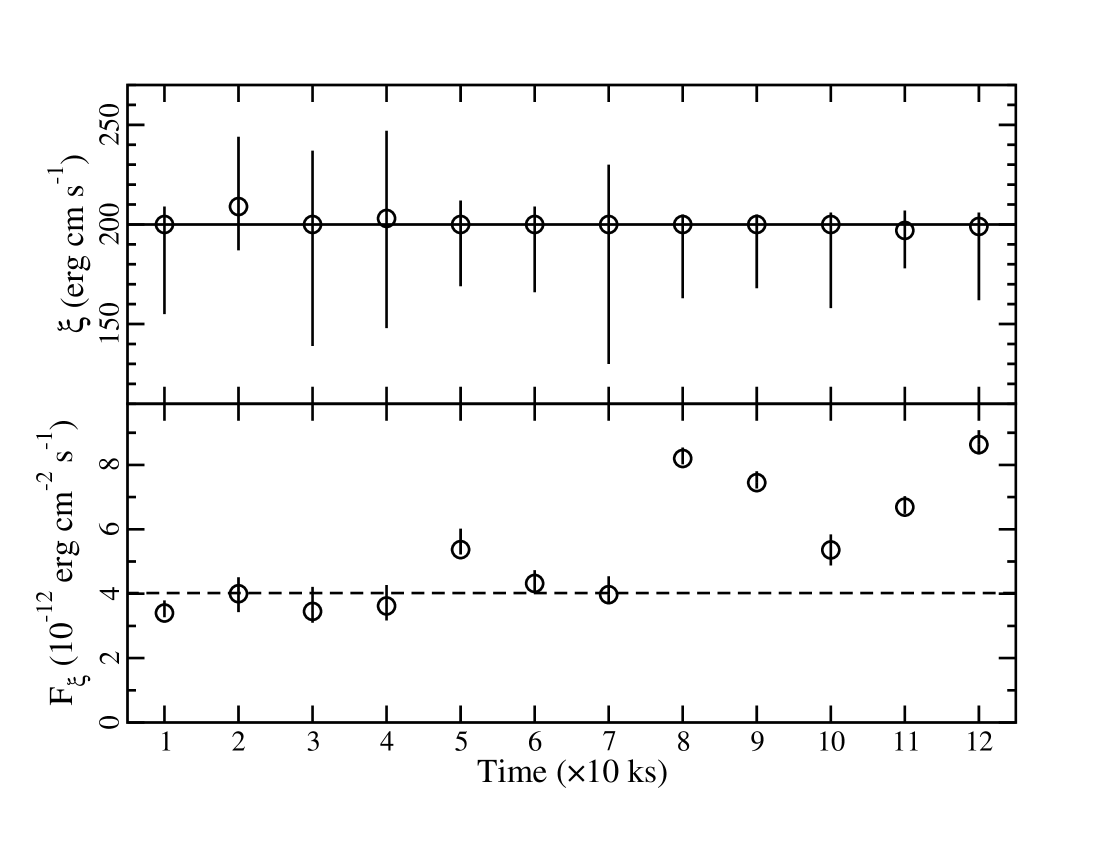
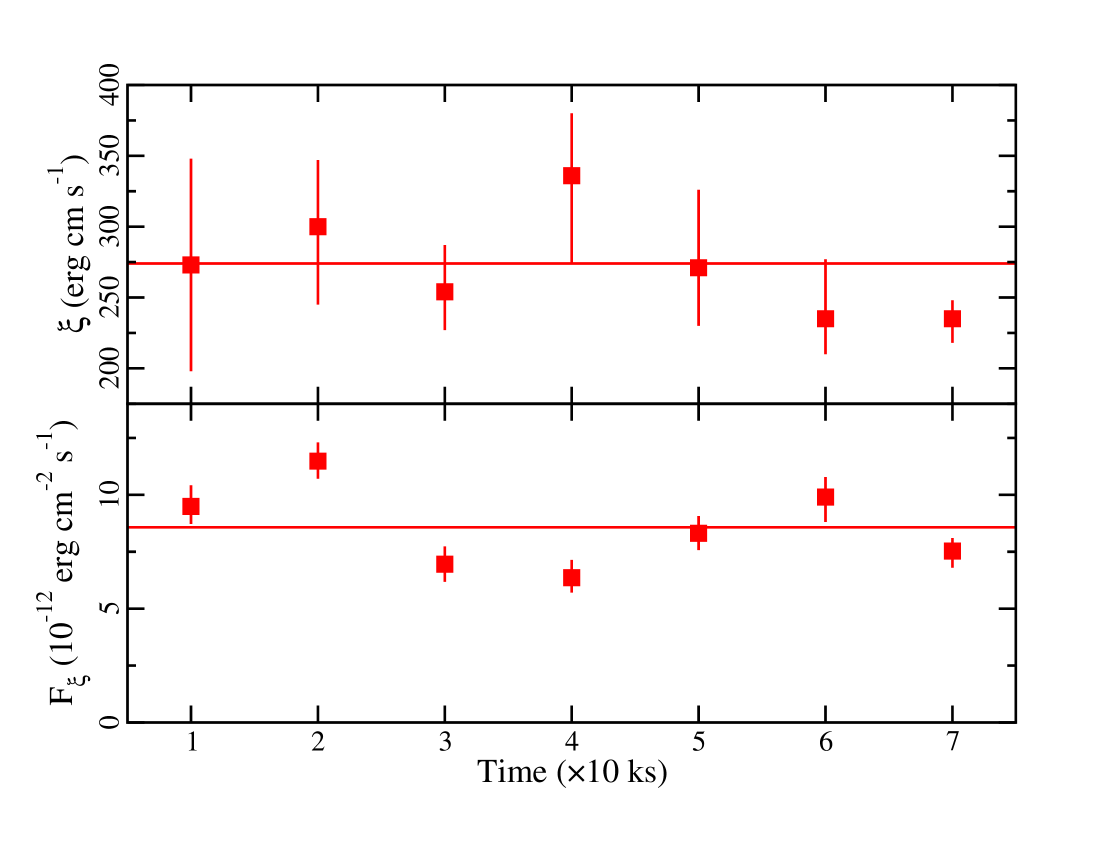
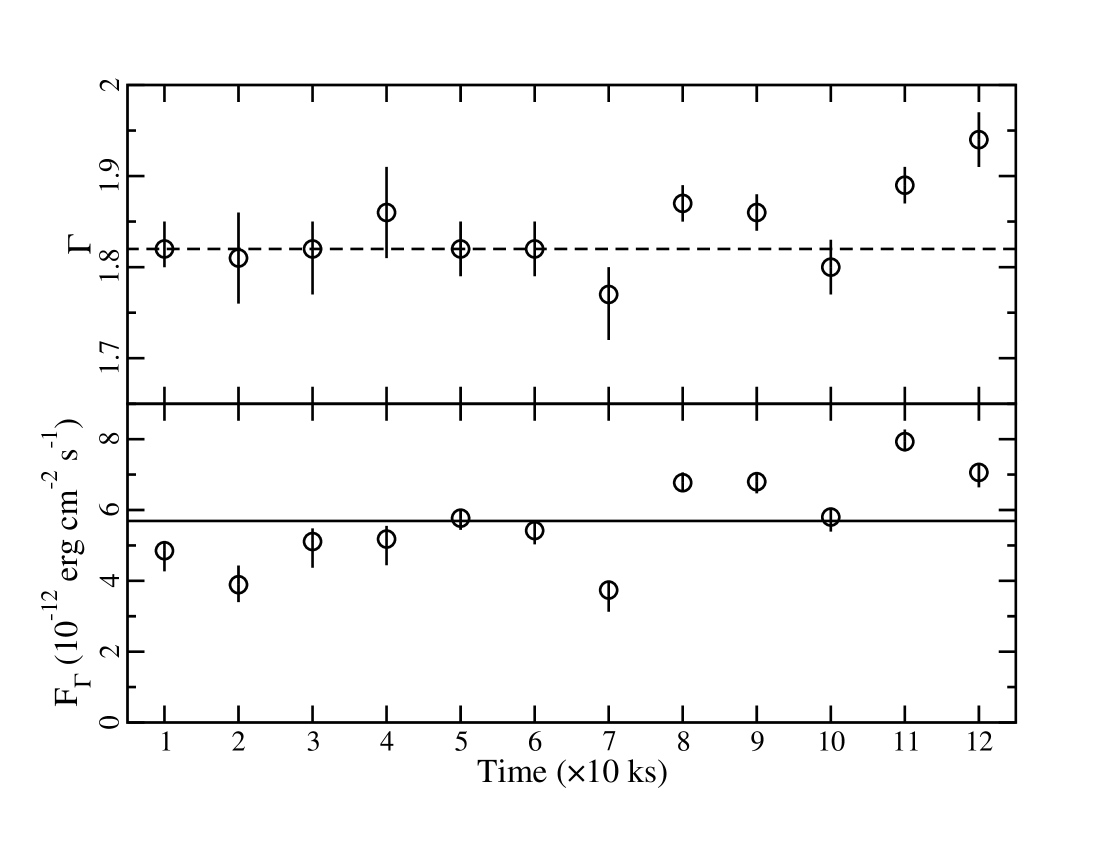
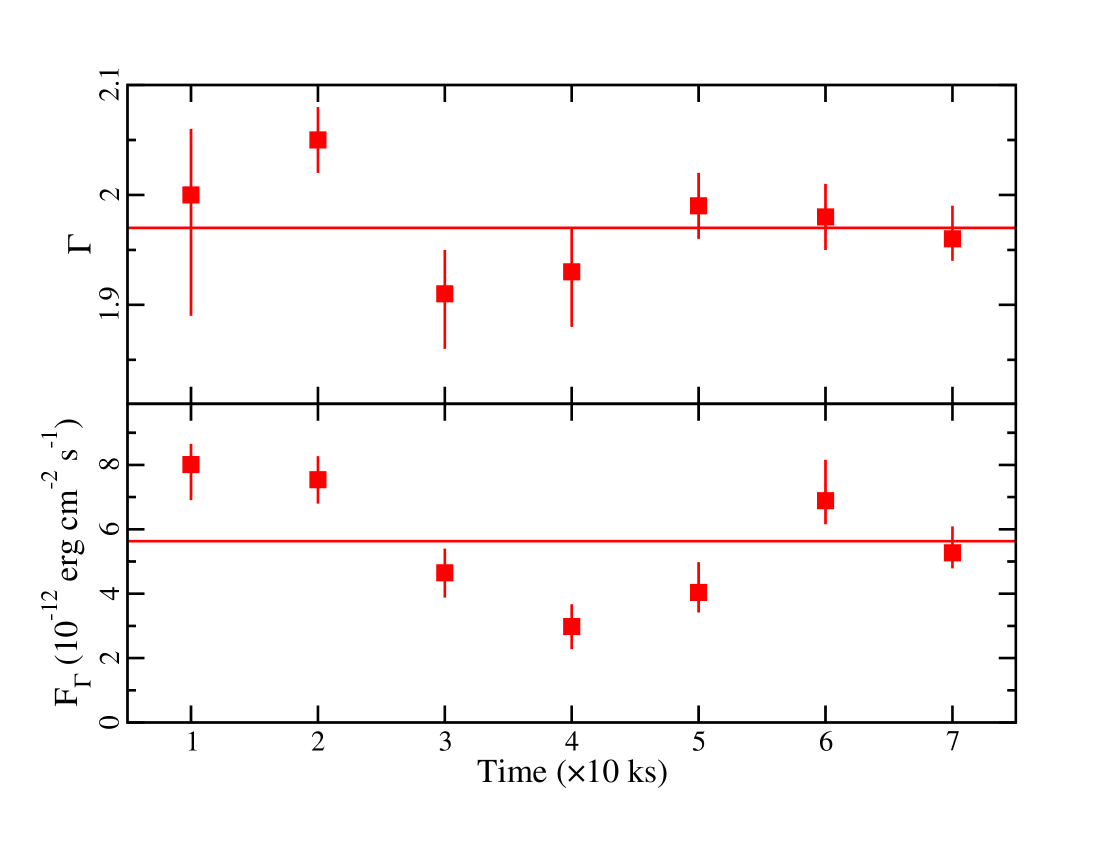
In order to investigate the model variability over time, spectra were created using intervals of data resulting in 12 spectra in 1741 and 7 spectra in 1742. Each spectrum was modelled by allowing only the power law normalisation and slope to vary as well as the reflector normalisation and ionisation. Fig. 10 and 11 portray our findings.
The average ionisation of the reflector is different at each epochs, but as we see in the top panels of Fig. 10 the ionisation parameter does not vary with the short timescale changes in the reflected flux (lower panels of Fig 10). Similar behavior was seen in the flux-resolved spectra (Fig 9a).
The flux of the reflector (lower panels of Fig 10) is variable over the course of the observations, as is the flux and the photon index of the power law component (Fig 11). Of interest, is that during the first of 1741 the flux of the reflection component is approximately constant (Fig. 10, lower left panel) as is the shape and flux of the power law component (Fig 11 left). In general, the reflected flux appears to be well correlated with changes in the power law component. The specific correlation between the photon index and the reflected flux is shown in Fig. 12 and exists in both the time-resolved and flux-resolved spectra. Since the reflection fraction () increases with reflected flux (Fig 9d), the observed trend in Fig 12 between the shape of the intrinsic power law illuminating the accretion disc and the reflected flux is expected (see e.g. Figure 4 of Ross & Fabian 2005).
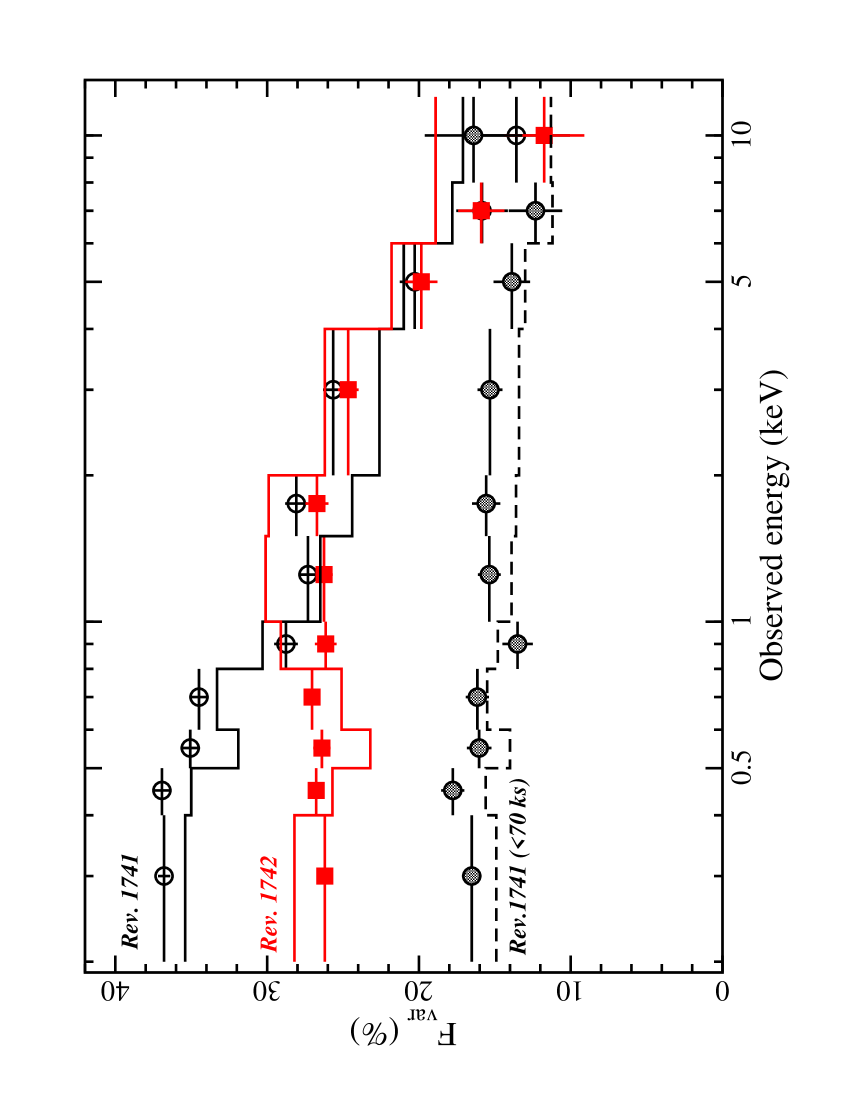
The variability behaviour also describes the appearance of the fractional variability () spectrum of Mrk 335 at each epoch (Fig. 13). The in each energy band is calculated with light curves in bins following Edelson et al. (2002) and uncertainties are estimated following Ponti et al. (2004). There is clearly a difference below in the spectra between the two epochs with 1741 showing larger variations at lower energies. The spectrum is also calculated for only the first of revolution 1741 (shaded, black circles), showing much smaller variations over this reduced period. Each spectrum can be reasonably depicted by the variations found in Fig. 10 and 11. The first of 1741 are described by variations in only the power law normalisation, while to describe the average in 1741 (black open circles) variability in the remaining requires additional changes in the power law slope and reflector normalisation. The variability in 1742 also requires changes in the power law shape and normalisation, and in the reflector normalisation.
5 Discussion
Blurred reflection is expected when the inner accretion disc extends down toward the radius of marginal stability around a black hole. Many of the concerns raised over blurred reflection are now coming into focus with recent X-ray data. The discovery of broadened Fe L and short lags (e.g. Fabian et al. 2009; Zoghbi et al. 2010) suggest the soft excess in AGN is due to reflection and that it arises from reprocessing of the primary continuum. The broad Fe K line is also seen in black hole binaries (BHB) (e.g. Miller et al. 2009) showing that reflection is ubiquitous in black hole systems. The similarities in the Fe K profile seen in AGN and BHB (Walton et al. 2012b) argues strongly in favour of the reflection interpretation. Moreover, the evidence for blurred reflection is not limited to unique systems or specific lines-of-sight. Evidence of reflection is seen in most systems where there is a direct view of the central regions (e.g. Crummy et al. 2005; Zoghbi et al. 2012; Walton et al. 2012a; De Marco et al. 2011).
The XMM-Newton observations of Mrk 335 analyzed here provide a view of the AGN that is distinct from previous observations. Firstly, by the presence of a complex warm absorber (analyzed by L12), and secondly through the significant and rapid spectral variability. Over the course of the observation the source becomes notably softer as it brightens. When examining the light curve from the long-term Swift monitoring campaign (G12), we find that these XMM-Newton observations catch Mrk 335 in rapid transition from a low-flux to a high-flux state (G12). The X-ray continuum is well described with a primary power law emitter and blurred reflection from inner region of the accretion disc around a rapidly spinning black hole. The blurred reflection model also accurately describes the variability assuming that the continuum components are allowed to vary. Specifically, the photon index and power law normalisation as well as the reflector ionisation and normalisation are changing.
Though the behaviour is complex, the variability in the parameters is largely consistent with what is expected. The overall changes appear to be driven by the pivoting of the power law component (i.e. the primary emitter). The power law flux increases as the spectrum steepen, in line with expectations (e.g. Haardt et al. 1997). Assuming the distance between the primary emitter and the disc does not change, the flux and ionisation of the disc will increase accordingly, as is seen.
The changes in power law photon index occur very rapidly. During the first of the observation Mrk 335 did not exhibit any notable spectral variability. The apparent change in the photon index, specifically steepening from to , occurs over in the rest frame. A scenario in which the primary emitter could be moving at mildly relativistic velocities with respect to the disc (e.g. Reynolds & Fabian 1997; Beloborodov 1999) could be invoked to drive the changes in . This interpretation has been advocated for other AGN and NLS1s (e.g. Gallo et al. 2007, 2011; Miniutti et al. 2010). However, while light bending is certainly prominent, the rather constant emissivity profile and break radius obtained in our spectral fitting of Mrk 335 suggest that the blurring parameters are not changing as would be expected if the primary source is varying its distance from the disc.
Fabian et al. (2012) suggest a double power law continuum to describe the low state X-ray spectrum of Cyg X-1. There they suggest the steeper component originates at the base of the jet and is responsible for the reflection with the harder component located farther up the jet. This scenario could perhaps be expanded to describe the observations in Mrk 335. One could imagine multiple jet components coming together at the base of a jet located close to the disc, for example a jet “blob” that does not obtain the escape velocity and falls back downstream toward the base (e.g. Ghisellini et al. 2004). The coming together of two components of differing densities could produce the changes seen in the power law and ultimately in the reflection. Interestingly, a double power law continuum was suggested for the blurred reflection interpretation of the very low flux state observation of Mrk 335 (Grupe et al. 2008). Mrk 335 is certainly radio-quiet, but not radio silent () so the possibility of some jet emission does exist.
6 Conclusions
The most recent XMM-Newton observations of Mrk 335 catch the AGN in a complex, intermediate flux state. Both the X-ray continuum and timing properties of the NLS1 can be described in a self-consistent manner adopting a blurred reflection model with no need to invoke partial covering. The rapid spectral variability appear to be driven by changes in the spectral shape of the primary emitter that is illuminating the inner accretion disc.
Acknowledgments
The XMM-Newton project is an ESA Science Mission with instruments and contributions directly funded by ESA Member States and the USA (NASA). We are grateful to the XMM-Newton observing team for preparing and activating the ToO. We thank the referee for comments that improved the clarity of the paper. DG acknowledges support from NASA contracts NNX07AH67G and NNX09AN12G
References
- [1] Anders E., Grevesse N., 1989, GeCoA, 53, 197
- [2] Arnaud K., 1996, in: Astronomical Data Analysis Software and Systems, Jacoby G., Barnes J., eds, ASP Conf. Series Vol. 101, p17
- [3] Ballantyne D. R., Iwasawa K., Fabian A. C., 2001, MNRAS, 323, 506
- [4] Beloborodov A. M., 1999, MNRAS, 510, 123
- [5] Brenneman, L. W., Reynolds C. S., 2006, ApJ, 652, 1028
- [6] Crummy J., Fabian A., Gallo L., Ross R., 2006, MNRAS, 365, 1067
- [7] den Herder J. W. et al. 2001, A&A, 365, 7
- [8] Edelson R., Turner T. J., Pounds K., Vaughan S., Markowitz A., Marshall H., Dobbie P., Warwick R., 2002, ApJ, 568, 610
- [9] De Marco B., Ponti G., Cappi M., Dadina M., Uttley P., Cackett E. M., Fabian A. C., Miniutti G., 2011, submitted to MNRAS (arXiv: 1201.0196)
- [10] Fabian A. C., et al. ., 2009, Nature, 459, 540
- [11] Fabian A. C. et al. , 2012, MNRAS, 424, 217
- [12] Gallo L. C., Miniutti G., Miller J. M., Brenneman L. W., Fabian A. C., Guainazzi M., Reynolds C. S., 2011, MNRAS, 411, 607
- [13] Gallo L. C., 2006, MNRAS, 368, 479
- [14] Gallo L. C., Brandt W. N., Costantini E., Fabian A. C., 2007, MNRAS, 377, 1375
- [15] Grupe D., Komossa S., Gallo L. C., 2007, ApJ, 668, 111
- [16] Grupe D., et al. , 2008, ApJ, 681, 982
- [17] Grupe D., Komossa S., Gallo, L. C., Longinotti A. L., Fabian, A. C., Pradhan A. K., Gruberbauer M., Xu D, 2012, ApJS, 199, 28 (G12)
- [18] Guainazzi M., 2010, XMM-Newton Calibration Documents (CAL-TN-0018)
- [19] Haardt F., Maraschi L., Ghisellini G., 1997, ApJ, 476, 620
- [20] Jansen F. et al. 2001, A&A, 365, L1
- [21] Kalberla P. M. W., Burton W. B., Hartmann D., Arnal E. M., Bajaja E., Morras R., Pöppel W. G. L., 2005, A&A, 440, 775
- [22] Kallman T., Bautista M., 2001, ApJS, 133, 221
- [23] Larsson J., Miniutti G., Fabian A. C., Miller J. M., Reynolds C. S., Ponti G., 2008, MNRAS, 384, 1316
- [24] Longinotti A. L., Nucita A., Santos-Lleo M., Guainazzi M., 2008, A&A, 470, 73
- [25] Longinotti A. L. et al. , 2012, in prep (L12)
- [26] Mason K. O. et al. 2001, A&A, 365, 36
- [27] Miller J. M., Reynolds C. S., Fabian A. C., Miniutti G., Gallo L. C., 2009, ApJ, 697, 900
- [28] Miniutti G., Piconcelli E., Bianchi S., Vignali C., Bozzo E., 2010, MNRAS, 401, 1315
- [29] Nandra K., 2007, MNRAS, 382, 194
- [30] Nandra K., Pounds K. A., 1994, MNRAS, 268, 405
- [31] O’Neill P. M., Nandra K., Cappi M., Longinotti A. L., Sim S. A., 2007, MNRAS, 381, 94
- [32] Ponti G., Cappi M., Dadina M., Malaguti, G., 2004, A&A, 417, 451
- [33] Reynolds C. S., Fabian A. C., 1997, MNRAS, 290, L1
- [34] Reynolds C. S., Fabian A. C., Brenneman L. W., Miniutti G., Uttley P., Gallo L. C., 2009, MNRAS, 397, 21
- [35] Pounds K. A., Stanger V. J., Turner T. J., King A. R., Czerny B., 1987, MNRAS, 224, 443
- [36] Reynolds C. S., Brenneman L. W., Lohfink A. M., Trippe M. L., Miller J. M., Fabian A. C., Nowak M. A., 2012, accepted for publication in ApJ, (arXiv: 1204.5747)
- [37] Ross R. R., Fabian A. C., 2005, MNRAS, 358, 211
- [38] Strüder L. et al. 2001, A&A, 365, L18
- [39] Tanaka Y., Boller T., Gallo L., 2005, in Merloni A., Nayakshin S., Sunyaev R. A., eds, ESO Conf. Ser., Growing Black Holes: Accretion in a Cosmological Context. Springer-Verlag, Berlin, p. 290
- [40] Turner, M. J. L. et al. 2001, A&A, 365, 27
- [41] Turner T. J. et al. 1993, ApJ 407, 556
- [42] Walton D. J., Nardini E., Fabian A. C., Gallo L. C., Reis R. C., 2012a, MNRAS, submitted
- [43] Walton D. J., Reis R. C., Cackett E. M., Fabian A. C., Miller J. M., 2012b, MNRAS, 422, 2510
- [44] Zoghbi A., Fabian A. C., Uttley P., Miniutti G., Gallo L. C., Reynolds C. S., Miller J. M., Ponti G., 2010, MNRAS, 401, 2419
- [45] Zoghbi A., Fabian A. C., Reynolds C. S., Cackett E. M., 2012, MNRAS, 422, 129