22institutetext: CNRS, Institut pour la Recherche en Astrophysique et Planétologie, 9 Av. Colonel Roche, BP 44346, 31028 Toulouse Cedex 4, France
22email: charlotte.vastel@irap.omp.eu 33institutetext: School of Physics and Astronomy, University of Leeds, Leeds LS2 9JT, UK 44institutetext: Universit Joseph Fourier and CNRS, Institut de Plan tologie et d’Astrophysique, Grenoble, France 55institutetext: California Institute of Technology, Cahill Center for Astronomy and Astrophysics, Pasadena, CA 91125, USA 66institutetext: INAF Osservatorio Astrofisico di Arcetri, Largo E. Fermi 5, I-50125, Firenze, Italy 77institutetext: School of Earth and Environment, University of Leeds, Leeds LS2 9JT, UK
Upper limit for the D2H+ ortho-to-para ratio in the prestellar core 16293E (CHESS)††thanks: The chemical network is available in electronic form at the CDS via anonymous ftp to cdsarc.u-strasbg.fr (130.79.128.5) or via http://cdsweb.u-strasbg.fr/cgi-bin/qcat?J/A+A
The H ion plays a key role in the chemistry of dense interstellar gas clouds where stars and planets are forming. The low temperatures and high extinctions of such clouds make direct observations of H impossible, but lead to large abundances of H2D+ and D2H+, which are very useful probes of the early stages of star and planet formation. The ground-state rotational ortho–D2H+ 11,1–00,0 transition at 1476.6 GHz in the prestellar core 16293E has been searched for with the Herschel††thanks: Herschel is an ESA space observatory with science instruments provided by European-led Principal Investigator consortia and with important participation from NASA. HIFI instrument, within the CHESS (Chemical HErschel Surveys of Star forming regions) Key Program. The line has not been detected at the 21 mK km s-1 level (3 integrated line intensity). We used the ortho–H2D+ 11,0–11,1 transition and para–D2H+ 11,0–10,1 transition detected in this source to determine an upper limit on the ortho-to-para D2H+ ratio as well as the para–D2H+/ortho–H2D+ ratio from a non-LTE analysis. The comparison between our chemical modeling and the observations suggests that the CO depletion must be high (larger than 100), with a density between 5 105 and 106 cm-3. Also the upper limit on the ortho–D2H+ line is consistent with a low gas temperature ( 11 K) with a ortho-to-para ratio of 6 to 9, i.e. 2 to 3 times higher than the value estimated from the chemical modeling, making it impossible to detect this high frequency transition with the present state of the art receivers.
Key Words.:
astrochemistry – ISM: individual (16293E) – ISM: abundances – Line: identification – Radiative transfer1 Introduction
In the recent years, the chemistry of dark clouds and star forming regions has constantly been revised with the discovery of multiply deuterated
molecules: D2CO (Turner, 1990; Ceccarelli et al., 1998), ND2H (Roueff et al., 2000), D2S (Vastel et al., 2003),
ND3 (Lis et al., 2002; van der Tak et al., 2002),
CHD2OH, CD3OH (Parise et al., 2002, 2004) and D2H+ (Vastel et al., 2004).
Two main pathways can be invoked for understanding the observed large
deuterium fractionation. The first is based on grain chemistry (Tielens, 1983). Vastel et al. (2003) and Parise et al. (2004)
showed that grain chemistry models require a very high atomic D/H ratio accreting on the grains in order to explain their high
deuterium fractionation ratio that could not be reproduced by gas-phase modeling at that time. New models can now reproduce the
observed abundance of the multi-deuterated isotopologues of formaldehyde and methanol, both formed in the last stage of the prestellar phase
(Taquet et al., 2012).
The second pathway for forming deuterated molecules is based on gas-phase chemistry and results from the ion-molecule
deuterium exchange reactions taking place at low temperatures. In this scenario, deuterated molecules are produced through
successive reactions starting with H2D+, dominant at temperatures lower than 20 K, CH2D+ or C2HD+,
dominant at higher temperatures (Roberts & Millar, 2000; Gerlich et al., 2002). H2D+ has proven to be a very good probe
of the dense cold cores, where CO disappears from the gas phase and is depleted onto the dust grains (Caselli et al., 2003, 2008).
Phillips & Vastel (2003) pointed out that the deuteration should be extended beyond H2D+, to D2H+ and D
and suggested that the detection of the D2H+ ion might be possible.
Calculations including all possible deuterated isotopomers of H have confirmed that, in dense CO depleted regions, the abundance
of D2H+ will be similar to that of H2D+,
and the D/H ratio will be largely enhanced (Roberts et al., 2003, 2004; Walmsley et al., 2004; Ceccarelli & Dominik, 2005).
D2H+ in its para form was detected for the first time in the prestellar core 16293E by Vastel et al. (2004), showing its importance,
as well as that of D , in determining the total deuterium abundance in the gas phase. This dense core, revealed by amonia emission
(Mizuno et al., 1990), is sheltered in the
dense cloud L1689N (see Wootten & Loren, 1987), in the Ophiuchi region (distance 120 pc: Loinard et al., 2008) and has been revealed by millimeter lines and
continuum emission. This cloud, also harboring a young binary protostellar object (IRAS 16293-2422 A and B) and bipolar outflows
(named Rho Oph East by Fukui et al. (1986)),
has been extensively observed, revealing an extreme molecular deuteration in particular towards the cold dense core, named 16293E by
Loinard et al. (2001) and Castets et al. (2001). Note that this core has been called Oph E (as in Rho Oph East referring to the outflow emanating
from IRAS 16293-2422) by Saito et al. (2000) and Gérin et al. (2001). However, we decided to use the name 16293E since Oph E already refers
to another condensation within the L1688 cloud in the Ophiuchi complex (Loren et al., 1990) and, therefore, is confusing.
We present here recent Herschel/ HIFI observations obtained within the Herschel guaranteed time Key Program CHESS, and modeling of both
ground state transitions of
para– and ortho–D2H, as well as ortho–H2D+, using the recent collisional coefficients with ortho– and para–H2 (Hugo et al., 2009).
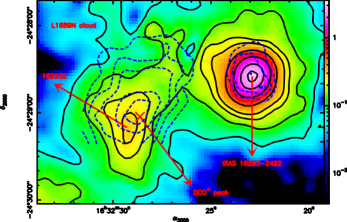
Figure 1 shows the 1.3 mm continuum map as well as the DCO+ contour map (blue) (Lis et al., 2002). Studies of the gas kinematics using CO, HCN, H13CO+, HCO+ and DCO+ tracers lead to the conclusion that the deuterium peak is a part of the ambient cloud that is pushed and compressed by the outflow (Lis et al., 2002). Indeed this shock could have released deuterated species, that were condensed on the dust grains, into the gas phase with a subsequent cooling of the gas to lower temperatures. This effect, combined with the low temperature gas-phase chemistry in the high-density shock-compressed gas leads to a high molecular deuteration as observed in: DNC (9%: Hirota et al., 2001), D2CO (40% 20% Loinard et al., 2001; Ceccarelli et al., 2002), N2D+ (Gérin et al., 2001), NH2D (19% Mizuno et al., 1990; Loinard et al., 2001; Roueff et al., 2005), ND2H (4%: Mizuno et al., 1990; Loinard et al., 2001; Lis et al., 2006), DCO+ and DCN ( 10%: Lis et al., 2002), HDS (Vastel et al., 2003), D2H+ (Vastel et al., 2004), HDO (Stark et al., 2004), ND3 (0.1%: Roueff et al., 2005). Because no far-infrared or submillimeter point source has been found, the source can be classified as a prestellar core, the early phase of the formation of a protostellar object, before gravitational contraction occurs.
2 Observations and data reduction
The para–D2H+ ground state transition was observed towards the prestellar core 16293E with the HIFI instrument (de Graauw et al., 2010) on board the Herschel Space Observatory (Pilbratt et al., 2010), as part of the Herschel guaranteed time Key Program CHESS (Ceccarelli et al., 2010).
A pointing at a frequency centered on the D2H+ line ( 1476.6 GHz) with the band 6a HEB receiver was performed on February 16,
2011 using the pointed Double Beam Switch (DBS) mode with optimization of the continuum. In this mode, both the HIFI Wide Band Spectrometer (WBS) — providing a spectral resolution of 1.1 MHz ( 0.2 km s-1) over an instantaneous bandwidth of 2.4 GHz — and the HIFI High Resolution Spectrometer (HRS) — providing a spectral resolution of 125 kHz over an instantaneous bandwidth of 0.12 GHz — were used. The DBS reference positions were situated approximately 3′ East and West of the source. The HIFI beam size at the observed frequency is about 14′′, and the main beam and forward efficiencies are about 0.72 and 0.96, respectively (Roelfsema et al., 2012). The data have been processed using the standard HIFI pipeline up to level 2 with the ESA-supported package HIPE 8.0 (Ott, 2010).
The on-source integration time for this observation was 18157 seconds. FITS files from level 2 data were created and translated into CLASS/GILDAS format for subsequent data reduction and analysis. For each scan, a low order polynomial baseline was fitted outside the line window. The antenna temperatures were finally converted to the scale, using the theoretical values of the main beam and forward efficiencies given above.
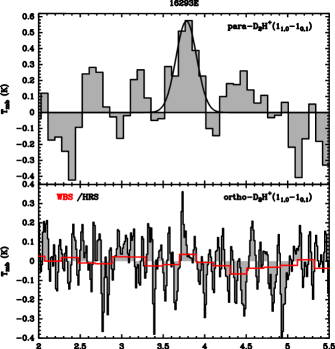
We present in Figure 2 this observation as well as the para ground state transition observed at the Caltech Submillimeter Observatory
(CSO) (Vastel et al., 2004). Both observations were pointed towards the DCO+ peak emission, at coordinates = 16h 32m 2862,
= 24 29 2.7 (see for example Roueff et al., 2005, Figure 9). Note that the coordinates in
Vastel et al. (2004) were not correctly quoted in the text and should be replaced by the here quoted coordinates.
The two nuclear-spin species of H2D+ and D2H+ (ortho and para) are considered separately. The parameters of the ortho– and para–D2H+ and ortho–H2D+ ground transitions are obtained using the CASSIS111CASSIS (http://cassis.irap.omp.eu/) has been developed by IRAP-UPS/CNRS. software, which takes into account the ortho and para forms separately, with an independent computation of the partition function (cf. Formalism for the CASSIS software, http://cassis.irap.omp.eu/), and are reported in Table 1. The Einstein coefficient for the ortho–D2H+ transition ( 3 10-3 s-1) is much larger than for the para–D2H+ ( 4.6 10-4 s-1) and ortho–H2D+ ( 1.1 10-4 s-1) transition, since it varies as a function of . Note that we adopt here the most recent measurement of Amano & Hirao (2005) of the para-D2H+ line frequency (691.660483 GHz), 372.421385 GHz for the ortho–H2D+ transition and 1476.605708 GHz for the ortho–D2H+ transition (Asvany et al., 2008). From a simple Gaussian fitting function, the resulting are (3.78 0.02) km s-1 for the para–D2H+ transition and (3.59 0.02) km s-1 for the ortho–H2D+ transition (statistical uncertainty from the fit). The minimum difference between the lines is 0.15 km s-1, compatible with the 0.1 km s-1 resolution of the acousto-optic spectrometer at 692 GHz, and 0.04 km s-1 at 372 GHz. A difference in the observed is found (exploitation of the data mentioned in Lis et al., 2002, but not published) in the DCO+ 5–4 (3.65 0.01 km s-1) and 3–2 (3.55 0.01 km s-1) transitions. The quoted uncertainties correspond to the Gaussian fit and the line parameters are listed in Table 1. A larger difference in the line center velocity is noticeable comparing the ortho–ND2H 11,1–00,0 (Vlsr = 3.64 km s-1) and 11,1–00,0 (Vlsr = 3.60 km s-1) transitions (Lis et al., 2006), as well as the ortho–NH2D 11,1–10,1 (Vlsr = 3.65 km s-1) and para–NH2D 11,1–10,1 (Vlsr = 3.67 km s-1) transitions (Loinard et al., 2001), with the ND3 10–00 (Vlsr = 3.35 km s-1) transition (Roueff et al., 2005). Such a difference could be explained by dynamical motions in this source that cannot be reproduced with a simple Gaussian fitting function. The interaction between the outflow of IRAS 16293-2422 and the cold core 16293E is likely to produce a velocity shift compared to the L1689N parental cloud, with a difference between the non deuterated species and their increasingly deuterated forms. The difference in the beam sizes of the numerous observations may be responsible for such a variation as well. The single-dish observations do not allow to conclude.

The 3 upper limit on the integrated line intensity, using the Wide Band Spectrometer, has been derived following the relation:
| (1) |
with (root mean square) in K, , the channel width, in km s-1 and (Full Width at Half Maximum) in km s-1. We assumed km s-1, which is the para–D2H+ emission line width.
| Species | Transition | Frequency | Telescope | beamsize | dV | rms | binsize | V | VLSR |
| GHz | (′′) | (mK km s-1) | mK | (km s-1) | (km s-1) | (km s-1) | |||
| ortho–H2D+ | 11,0–11,1 | 372.421385 | CSO | 20 | 720 | 80 | 0.080 | 0.36 0.04 | 3.59 0.02 |
| para–D2H+ | 11,0–10,1 | 691.660483 | CSO | 11 | 183 | 170 | 0.080 | 0.29 0.05 | 3.78 0.02 |
| ortho–D2H+ | 11,1–00,0 | 1476.605708 | HIFI/HRS | 14 | 30 | 120 | 0.012 | ||
| ortho–D2H+ | 11,1–00,0 | 1476.605708 | HIFI/WBS | 14 | 21 | 21 | 0.203 | ||
| DCO+ | 3–2 | 216.1125822 | CSO | 35 | 3235 | 94 | 0.134 | 0.67 0.03 | 3.55 0.01 |
| DCO+ | 5–4 | 360.1697783 | CSO | 20 | 528 | 109 | 0.081 | 0.54 0.03 | 3.65 0.01 |
3 Discussion
3.1 Line widths
The line widths are listed in Table 1. The expected thermal line width varies with the kinetic temperature (T) as:
| (2) |
where k is the Boltzman constant and m is the molecular weight. The ortho–H2D line width corresponds to a 11.3 K
gas, comparable with the 9.2 K temperature found for para-D2H+.
However, the uncertainty
in the fit of the line, using the Levenberg-Marquardt method, should be taken into account leading a temperature of 11.3 1.8 K for
H2D and 9.2 3.2 K for D2H. The resulting range for the kinetic temperature is therefore [9.5 – 12.4] K taking
into account both ions.
The observed (o-p) ND2H line width (about 0.45 km s-1 for the 11,1–00,0 transitions; Lis et al., 2006),
ND3 (0.44 km s-1; Roueff et al., 2005) as well as the DCO+
line width (about 0.5 km s-1 for the 5–4 transition, less optically thick than the 3–2 transition; Lis et al., 2002) and the
N2D+ line width (0.32 km s-1 for the 3–2 transition; Gérin et al., 2001) are systematically larger than the
thermal line widths of 0.16, 0.12 and 0.16 km s-1 respectively for a 10 K kinetic temperature. Considering the high
critical densities for the (o-p) ND2H and ND3 transitions (larger than 106 cm-3), it seems that systematic
motions occur even in the dense part of the cloud. Also, at large enough densities/depletions, one expect to have the light ions
left as the main tracers of the gas. This further confirms that H2D+
and D2H+ remain the only tracers of the cold, dense and CO/N2 depleted central region where other molecular tracers are largely
condensed onto the dust grains, rather than the lower density envelope when turbulence takes over.
3.2 H2D+ and D2H+ non-LTE modeling
The H2 density is a critical parameter for the interpretation of our deuterated ions observations. CO observations of the
3–2, 4–3, 6–5 transitions give a lower limit for the molecular hydrogen density of 5 103 cm-3 (Lis et al., 2002).
In their analysis, Lis et al. (2002) used a kinetic temperature of 12 K (based on NH3 observations of Menten et al., 1987)
and a density of 5 105 cm-3, consistent with their observed DCO+ (5–4)/(3–2) and N2D+ (4–3)/(3–2)
line ratios. From 450 and 850 m continuum maps Stark et al. (2004) inferred an isothermal dust temperature
T = 16 K and peak density of 1.6 106 cm-3. Note however that their dust peak emission does not correspond
to the peak of deuterated molecules (about 15” away) that we are studying in the present paper. This could be due to the release
of the deuterated species that were condensed on the dust grains by the interaction between the outflow from IRAS 16293-2422 and
the cold core 16293E. This compression is then likely to cool the gas to lower temperatures. These observations
possibly trace the parental cloud of the prestellar core 16293E.
We will therefore consider in the following study densities
between 105 and 106 cm-3 and kinetic temperatures between 9 and 16 K (see section 3.1).
From the recent computations of the collision rates (Hugo et al., 2009), the critical densities for the ortho–H2D+,
ortho–D2H+ and para–D2H+ transitions are cm-3, cm-3
and cm-3 respectively, using the Einstein coefficients from Ramanlal & Tennyson (2004),
1.2 10-4, 3.3 10-3 and 5.1 10-4 s-1 respectively.
From the large difference between the critical densities, the ortho–D2H+ transition will trace denser regions
than the para transition.
Since the typical density in the core seems to be less than these critical
densities, a Local Thermodynamic Equilibrium approximation is not applicable. In Vastel et al. (2004), only LTE
modeling could be performed because the collision rates were not available at that time.
We produced collisional files, assuming a simple 2 level system, using the inelastic state-to-state rate
coefficients for the ortho and para ground transitions of H2D+ and D2H+ in collision with para and ortho
H2, as a function of temperature.
We used the non-LTE radiative transfer code RADEX (van der Tak et al., 2007) in the large velocity gradient (LVG) approximation
with the collisional files that were created for these species.
We could consider in the following non-LTE modeling
two values for the H2 ortho to para ratio of 3 (highest value at thermodynamic equilibrium) and 0 (only collisions with para
H2). However, the similarities of the collision coefficients with ortho and para H2 for (o,p)H2D+ or (o,p)D2H+
will lead to a very small difference in the derived column densities.
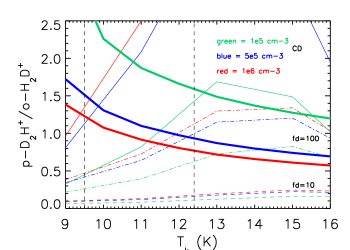
The variation of the para–D2H+ to ortho–H2D+ ratio as a function of the gas temperature, for densities of
1 105 (green), 5 105 (blue) and 1 106 (red) cm-3, are presented in Figure 4
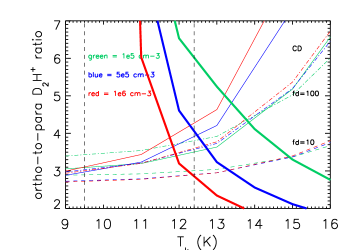
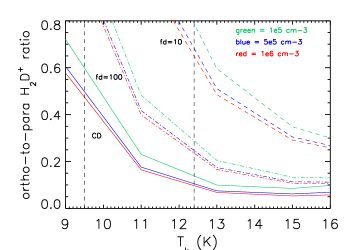
(thick lines) and the upper limit on the ortho-to-para D2H+ ratio is presented in Figure 5 (thick lines).
Note that a selection on the optical depth has been performed ( 100), since the excitation temperature found using RADEX
may then not be representative of the emitting region. The optical depth for the ortho–D2H+ transition is lower than 100 for
kinetic temperatures larger than 10.5 K.
3.3 Full chemical modeling
The chemical network used here has been collected from various sources. First, a reduced chemical network based on the Nahoon code was obtained from the KIDA 222http://kida.obs.u-bordeaux1.fr/models database (Wakelam et al., 2012). The network contains species with three or less elements and includes hydrogen, helium, carbon, nitrogen and oxygen. The reduced Nahoon code has then been modified to include deuterium and deuterated species, with H2, HD and D2 forming on grain surfaces. Finally, the spin states of all isotopologues of H2 and were included. The rate coefficients of the new reactions were taken from Sipilä et al. (2010) , Hugo et al. (2009), Flower et al. (2004) and Walmsley et al. (2004), choosing the most recent values in case of multiple choice. The reaction balancing routine within the Nahoon program (the one which checks the reaction list, to make sure that reactants and products have the same number of elements and charges) had to be modified after the inclusion of the different spin states, to avoid to balance spin states between reactants and products (as spin states are not conserved). For this purpose, different spin states were labelled adding an extra column in the element and species definition file. In this column we assigned -1 to the lower spin state and +1 to the higher spin state of all isotopologues of H2 and H (para-D has been assigned a value of +2 as it is the highest of three spin states). All other species have a zero in the corresponding column, indicating that no spin state is considered. The H2 self shielding data has not been modified but new parameters for the self shielding of HD and D2 have been introduced and have been each set to initially be equal to that of H2. Coulomb focusing was taken into account for reactions involving negatively charged ions on neutral grains (Draine & Sutin, 1987). Only neutral and negatively charged grains are present in the network. The final chemical network includes over 3,500 reactions involving nearly 130 different species. The full chemical network used in this work is available at the CDS via anonymous ftp to cdsarc.u-strasbg.fr (130.79.128.5) or via http://cdsweb.u-strasbg.fr/cgi-bin/qcat?J/A+A/. Comparison with previous work and a parameter space exploration will be presented by Kong et al. (in prep.).
A range of H2 volume densities (1 105, 5 105, 1 106 cm-3), kinetic temperatures (9, 11, 13, 15, and 16 K), and depletion factors ( undepleted abundance / depleted abundance = 10, 100, infinity) of all the elements heavier than helium (C, N and O) have been explored and followed in time until the system reaches equilibrium. Since the CO molecule is the main destroyer of the H ion (and its deuterated counterparts), we simulate three depletion values at steady-state: complete depletion, and elemental depletion factor of 10 and 100 corresponding to CO depletion factors of about 14 and 140, respectively, at equilibrium. From Lis et al. (2002), C18O observations at the deuterium peak of 16293E lead to a CO depletion factor (average along the line of sight) of 10, representing a lower limit for the central core traced by D2H+. Considering the overall parameters in the chemical modeling we adopt the conservative values of 3 10-17 s-1 for the cosmic ionization rate, 0.01 for the dust to gas ratio, and 0.1 m for the grain radius.
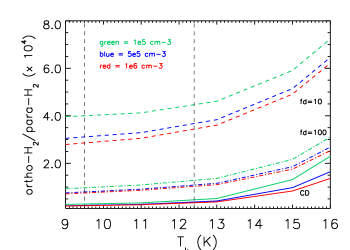
Figure 4–6 show the predictions (thin lines) of the model at equilibrium (reached in years for the complete depletion case, years for a depletion factor of 100 and years for a depletion factor of 10) for temperatures between 9 and 16 K for three densities. The para–D2H+/ortho–H2D+ ratio increases with the depletion factor: indeed the disappearance of the CO molecule from the gas phase leads to the reactions of HD with H with an increasing production of its deuterated counterparts (Phillips & Vastel, 2003). Also the increase of the ortho-to-para D2H+ ratio with the depletion factor can be explained by the fact that the reactions with HD, ortho–D2 and para–D2 converting para–D2H+ into ortho–D2H+ are dominant compared to the reverse reactions (Hugo et al., 2009). From equations 4 and 5 we can say that a low ortho–H2 value leads to a very high D abundance for densities larger than 105 cm-3. Indeed the D ion is likely to be the dominant ion in such high-density regions: e.g. Figure 3 from Flower et al. (2006) and Figure 2 from Sipilä et al. (2010). The ortho-to-para D2H+ ratio consequently increases as the depletion factor increases, as seen in Figure 5. The ortho-to-para H2 ratio should be taken into account in the overall chemistry, since it is critical for the degree of deuteration of H. Increasing the depletion factor leads to a local decrease of the CO abundance. Therefore H+ and H will mainly react with ortho–H2 (at the same temperature the backward reaction is negligible), and not CO. This will lead to a high ortho-to-para H2 conversion, consequently a lower ortho-to-para H2 ratio as seen in Figure 7. Our chemical modeling also predicts a variation of the steady-state ortho-to-para H2 ratio for the complete depletion case, a depletion factor of 100 and a depletion factor of 10, between 9 and 16 K (see Figure 7). Because of the large internal energy ( 170 K) of the lowest ortho–H2 level (J = 1) compared to the temperature range explored in this source, the ortho–H2 form is a limiting factor for deuteration. It overcomes the energy barrier, leading to exothermic (i.e fast and temperature independent) reactions (e.g. Gerlich et al., 2002):
| (3) |
| (4) |
The excited nuclear spin state of the D ion is removed preferentially by ortho–H2 in the following endothermic (by only 18 K) reaction:
| (5) |
Following Hugo et al. (2009) we have assigned meta–D with the modification having the lowest ground state energy, corresponding to the A1 representation of the symmetry group S3. All forms should be taken into account in any chemical modeling involving deuterated ions.
Although Pagani et al. (2009) showed that the
ratio is unlikely in steady-state in prestellar cores, this will not affect the computation of the column densities since, as mentioned in Section 2,
the collisional rates for ortho–H2D+ (as well as para– and ortho–H2D+) are similar for collisions with both para– and
ortho–H2. Note also that the difference between our modeling and Pagani et al. (2009) comes from the time-scale used. Our
values are at equilibrium.
With a comparison between the chemical model predictions and the observations, three convergences can be found for the
complete depletion case and = 100. These domains are quoted in Table 2 for densities of 105, 5 105
and 1 106 cm-3. From the gas kinetic temperature range (9.5 – 12.4 K) found from the uncertainties on the
para–D2H+ and ortho–H2D+ linewidths, the n = 105 cm-3 domain can be ruled out.
Should we consider the highest gas kinetic temperature (12.4 K) the modeling results in a para–D2H+/ortho–H2D+ abundance
ratio 12% lower than the observations for a molecular density of 105 cm-3.
This would reduce the upper limit on the ortho-to-para ratio to a value of 6, 40 higher than the value modeled for
the complete depletion case and with a depletion factor of 100 (see Figure 5). Also, the comparison between the chemical modeling and the ortho-to-para
D2H+ upper limit from the non detection of the ortho
transition is consistent with a low gas temperature ( 11.7 K for a 106 cm-3 density). A proper model should consider the (unknown)
physical structure and proper
time-depended freeze-out.
| n (cm-3) | 105 | 5 105 | 1 106 |
|---|---|---|---|
| Tgas (K) | [12.7 – 15.6] | [9.9 – 12.2] | [9.4 – 11.2] |
| N(ortho–H2D+) | [1.4 – 1.9] 1013 | [1.2 – 1.8] 1013 | [1.2 – 1.9] 1013 |
| N(para–D2H+) | [1.7 – 2.9] 1013 | [1.1 – 2.4] 1013 | [1.1 – 2.3] 1013 |
| N(ortho–D2H+) | 1.6 1014 | 9.2 1014 | 5.1 1014 |
| [ortho–D2H+]/[para–D2H+] | 6 | 44 | 32 |
Note that no other molecular tracers like DCO+ and N2D+, observed by Lis et al. (2002) can be used as a comparison with
the chemical modeling as it might prove difficult to disentangle their contribution from the more extended envelope to
the central region.
Considering an average 11 K gas temperature the upper limit for the ortho-to-para
D2H+ ratio is 2 to 3 times larger than the value found from the modeling (around 3) for densities larger than 105 cm-3.
We get, from the non-LTE radiative transfer modeling, (ortho–H2D+) = (1.4 0.1) 1013 cm-2,
(para–D2H+) = (1.4 0.2) 1013 cm-2, and (ortho–D2H+) 1.4 1014 cm-2.
These values are reproduced by (or in the case of ortho–D2H+ compatible with) our chemical modeling in the complete depletion case.
The present state of the art instruments are clearly unable to detect the ortho–D2H+ transition in this source. The CCAT (Cornell Caltech
Atacama Telescope333http://www.ccatobservatory.org/) project appears to be the most adequate to detect this ortho–D2H+ transition
in warmer regions.
From Figure 6, we can use the average 11 K gas temperature in the complete depletion case as well as with a depletion factor
of 100 to estimate the radiation temperature of the para–H2D+ transition at 1370.085 GHz for densities larger than 105 cm-3.
Using a non LTE modeling described in Section 3.2, the resulting para–H2D+ column density is (9.07 0.49) 1013 cm-2
(TR = (60 20) mK) for the complete depletion case, and (3.40 0.19) 1013 cm-2 (TR = (50 10) mK) for a
depletion factor of 100. This transition unfortunately falls in a frequency range not covered by the HIFI instrument, but could be a target for future instruments.
Carbon monoxyde in the LDN 1689N cloud is only moderately depleted in the single-dish beam (Lis et al., 2002) but it is possible that the angular resolution
of the existing single-dish data is simply insufficient to show the spatial stratification predicted by our chemical model.
The presence of completely depleted regions smaller than the CSO beam cannot be ruled out by our observations.
The deuterium peak in the LDN 1689N cloud has been argued in the literature to be a shock-compressed interaction region
between a molecular outflow and an ambient cloud. Therefore high spatial resolution mapping observations of high density tracers, like
NH3 and its deuterated counterparts as well as N2H+ and N2D+ are necessary to allow investigating the kinematics
of the high-density gas in this region. Both the Atacama Large Array Millimeter and Expanded Very Large Array are suitable for a follow-up
of this source that reveals to be a non typical prestellar core.
4 Conclusions
-
1.
The ground-state ortho–D2H+ 11,1–00,0 transition at 1476.6 GHz in the prestellar core 16293E has been searched for with the Herschel/HIFI instrument.
-
2.
The collision rates for the ortho and para H2D+ and D2H+ ions with molecular hydrogen have been used with a non-LTE radiative transfer code (RADEX) to derive the column densities of the detected ortho–H2D+ and para–D2H+ ground transitions as well as the upper limit on the ortho–D2H+ observed with the HIFI instrument on board the Herschel observatory.
-
3.
We used a gas-phase chemical model, in which deuterium chemistry and the spin states have been added and compared our modeling with the inferred para–D2H+/ortho–H2D+, as well as the upper limit on the ortho-to-para D2H+ ratio. The kinetic temperature is deduced from the line width of both detected ions to be about 10 K, and we varied the molecular hydrogen density between 105 and 106 cm3. The upper limit on the observed ortho-to-para D2H+ ratio is consistent with the modeling and points to a low ( 11 K) gas kinetic temperature. The detection of the ortho–D2H+ transition in the cold regime is a challenge as an rms of about 9 mK is needed, compared to the 21 mK rms reached by the HIFI instrument in about 5 hours.
Acknowledgements.
HIFI has been designed and built by a consortium of institutes and university departments from across Europe, Canada and the United States under the leadership of SRON Netherlands Institute for Space Research, Groningen, The Netherlands and with major contributions from Germany, France and the US. Consortium members are: Canada: CSA, U.Waterloo; France: CESR, LAB, LERMA, IRAM; Germany: KOSMA, MPIfR, MPS; Ireland, NUI Maynooth; Italy: ASI, IFSI-INAF, Osservatorio Astrofisico di Arcetri-INAF; Netherlands: SRON, TUD; Poland: CAMK, CBK; Spain: Observatorio Astronomico Nacional (IGN), Centro de Astrobiologia (CSIC-INTA). Sweden: Chalmers University of Technology - MC2, RSS & GARD; Onsala Space Observatory; Swedish National Space Board, Stockholm University - Stockholm Observatory; Switzerland: ETH Zurich, FHNW; USA: Caltech, JPL, NHSC. We thank CNES for financial support. We thank Valentine Wakelam for providing the reduced Nahoon chemical network and for carefully checking the self-consistency of the program. We thank Laurent Loinard for kindly providing the data published in 2001. Support for this work was provided by NASA through an award issued by JPL/Caltech.References
- Amano & Hirao (2005) Amano, T. & Hirao, T. 2005, Journal of Molecular Spectroscopy, 233, 7
- Asvany et al. (2008) Asvany, O., Ricken, O., Müller, H. S. P., et al. 2008, Physical Review Letters, 100, 233004
- Caselli & Dore (2005) Caselli, P. & Dore, L. 2005, A&A, 433, 1145
- Caselli et al. (2003) Caselli, P., van der Tak, F. F. S., Ceccarelli, C., & Bacmann, A. 2003, A&A, 403, L37
- Caselli et al. (2008) Caselli, P., Vastel, C., Ceccarelli, C., et al. 2008, A&A, 492, 703
- Castets et al. (2001) Castets, A., Ceccarelli, C., Loinard, L., Caux, E., & Lefloch, B. 2001, A&A, 375, 40
- Ceccarelli et al. (2010) Ceccarelli, C., Bacmann, A., Boogert, A., et al. 2010, A&A, 521, L22
- Ceccarelli et al. (1998) Ceccarelli, C., Castets, A., Loinard, L., Caux, E., & Tielens, A. G. G. M. 1998, A&A, 338, L43
- Ceccarelli & Dominik (2005) Ceccarelli, C. & Dominik, C. 2005, A&A, 440, 583
- Ceccarelli et al. (2002) Ceccarelli, C., Vastel, C., Tielens, A. G. G. M., et al. 2002, A&A, 381, L17
- de Graauw et al. (2010) de Graauw, T., Helmich, F. P., Phillips, T. G., et al. 2010, A&A, 518, L6
- Draine & Sutin (1987) Draine, B. T. & Sutin, B. 1987, ApJ, 320, 803
- Flower et al. (2004) Flower, D. R., Pineau des Forêts, G., & Walmsley, C. M. 2004, A&A, 427, 887
- Flower et al. (2006) Flower, D. R., Pineau Des Forêts, G., & Walmsley, C. M. 2006, A&A, 449, 621
- Fukui et al. (1986) Fukui, Y., Sugitani, K., Takaba, H., et al. 1986, ApJ, 311, L85
- Gérin et al. (2001) Gérin, M., Pearson, J. C., Roueff, E., Falgarone, E., & Phillips, T. G. 2001, ApJ, 551, L193
- Gerlich et al. (2002) Gerlich, D., Herbst, E., & Roueff, E. 2002, Planet. Space Sci., 50, 1275
- Hirota et al. (2001) Hirota, T., Ikeda, M., & Yamamoto, S. 2001, ApJ, 547, 814
- Hugo et al. (2009) Hugo, E., Asvany, O., & Schlemmer, S. 2009, J. Chem. Phys., 130, 164302
- Lis et al. (2002) Lis, D. C., Gerin, M., Phillips, T. G., & Motte, F. 2002, ApJ, 569, 322
- Lis et al. (2006) Lis, D. C., Gerin, M., Roueff, E., Vastel, C., & Phillips, T. G. 2006, ApJ, 636, 916
- Loinard et al. (2001) Loinard, L., Castets, A., Ceccarelli, C., Caux, E., & Tielens, A. G. G. M. 2001, ApJ, 552, L163
- Loinard et al. (2008) Loinard, L., Torres, R. M., Mioduszewski, A. J., & Rodríguez, L. F. 2008, ApJ, 675, L29
- Loren et al. (1990) Loren, R. B., Wootten, A., & Wilking, B. A. 1990, ApJ, 365, 269
- Menten et al. (1987) Menten, K. M., Serabyn, E., Guesten, R., & Wilson, T. L. 1987, A&A, 177, L57
- Mizuno et al. (1990) Mizuno, A., Fukui, Y., Iwata, T., Nozawa, S., & Takano, T. 1990, ApJ, 356, 184
- Ott (2010) Ott, S. 2010, in Astronomical Society of the Pacific Conference Series, Vol. 434, Astronomical Data Analysis Software and Systems XIX, ed. Y. Mizumoto, K.-I. Morita, & M. Ohishi, 139
- Pagani et al. (2009) Pagani, L., Vastel, C., Hugo, E., et al. 2009, A&A, 494, 623
- Parise et al. (2004) Parise, B., Castets, A., Herbst, E., et al. 2004, A&A, 416, 159
- Parise et al. (2002) Parise, B., Ceccarelli, C., Tielens, A. G. G. M., et al. 2002, A&A, 393, L49
- Phillips & Vastel (2003) Phillips, T. G. & Vastel, C. 2003, in SFChem 2002: Chemistry as a Diagnostic of Star Formation, ed. C. L. Curry & M. Fich, 3
- Pilbratt et al. (2010) Pilbratt, G. L., Riedinger, J. R., Passvogel, T., et al. 2010, A&A, 518, L1
- Ramanlal & Tennyson (2004) Ramanlal, J. & Tennyson, J. 2004, MNRAS, 354, 161
- Roberts et al. (2003) Roberts, H., Herbst, E., & Millar, T. J. 2003, ApJ, 591, L41
- Roberts et al. (2004) Roberts, H., Herbst, E., & Millar, T. J. 2004, A&A, 424, 905
- Roberts & Millar (2000) Roberts, H. & Millar, T. J. 2000, A&A, 361, 388
- Roelfsema et al. (2012) Roelfsema, P. R., Helmich, F. P., Teyssier, D., et al. 2012, A&A, 537, A17
- Roueff et al. (2005) Roueff, E., Lis, D. C., van der Tak, F. F. S., Gerin, M., & Goldsmith, P. F. 2005, A&A, 438, 585
- Roueff et al. (2000) Roueff, E., Tiné, S., Coudert, L. H., et al. 2000, A&A, 354, L63
- Saito et al. (2000) Saito, S., Ozeki, H., Ohishi, M., & Yamamoto, S. 2000, ApJ, 535, 227
- Sipilä et al. (2010) Sipilä, O., Hugo, E., Harju, J., et al. 2010, A&A, 509, A98
- Stark et al. (2004) Stark, R., Sandell, G., Beck, S. C., et al. 2004, ApJ, 608, 341
- Taquet et al. (2012) Taquet, V., Ceccarelli, C., & Kahane, C. 2012, ApJ, 748, L3
- Tielens (1983) Tielens, A. G. G. M. 1983, A&A, 119, 177
- Turner (1990) Turner, B. E. 1990, ApJ, 362, L29
- van der Tak et al. (2007) van der Tak, F. F. S., Black, J. H., Schöier, F. L., Jansen, D. J., & van Dishoeck, E. F. 2007, A&A, 468, 627
- van der Tak et al. (2002) van der Tak, F. F. S., Schilke, P., Müller, H. S. P., et al. 2002, A&A, 388, L53
- Vastel et al. (2003) Vastel, C., Phillips, T. G., Ceccarelli, C., & Pearson, J. 2003, ApJ, 593, L97
- Vastel et al. (2004) Vastel, C., Phillips, T. G., & Yoshida, H. 2004, ApJ, 606, L127
- Wakelam et al. (2012) Wakelam, V., Herbst, E., Loison, J.-C., et al. 2012, ApJS, 199, 21
- Walmsley et al. (2004) Walmsley, C. M., Flower, D. R., & Pineau des Forêts, G. 2004, A&A, 418, 1035
- Wootten & Loren (1987) Wootten, A. & Loren, R. B. 1987, ApJ, 317, 220