Beam energy dependence of Elliptic and Triangular flow with the AMPT model
Abstract
A beam energy scan has been carried out at the Relativistic Heavy Ion Collider at Brookhaven National Laboratory to search for the onset of deconfinement and a possible critical point where the transition from a Quark Gluon Plasma to a hadronic phase changes from a rapid cross-over to a first order phase transition. Anisotropy in the azimuthal distribution of produced particles such as the second and third harmonics and are expected to be sensitive to the existence of a Quark Gluon Plasma phase and the Equation of State of the system. For this reason, they are of great experimental interests. In this Letter we report on calculations of and from the AMPT model in the Default(Def.) and String Melting(SM) mode to provide a reference for the energy dependence of and for from 7.7 GeV to 2.76 TeV. We expect that in the case that collisions cease to produce QGP at lower colliding energies, data will deviate from the AMPT String Melting calculations and come in better agreement with the Default calculations.
keywords:
heavy ion collisions , correlations , flow , AMPT1 Introduction
The motivation for colliding heavy ions at facilities like the Relativistic Heavy Ion Collider (RHIC) at Brookhaven National Laboratory and the Large Hadron Collider (LHC) at CERN is to form a state of matter called the Quark Gluon Plasma (QGP) [1]. Each of these collisions creates a region so hot and dense that quarks and gluons become the relevant degrees of freedom instead of hadrons [2]. Studying the conversion of coordinate space anisotropies into momentum space anisotropies gives insight into the nature of the matter created in these collisions [3]. For decades, elliptic flow () has been studied to probe the conversion of the elliptic shape of the initial overlap zone into azimuthal anisotropy in momentum space [4] over a broad range of colliding beam energies. Measuring the strength of that conversion as a function of beam energy to search for evidence of the onset of deconfinement or a softening of the equation-of-state is one of the goals of the RHIC Beam Energy Scan program. In 2007 Mishra et. al. [5] proposed the analysis of for all values of and argued that density inhomogeneities in the initial state would lead to non-zero values for higher harmonics including . Although they proposed that vs. could be used to search for superhorizon fluctuations, it was later noted that higher harmonics of would be washed out by viscous effects and that the shape of vs. would provide a valuable tool for studying s [6]. It was also subsequently pointed out that information on was to a large extent contained within already existing two-particle correlations data [7], and that and fluctuations would provide a natural explanation for the novel features seen in those correlations, such as the ridge like [8] and mach-cone like [9] structures. That the ridge could be related to flux-tube like structures in the initial state was already argued by Voloshin in 2006 [10]. Calculations carried out within the NEXSPHERIO model showed that in a hydrodynamic model fluctuations in the initial conditions lead to a near-side ridge correlation and a mach-cone like structure on the away-side [11]. In 2010, Alver and Roland used a generalization of participant eccentricity () to arbitrary values of as in Ref. [12] and showed that within the AMPT model, the final momentum space anisotropy for was proportional to the initial [13]. This explained the previous observation that the AMPT model produced correlations similar to those seen in the data (albeit with smaller amplitudes) [14]. Later studies showed that with changes to the input parameters, AMPT could quantitatively describe the centrality dependence of and at 200 GeV and 2.76 TeV [15].
In this paper we use the AMPT model to study the beam energy dependence of and . We study collisions ranging from 7.7 GeV to 2.76 TeV. We compare AMPT in the string melting and the default setting.
2 AMPT Settings and Comparisons to Data
The AMPT model provides two modes: Default and String Melting [16]. AMPT in default mode is essentially a string and minijets model (without a QGP phase) where initial strings and minijets are produced with the HIJING event generator [17]. The interactions of the minijet partons are then calculated using a parton cascade (ZPC) before the strings and partons are recombined and the strings are fragmented via Lund string fragmentation. ART (A Relativistic Transport model for hadrons) is used to describe how the produced hadrons will interact. In the String Melting mode, the strings produced from HIJING are decomposed into partons which are fed into the parton cascade along with the minijet partons. The partonic matter is then turned into hadrons through coalescence and the hadronic interactions are subsequently modeled using ART. So while the Default mode describes the collision evolution in terms of strings and minijets followed by string fragmentation, the String Melting mode includes a fully partonic QGP phase that hadronizes through quark coalescence. The model therefore provides a convenient way to investigate expectations for a variety of observables with and without a QGP phase.
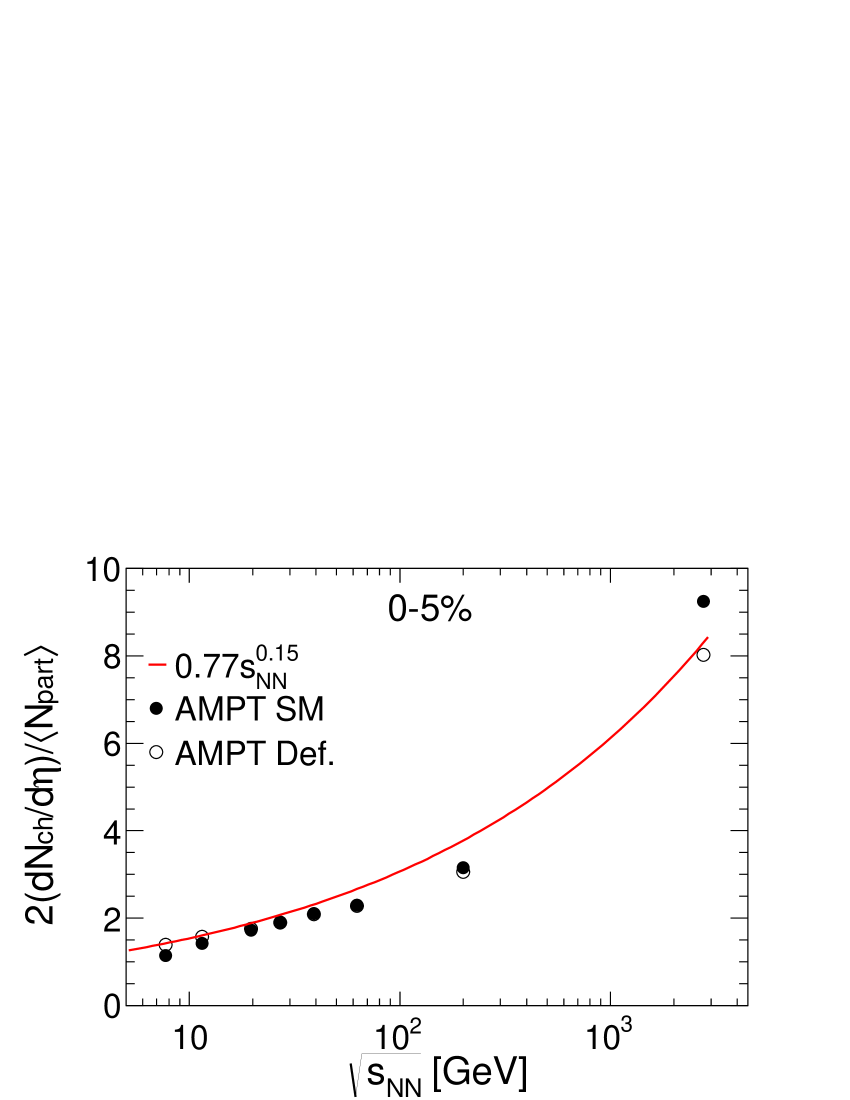
Several parameters need to be specified in the model including parameters a and b for Lund string fragmentation, the QCD coupling constant (which the model treats as a constant), and the screening mass for gluons in the QGP phase . A recent study found that a good description of the multiplicity density, and could be achieved with the parameter set: a=0.5, b=0.9 (GeV-2), =0.33 and =3.2 (fm-1) [15]. In this study, we found that we can acheive a good desciption of the multiplicity density at all energies from = 7.7 GeV to 2.76 TeV by using parameter set: a=2.2, b=0.5 (GeV-2), =0.47 and =1.8 (fm-1) and turning off initial and final state radiation in HIJING. In this case, the initial cutoff for minijets does not need to be adjusted with in order to match the LHC multiplicity densities [18]. We leave and all other parameters fixed for all energies. Figure 1 shows the charged particle multiplicity density scaled by for 0-5% central Au+Au or Pb+Pb collisions from AMPT String Melting and Default vs . The line shows the parameterization of the experimental data from Ref. [19]. Both the SM and Default calculations are in good agreement with the experimental data throughout the entire energy range.
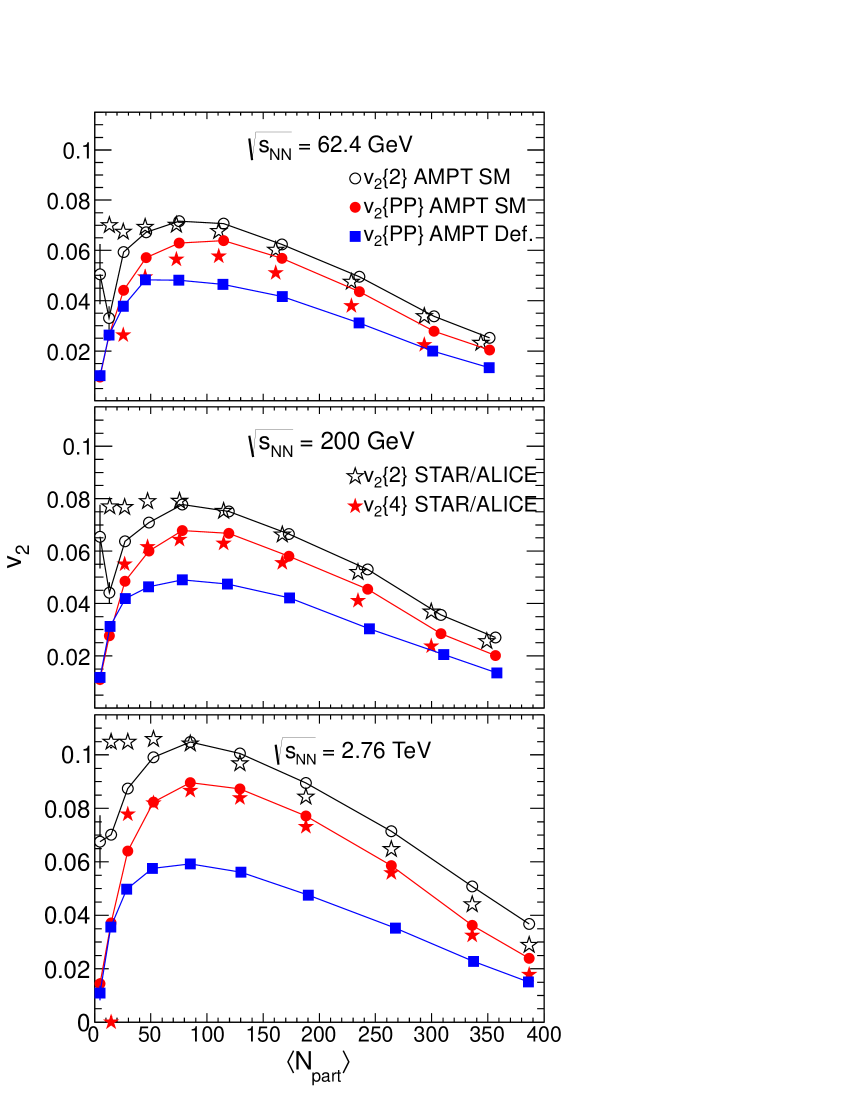
In Figure 2, the AMPT model results are compared to experimental data at 62.4 GeV, 200 GeV, and 2.76 TeV. For the SM calculations, we show (i) relative to the participant plane () calculated from the initial conditions of AMPT and (ii) the two-particle cumulant results . While where is a term to account for correlations not related to the participant plane (non-flow), is the true mean relative to the participant plane. The difference between those results therefore reflects both the effect of fluctuations and non-flow correlations present in the model. All the model calculations have a similar centrality dependence but the Default results are well below the SM results. The data generally agree well with the SM calculations. In the case that the fluctuations are dominated by eccentricity fluctuations and those eccentricity fluctuations follow a Gaussian distribution in and , should be equal to with respect to the reaction plane [20]. The fact that the experimental results are slightly below the model results calculated with respect to the participant plane does not therefore signify a discrepancy between data and model. We consider the agreement between the model and the data to be satisfactory.
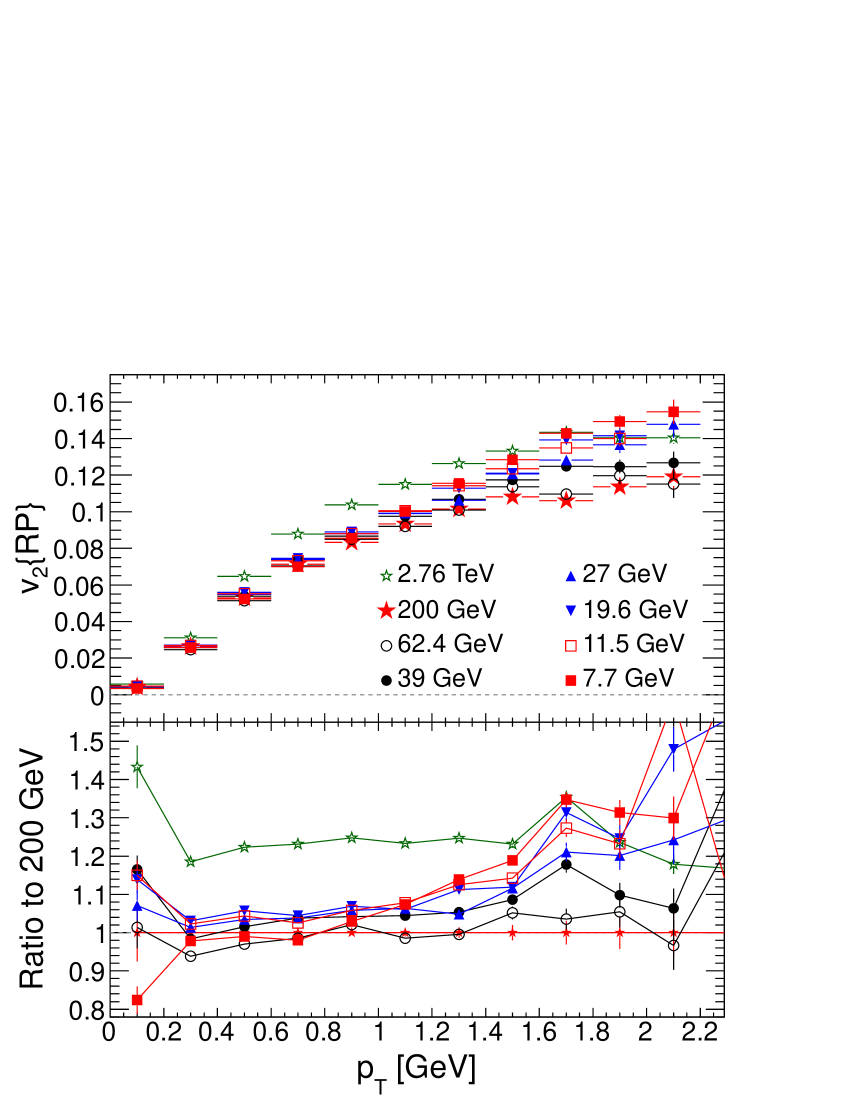
STAR has shown that for GeV, increases with , for GeV is roughly independent of collision energy in the range 7.7 GeV to 2.76 TeV [21]. It is surprising for a measurement that is supposed to be sensitive to viscosity and collective effects in the expansion to not depend on over such a wide range of energies where the initial conditions and properties of the fireball should be changing quite significantly. Given this surprising experimental result, it is interesting to see if the same trend is reproduced in the AMPT model. In Figure 7, we show calculated with respect to the reaction plane for collisions with center of mass energies ranging from 7.7 GeV to 2.76 TeV. Although the statistics in our study were not sufficient to calculate , it has been shown that as long as fluctuations are dominated by eccentricity fluctuations and those eccentricity fluctuations are Gaussian distributed along the x and y axis, then is equivalent to [20]. We therefore check to see if is independent of for GeV in the AMPT model. We find that the variation of is not large in AMPT throughout the energy range studied. For GeV, varies by about 5% from 7.7 GeV up to 200 GeV. Going from 200 GeV to 2.76 TeV, increases by 20%, independent of . In the RHIC range, the AMPT results for GeV are actually increasing as the energy is decreased with at GeV for 7.7 GeV being 20% larger than for 200 GeV. This likely reflects the softening of the spectrum which allows flow effects that push low momentum particles to higher momentum, to have a larger influence at intermediate . The same trends hold when studying (not shown). Although there are differences between the trends seen in AMPT and in the data, one can conclude that even in the AMPT model, the changes in or when increasing from 7.7 GeV to 2.76 TeV are not large. In this case, it is not necessarily surprising that the data also does not change drastically. Since based on the AMPT model, we would not expect a large variation of with , as long as one assumes that a string melting or QGP phase exists throughout the energy range under study, the fact that the data seem to change very little no longer appears to be so difficult to understand.
3 The Third Harmonic
Having shown that our parameter selection provides a good description of the charged particle multiplicity densities and the elliptic flow, we now turn to investigate and its energy dependence. We first study the relationship of to the third harmonic participant eccentricity. In Ref. [13] the AMPT model is used to show that and have a linear dependendence on and . At Quark Matter 2011, STAR showed that scales with 1/ [22]. Here we check to see if this phenomenological observation is also reproduced in the AMPT model.
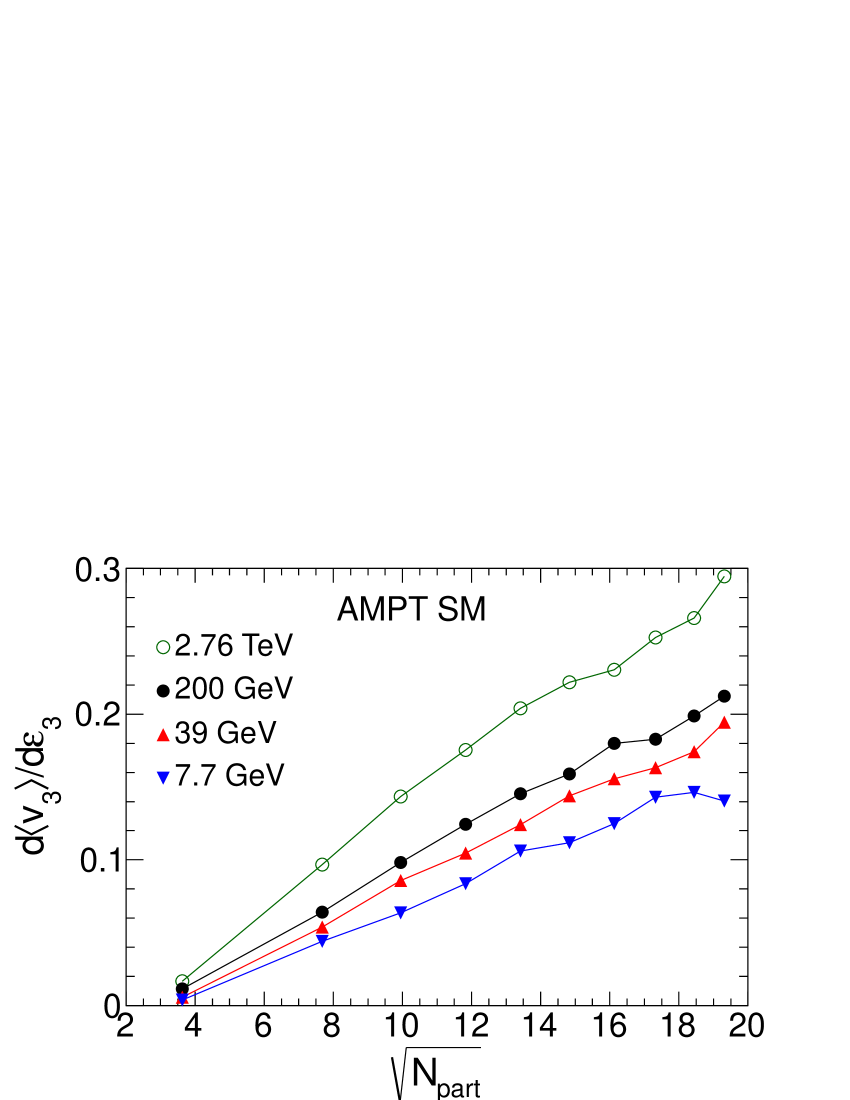
In Figure 4 we investigate the dependence of the slope of vs. on . The figure shows vs. for GeV, 39 GeV, 200 GeV, and 2.76 TeV. We find that for all the energies investigated (including those not shown in the figure), increases linearly with . The AMPT model therefore correctly describes the phenomenological observation made by STAR. This also indicates that according to the string melting version of AMPT, even at energies as low as =7.7 GeV, reflects the fluctuations in the initial geometry of the collisions and that the centrality dependence will remain similar at all energies although the magnitude will change. At the lowest energies investigated here, the contributions from jets and minijets should be negligible so they will not contribute significantly to the centrality dependence of . The experimental observation of a similar centrality dependence for at 7.7 and 200 GeV [22], therefore strongly contradicts assertions that is dominated by jet-like correlations [23].
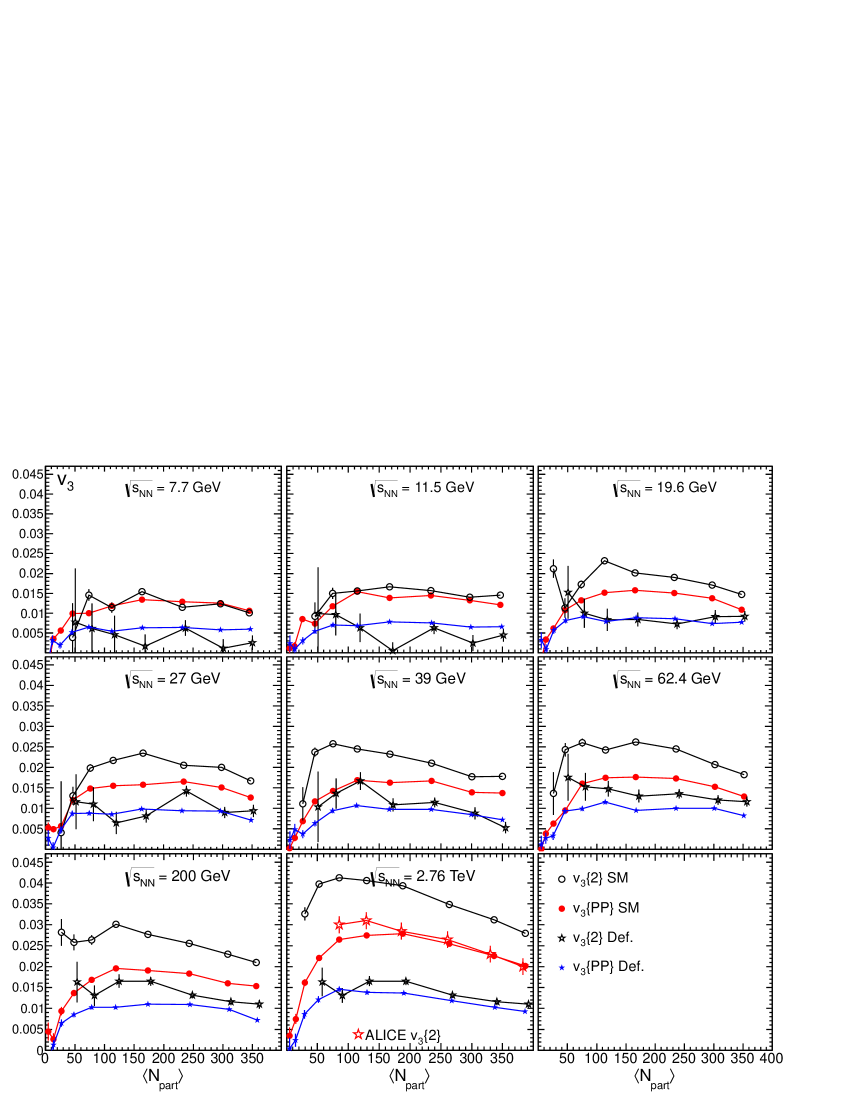
In Figure 5, AMPT SM and Default calculations of and are shown for 7.7, 11.5, 19.6, 27, 39, 62.4, 200 GeV and 2.76 TeV. While reflects the true correlation of particles with the initial participant plane, includes non-flow and fluctuation effects. The difference between and is large at 200 and 39 GeV while at 7.7 GeV and are equivalent. This indicates that indeed, according to AMPT SM, non-flow does not make an appreciable contribution to at 7.7 GeV. We compare the model results to ALICE data at 2.76 TeV and find that for AMPT SM matches the ALICE data on . The AMPT SM results over predict the ALICE data and the AMPT Default results underpredict the ALICE data. The Default results also underpredict the ALICE data for . The correspondence of from AMPT SM with from ALICE data means that either non-flow and fluctuations are overpredicted in AMPT or is underpredicted. The 200 GeV data is also in good agreement with preliminary STAR data [22] (not shown) in the same centrality range. In more peripheral collisions, the STAR data in Ref. [22] tends to increase as seen with the AMPT results. This suggests that while measurements for are dominated by the correlation of particles with the participant plane, in more peripheral collisions begins to reflect correlations related to mini-jet structure similar to that in collisions.
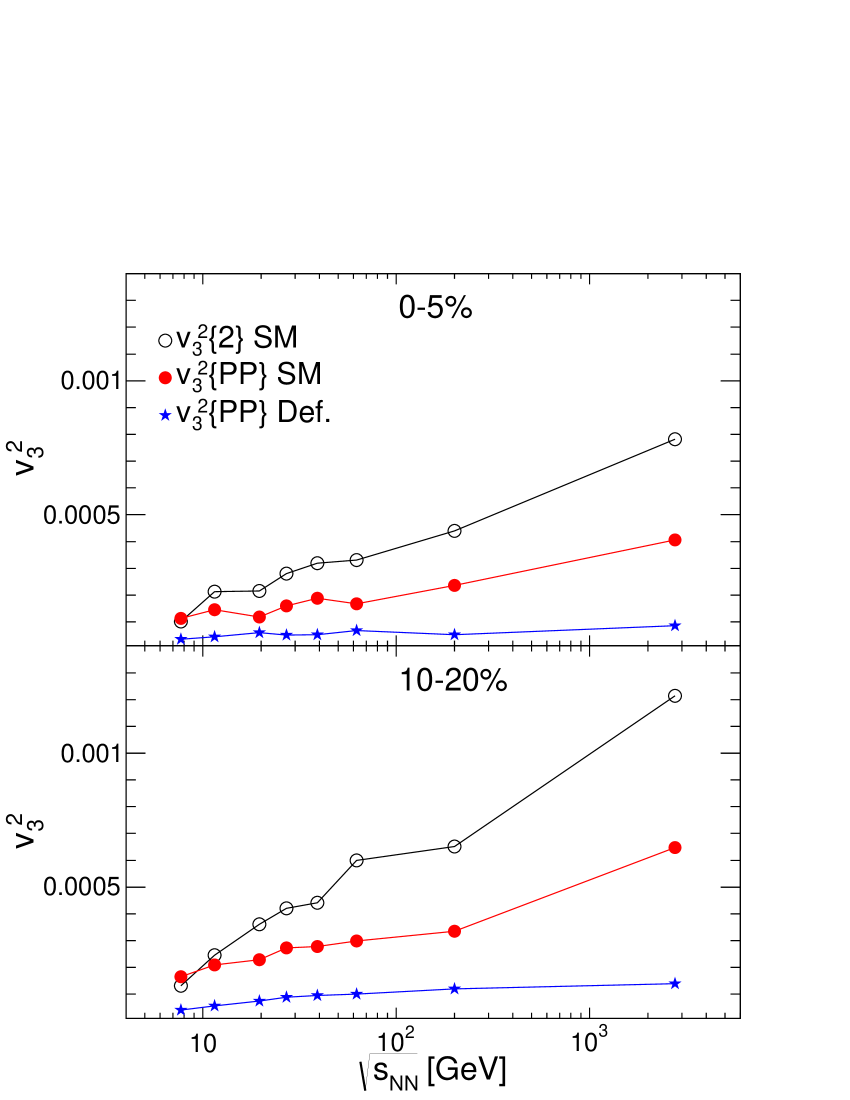
In figure 6 we show the AMPT results for the variation of and with from 7.7 GeV to 2.76 TeV for two centrality intervals. The results on using the default setting for AMPT are very small and well below the preliminary data presented by STAR. The SM results decrease rather smoothly with decreasing energy but still have an appreciable value down to 7.7 GeV. The calculations for SM have the same value as the SM at 7.7 and 11.5 GeV. This again indicates that within this model, non-flow from minijets has a negligible impact on two-particle correlations at the lowest energies measured in the RHIC beam energy scan. Above those energies, the difference between and grows substantially. It will be interesting to see if the experimental data on follows the same trend as AMPT SM all the way down to 7.7 GeV where non-flow from minijets can be neglected. It will be most interesting to see if data eventually drops down to the values predicted by the AMPT Default model. Estimates of the Bjorken energy density [25] compared to the Lattice QCD estimates for the critical energy density [26] suggest that this may not happen until below 7.7 GeV [27]. The calculations presented in this paper provide a base-line with which to compare future experimental data.
4 Viscosity Estimates
In Ref. [28], the authors estimate the shear viscosity to entropy ratio based on kinetic theory using
| (1) |
where is the screening mass of a gluon in the QGP and is the QCD coupling constant. Both are input parameters for the AMPT model. In Ref. [15], it is shown that parameter set B ( fm-1 and ) provides a good description of the and data at 200 GeV and 2.76 TeV. These parameters and equation 1 then yield the as shown in figure 7 with the label Set B. For the estimated initial temperatures (378 MeV) at top RHIC energy, =0.38, far above the ADS/CFT or quantum lower bound of [29, 30] and also above most estimates from hydrodynamic models.
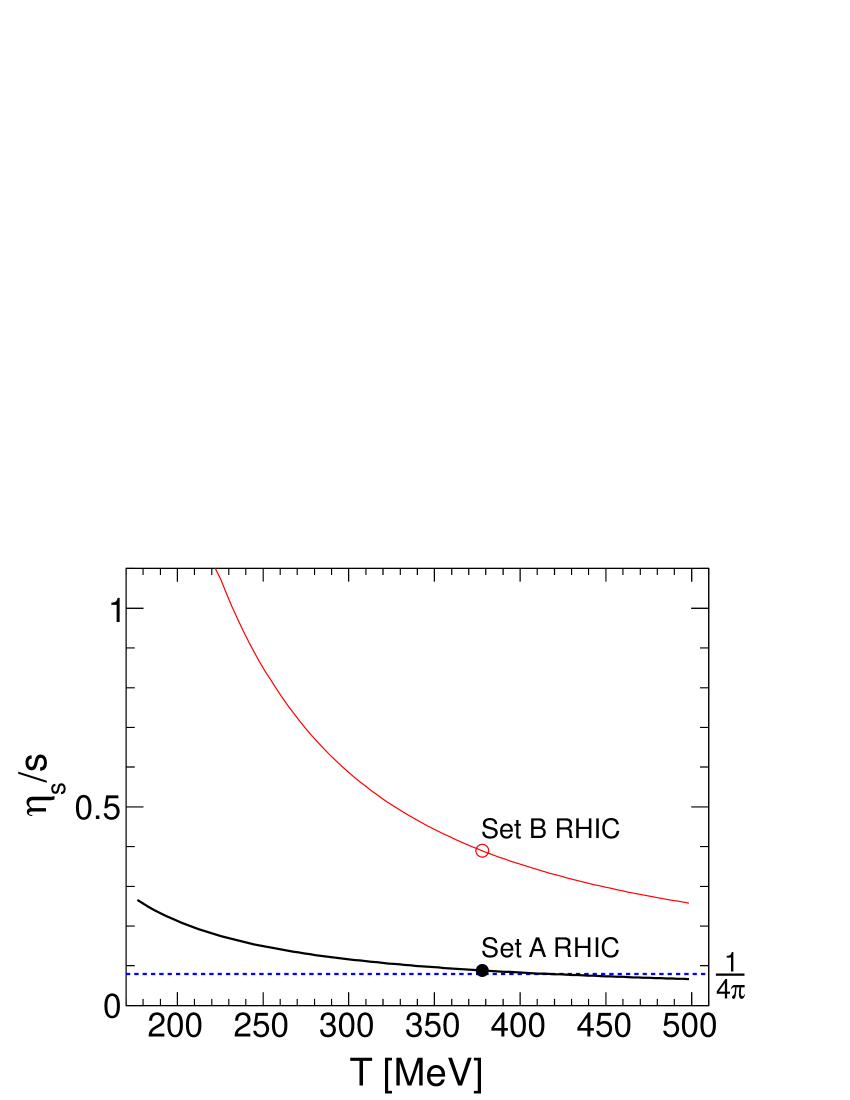
In this study, we have used parameter set A ( fm-1 and ) corresponding to a larger partonic scattering cross section of 10 mb rather than 1.5 mb for set B. We find a good description of the data with set A by turning of initial and final state radiation in HIJING. This reduces the initial entropy production and multiplicity but in a way that matches the multiplicity at all the energies studied without varying any other parameters. The smaller initial multiplicity compensates for the larger cross sections so that the data are still well described. The estimated from this parameter set is labeled Set A in figure 7. For set A, at 378 MeV is 0.088 which is very close to the ADS/CFT conjectured lower bound. We conclude therefore that the AMPT model can give a good description of the and data with a wide range of values and that it’s crucial to understand the initial entropy production in order to extract the correct value of in the QGP phase.
5 Summary
In this paper, we have presented AMPT SM and Default calculations for and . The primary purpose of these calculations is to provide a reference for measurements of the beam energy dependence of and . We found that we can describe RHIC and LHC data on multiplicity, and by turning off initial and final state radiation in HIJING (reducing the initial entropy) but keeping relatively large cross-sections in the QGP phase. Whereas a previous study found a good description of data using a much smaller cross-section implying a much larger value for , our studies with a larger cross-section implies a ratio of viscosity to entropy much closer to the ADS/CFT conjectured lower bound. We have also studied how changes from 7.7 GeV to 2.76 TeV. We find that within this model, changes very little across the whole energy range studied, consistent with what is observed in data. We also find that AMPT reproduces the experimental observation that . These experimental observations therefore seem to be understandable without major changes to our description of heavy ion collisions and a subsequentx nearly perfect liquid QGP phase. Our studies of the centrality and beam energy dependence of and with SM and Default settings provide a comparitive base-line for studies of and in the RHIC beam energy scan.
Acknowledgements We would like to thank Zi-Wei Lin, Jun Xu and Che-Ming Ko for their guidance in carrying out the AMPT studies. This work is supported by the U.S. Department of Energy under contract DE-AC02-98-CH10886. Financial support from the Department of Science and Technology, Government of India, is gratefully acknowledged.
References
- [1] W. Reisdorf and H. G. Ritter, Ann. Rev. Nucl. Part. Sci. 47, 663 (1997); N. Herrmann, J. P. Wessels and T. Wienold, Ann. Rev. Nucl. Part. Sci. 49, 581 (1999).
- [2] Y. Aoki, G. Endrodi, Z. Fodor, S. D. Katz and K. K. Szabo, Nature 443, 675 (2006). F. Karsch, PoS C POD07 (2007) 026. PoS LAT2007 (2007) 015.
- [3] S. A. Voloshin, A. M. Poskanzer and R. Snellings, arXiv:0809.2949 [nucl-ex]; P. Sorensen, arXiv:0905.0174 [nucl-ex].
- [4] J. Adams et al. [STAR Collaboration], Phys. Rev. C 72, 014904 (2005); K. Aamodt et al. [ The ALICE Collaboration ], Phys. Rev. Lett. 105, 252302 (2010).
- [5] A. P. Mishra, R. K. Mohapatra, P. S. Saumia and A. M. Srivastava, Phys. Rev. C 77, 064902 (2008) [arXiv:0711.1323 [hep-ph]].
- [6] A. Mocsy and P. Sorensen, arXiv:1008.3381 [hep-ph]; [arXiv:1101.1926 [hep-ph]].
- [7] P. Sorensen, arXiv:0808.0503 [nucl-ex].
- [8] J. Adams et al. [STAR Collaboration] Phys. Rev. Lett. 95:152301, (2005); F. Wang [STAR Collaboration], J. Phys. G 30 (2004) S1299 [arXiv:nucl-ex/0404010]; J. Adams et al. [STAR Collaboration], Phys. Rev. C 73 (2006) 064907 [arXiv:nucl-ex/0411003]; J. Putschke, J. Phys. G 34 (2007) S679 [arXiv:nucl-ex/0701074]; J. Adams et al. [Star Collaboration], Phys. Rev. C 75 (2007) 034901 [arXiv:nucl-ex/0607003]; Brijesh Srivastava for the STAR Collaboration, Int. J. Mod. Phys. E16, 3371 (2008); Feb. 4th-10th, 2008, to be published in conference proceedings; A. Adare et al. [PHENIX Collaboration], Phys. Rev. C 78 (2008) 014901 [arXiv:0801.4545 [nucl-ex]]; B. Alver et al. [ PHOBOS Collaboration ], J. Phys. G G35, 104080 (2008).
- [9] J. Adams et al. [STAR Collaboration], Phys. Rev. Lett. 95, 152301 (2005) [nucl-ex/0501016].
- [10] S. A. Voloshin, Nucl. Phys. A 749, 287 (2005) [nucl-th/0410024].
- [11] J. Takahashi, B. M. Tavares, W. L. Qian, R. Andrade, F. Grassi, Y. Hama, T. Kodama and N. Xu, Phys. Rev. Lett. 103, 242301 (2009) [arXiv:0902.4870 [nucl-th]].
- [12] W. Broniowski, P. Bozek and M. Rybczynski, Phys. Rev. C 76, 054905 (2007) [arXiv:0706.4266 [nucl-th]].
- [13] B. Alver and G. Roland, Phys. Rev. C 81, 054905 (2010) [Erratum-ibid. C 82, 039903 (2010)] [arXiv:1003.0194 [nucl-th]].
- [14] G. L. Ma, S. Zhang, Y. G. Ma, H. Z. Huang, X. Z. Cai, J. H. Chen, Z. J. He and J. L. Long et al., Phys. Lett. B 641, 362 (2006) [nucl-th/0601012].
- [15] J. Xu and C. M. Ko, Phys. Rev. C 84, 014903 (2011) [arXiv:1103.5187 [nucl-th]].
- [16] Z. -W. Lin, C. M. Ko, B. -A. Li, B. Zhang and S. Pal, Phys. Rev. C 72, 064901 (2005) [nucl-th/0411110].
- [17] X. -N. Wang and M. Gyulassy, Phys. Rev. D 44, 3501 (1991).
- [18] W. -T. Deng, X. -N. Wang and R. Xu, Phys. Rev. C 83, 014915 (2011) [arXiv:1008.1841 [hep-ph]].
- [19] B. Abelev et al. [ALICE Collaboration], Pb-Pb collisions at TeV,” Phys. Rev. Lett. 105, 252301 (2010) [arXiv:1011.3916 [nucl-ex]].
- [20] S. A. Voloshin, A. M. Poskanzer, A. Tang and G. Wang, Phys. Lett. B 659, 537 (2008).
- [21] L. Adamczyk et al. [STAR Collaboration], arXiv:1206.5528 [nucl-ex].
- [22] P. Sorensen [STAR Collaboration], J. Phys. G 38, 124029 (2011) [arXiv:1110.0737 [nucl-ex]].
- [23] T. A. Trainor, D. J. Prindle and R. L. Ray, arXiv:1206.5428 [hep-ph].
- [24] K. Aamodt et al. [ALICE Collaboration], Phys. Rev. Lett. 107, 032301 (2011) [arXiv:1105.3865 [nucl-ex]].
- [25] J. D. Bjorken, Phys. Rev. D 27, 140 (1983).
- [26] P. Petreczky, Nucl. Phys. Proc. Suppl. 140, 78 (2005) [hep-lat/0409139].
-
[27]
See PHENIX website:
http://www.phenix.bnl.gov/WWW/plots/show_plot.php?editkeyp̄1164 - [28] J. Xu and C. M. Ko, Phys. Rev. C 83, 034904 (2011) [arXiv:1101.2231 [nucl-th]].
- [29] P. Danielewicz and M. Gyulassy, Phys. Rev. D 31, 53 (1985).
- [30] P.K. Kovtun, D. T. Son and A. O. Starinets, Phys. Rev. Lett. 94, 111601 (2005).