xxx–xxx
Star Formation in Quasar Host Galaxies at Redshift 6: Millimeter Surveys and New Insights from ALMA
Abstract
We have been carrying out a systematic survey of the star formation and ISM properties in the host galaxies of z6 quasars. Our 250 GHz observations, together with available data from the literature, yield a sample of 14 z6 quasars that are bright in millimeter dust continuum emission with estimated FIR luminosities of a few to . Most of these millimeter-detected z6 quasars have also been detected in molecular CO line emission, indicating molecular gas masses on order of . We have searched for [C II] 158 micron fine structure line emission toward four of the millimeter bright z6 quasars with ALMA and all of them have been detected. All these results suggest massive star formation at rates of about 600 to 2000 over the central few kpc region of these quasar host galaxies.
keywords:
quasars: general — galaxies: starburst — galaxies: evolution — submillimeter1 Introduction
More than fifty quasars at 6 have been detected from large optical and near-infrared surveys, such as the Sloan Digital Sky Survey (hereafter SDSS, e.g., [Fan et al.(2006), Fan et al. 2006]) and the Canada-France High redshift Quasar Survey (CFHQS, [Willott et al.(2007), Willott et al. 2007]). These objects represent the first generation of supermassive black holes (SMBHs) which formed within 1 Gyr of the Big Bang and are accreting at their Eddington limit (e.g. [Kurk et al. (2007), Kurk et al. 2007]). Strong millimeter dust continuum, molecular CO, and [C II] 158 m fine structure line emission were first detected from the z=6.42 quasar SDSS J114816.64+525150.3 (hereafter J1148+5251, [Bertoldi et al.(2003a), Bertoldi et al. 2003a]; [Maiolino et al.(2005), Maiolino et al.(2012), Maiolino et al. 2005, 2012]; [Walter et al.(2003), Walter et al. 2003]; [Riechers et al.(2009), Riechers et al. 2009]), indicating intense star formation with a peak surface density of over the central 1.5 kpc region ([Walter et al.(2009), Walter et al. 2009]). The dynamical mass estimated with the resolved CO line emission indicates SMBH-bulge mass ratios more than one order of magnitude higher than the typical value found in the present universe ([Walter et al.(2004), Walter et al. 2004]). The millimeter observations of J1148+5251 suggest an early phase of SMBH-galaxy evolution and the dust continuum, molecular/atomic line emission have been searched in more quasars at the highest redshift (e.g. [Carilli et al.(2007), Carilli et al. 2007]; [Wang et al.(2008), wang11a, wang11b, Wang et al. 2008, 2011a, 2011b]; [Venemans et al. (2012), Venemans et al. 2012]). In this paper, we summarize recent millimeter observations of the sample of quasars known at z6 and discuss the star forming activity in these earliest quasar host galaxies.
2 Millimeter observations of the z6 quasars
A sample of 41 quasars at z6 have been observed at 250 GHz using the MAMBO bolometer array on the IRAM 30-m telescope ([Bertoldi et al.(2003a), Bertoldi et al. 2003a]; [Petric et al.(2003), Petric et al. 2003]; [Willott et al.(2007), Willott et al. 2007]; [Wang et al.(2008), wang11a, Wang et al. 2008, 2011a]). This 250 GHz observed sample includes all the most luminous (i.e. SDSS z-band magnitudes of ) objects from the SDSS main survey (e.g. [Fan et al.(2006), Fan et al. 2006]) and the objects from the SDSS southern deep imaging survey and the CFHQS (e.g. [Jiang et al. (2009), Jiang et al. 2009]; [Willott et al.(2007), Willott et al. 2007]) that are one to two magnitudes fainter in the optical compared to the SDSS main survey. The MAMBO observations have reached a typical 1 sensitivity of and 14 out of the 41 objects are detected at , yielding a detection rate of %. This is consistent with the (sub)mm detection rates of optically selected quasars at redshifts 2 and 4 ([Priddey et al. (2003), Priddey et al. 2003]; [Omont et al. (2001), Omont et al. (2003), Omont et al. 2001, 2003]; [Carilli et al.(2001), Carilli et al. 2001]).
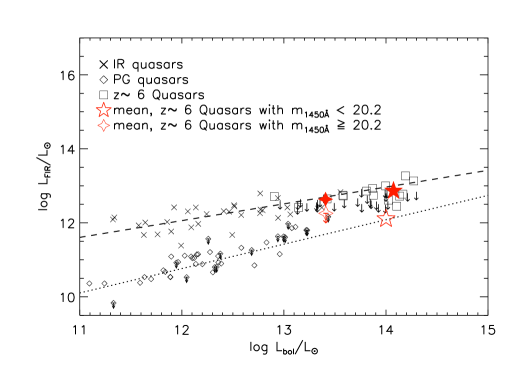
The FIR luminosities estimated with the 250 GHz flux densities for the millimeter-detected z6 quasars are a few to ([Wang et al.(2008), Wang et al.(2011), Wang et al. 2008, 2011]). In the left panel of Figure 1, we compare the FIR-to-AGN bolometric luminosity relation of the z6 quasars to the local optically selected PG quasars and a sample of IR luminous type I quasars hosted in ultra-luminous infrared galaxies ([Hao et al. (2005), Hao et al. 2005]). Most of the millimeter-detected z6 quasars follow the shallower luminosity correlation trend defined by the IR quasars ([Wang et al.(2008), Wang et al.(2011), Wang et al. 2008, 2011]). This may suggest a starburst-dominant FIR emission in the millimeter bright quasars at z6, similar to that found in the local IR quasars. We also calculate the average FIR emission by stacking the 250 GHz measurements for the MAMBO non-detections in two quasar luminosity bins (i.e. optically bright, rest-frame 1450 AB magnitude , and optically faint, , see [Wang et al.(2011), Wang et al. 2011]). The average FIR luminosity/upper limit for the non-detections is consistent with the trend defined by the local PG quasars.
Molecular CO (6-5) line emission has been detected in eleven of the millimeter-detected quasars at z6 using the IRAM Plateau de Bure Interferometer (PdBI). The result indicates highly excited molecular gas on order of in the quasar host galaxies ([Bertoldi et al.(2003b), Bertoldi et al. 2003b], [Riechers et al.(2009), Riechers et al. 2009]; [Carilli et al.(2007), Carilli et al. 2007]; [Wang et al.(2010), Wang et al.(2011), Wang et al. 2010, 2011]). The FIR and CO luminosities follow the relationship defined by actively star-forming galaxies at low and high redshifts ([Riechers et al.(2006), Riechers et al. 2006]; [Wang et al.(2010), Wang et al. 2010]).
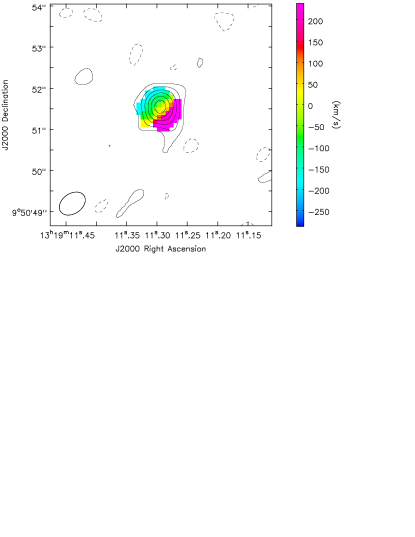
We are also searching for [C II] 158 micron fine structure line emission in our quasar sample. We have an on-going ALMA Cycle 0 program to look for this line in z6 quasars with 250 GHz continuum detections (Wang et al. 2012, in prep.). The data have been obtained for four of them in the extended configuration with typical resolution of and all the four objects show clear detections. The [C II] luminosities are about 1 to 8 and the [C II]-FIR luminosity ratios are of the order of , values that are comparable to those found for other high-z [C II]-detected quasars and about one order of magnitude lower than the typical value of star forming galaxies (e.g. [Maiolino et al.(2009), Maiolino et al. 2009]; [Stacey et al. (2010), Stacey et al. 2010]; [Wagg et al. (2012), Wagg et al. 2012]). The line velocity maps of three of them show indications of velocity gradients along the major axis direction. We plot the line intensity and velocity map for one of the detections, ULAS J131911.29+095051.4 at z=6.132 ([Mortlock et al. 2009, Mortlock et al. 2009]), in the right panel of Figure 1. The line emission is marginally resolved by the beam, with a deconvolved size of (i.e. , fitted to a two-dimensional Gaussian distribution).
3 Discussion: star formation in the millimeter bright z6 quasars
The detections of stong dust continuum, molecular CO and [C II] fine structure line emission from the millimeter bright z6 quasars strongly suggest active star formation in their host galaxies. In particular, the [C II] detections and the line velocity maps from our ALMA observation suggest a nuclear starburst disk over the central few kpc region. If we conservatively assume that 50% of the FIR emission is powered by host galaxy star formation, the estimated star formation rates (SFR) in the quasar host galaxies are about 600 to 2000 (adopting a standard Salpeter initial mass function, [Kennicutt (1998), Kennicutt 1998]). These together with the molecular gas masses measured from the CO line emission yield gas depletion time scales of –.
4 Summary
We summarize recent millimeter observations of the sample of quasars at z6. About 30% of these objects have been detected in strong 250 GHz dust continuum and molecular CO line emission, and our ongoing ALMA observations also detected bright [C II] fine structure line emission in the central few kpc region of the quasar host galaxies. The results suggest massive star formation in the quasar host galaxies, which is in good agreement with the picture of supermassive black hole-galaxy co-evolution at their earliest evolutionary epoch. Further high-resolution imaging of the dust, molecular, and atomic line emission in these objects (e.g. with Cycle 1 and the full configuration of ALMA) will fully probe the gas distribution, star formation rate surface density, star formation efficiency, and dynamical properties of the spheroidal quasar stellar bulges and address the SMBH-bulge relationships and quasar-galaxy evolution at the highest redshift.
This work is based on observations carried out with the Max Planck Millimeter Bolometer Array (MAMBO) on the IRAM 30m telescope, the Plateau de Bure Interferometer, and ALMA (NRAO). IRAM is supported by INSU/CNRS (France), MPG (Germany) and IGN (Spain). The National Radio Astronomy Observatory (NRAO) is a facility of the National Science Foundation operated under cooperative agreement by Associated Universities, Inc. This paper makes use of the following ALMA data: ADS/JAO.ALMA# 2011.0.00206.S . ALMA is a partnership of ESO (representing its member states), NSF (USA) and NINS (Japan), together with NRC (Canada) and NSC and ASIAA (Taiwan), in cooperation with the Republic of Chile. The Joint ALMA Observatory is operated by ESO, AUI/NRAO and NAOJ.
References
- [Bertoldi et al.(2003a)] Bertoldi, F., Carilli, C. L., Cox, P. et al. 2003a, A&A, 406, L55
- [Bertoldi et al.(2003b)] Bertoldi, F., Cox, P., Neri, R. et al. 2003b, A&A, 409, L47
- [Carilli et al.(2001)] Carilli, C.L., Bertoldi, F., Rupen, M.P. et al. 2001, ApJ, 555, 625
- [Carilli et al.(2007)] Carilli, C.L., Neri, R., Wang, R. et al. 2007, ApJ, 666, L9
- [Fan et al.(2006)] Fan, X., Strauss, M.A., Richards, G.T., et al. 2006, AJ, 131, 1203
- [Hao et al. (2005)] Hao, C.N., Xia, X.Y., Mao, S., Wu, H., Deng, Z.G. 2005, ApJ, 625, 78
- [Jiang et al. (2009)] Jiang, L., Fan, X., Bian, F. et al. 2009, AJ, 138, 305
- [Kennicutt (1998)] Kennicutt, R. C. 1998, ARA&A, 36, 189
- [Kurk et al. (2007)] Kurk, J.D., Walter, F., Fan, X. et al. 2007, ApJ, 669, 32
- [Maiolino et al.(2005)] Maiolino, R., Cox, P., Caselli, P. et al. 2005, A&A, 440, L51
- [Maiolino et al.(2009)] Maiolino, R., Caselli, P., Nagao, T., Walmsley, M., De Breuck, C., Meneghetti, M. 2009, A&A, 500, L1
- [Maiolino et al.(2012)] Maiolino, R., Gallerani, S., Neri, R. et al. 2012, MNRAS, 425, L66
- [Mortlock et al. 2009] Mortlock, D.J., Patel, M., Warren, S.J. et al. 2009, A&A, 505, 97
- [Omont et al. (2001)] Omont, A., Cox, P., Bertoldi, F. et al. 2001, A&A, 374, 371
- [Omont et al. (2003)] Omont, A., Beelen, A., Bertoldi, F., McMahon, R. G., Carilli, C. L., & Isaak, K. G. 2003, A&A, 398, 857
- [Petric et al.(2003)] Petric, A. O., Carilli, C. L., Bertoldi, F. et al. 2003, AJ, 126, 15
- [Priddey et al. (2003)] Priddey, R. S., Isaak, K. G., McMahon, R. G., & Omont, A. 2003, MNRAS, 339, 1183
- [Riechers et al.(2006)] Riechers, D.A., Walter, F., Carilli, C.L. et al. 2006, ApJ, 650, 604
- [Riechers et al.(2009)] Riechers, D.A., Walter, F., Bertoldi, F. et al. 2009, ApJ, 703, 1338
- [Stacey et al. (2010)] Stacey, G.J., Hailey-Dunsheath, S., Ferkinhoff, C. et al. 2010, ApJ, 724, 957
- [Venemans et al. (2012)] Venemans, B.P., McMahon, R.G., Walter, F. et al. 2012, ApJ, 751, L25
- [Wagg et al. (2012)] Wagg, J., Wiklind, T., Carilli, C.L. et al. 2012, ApJ, 752, L30
- [Walter et al.(2003)] Walter, F., Bertoldi, F., Carilli, C. et al 2003, Nature, 424, 406
- [Walter et al.(2004)] Walter, F., Carilli, C. L., Bertoldi, F. et al. 2004, ApJ, 615, L17
- [Walter et al.(2009)] Walter, F., Riechers, D., Cox, P. et al. 2009, Nature, 457, 699
- [Wang et al.(2008)] Wang, R., Carilli, C.L., Wagg, J. et al. 2008, ApJ, 687, 848
- [Wang et al.(2010)] Wang, R., Carilli, C.L., Neri, R. et al. 2010, ApJ, 714, 699
- [Wang et al.(2011)] Wang, R., Wagg, J., Carilli, C.L. et al. 2011a, AJ, 142, 101
- [Willott et al.(2007)] Willott, C.J., Delorme, P., Omont, A. et al. 2007, AJ, 134, 2435