Influence of monolayer contamination on electric-field-noise heating in ion traps
Abstract
Electric field noise is a hinderance to the assembly of large scale quantum computers based on entangled trapped ions. Apart from ubiquitous technical noise sources, experimental studies of trapped ion heating have revealed additional limiting contributions to this noise, originating from atomic processes on the electrode surfaces. In a recent work [A. Safavi-Naini et al., Phys. Rev. A 84, 023412 (2011)] we described a microscopic model for this excess electric field noise, which points a way towards a more systematic understanding of surface adsorbates as progenitors of electric field jitter noise. Here, we address the impact of surface monolayer contamination on adsorbate induced noise processes. By using exact numerical calculations for H and N atomic monolayers on an Au(111) surface representing opposite extremes of physisorption and chemisorption, we show that an additional monolayer can significantly affect the noise power spectrum and either enhance or suppress the resulting heating rates.
pacs:
37.10.Ty, 34.35.+a, 37.10.Rs, 72.70.+mI Introduction
Ion trap miniaturization and a precise control of errors in the entangled qubits are two key prerequisites for using trapped laser-cooled atomic ions as multi-qubit logic gates in a scalable quantum architecture HaeffnerPhysRep2008 ; WinelandLaserPhysics2011 ; Wineland1998 . One main source of qubit error in such systems is the motional jitter of the collective behavior of the ions in micro traps Turchette ; DeVoe ; IonTrapCooling2 ; IonHeating3 ; IonHeating2 ; MIT2008 ; MITsupercond11 ; DaniilidisNJP2011 ; Allcock ; wineland2011 . Some of the unwanted heating noise is naturally mitigated by operating the traps at cryogenic temperatures IonHeating3 ; MIT2008 ; MITsupercond11 . However the noise still remains larger than the expected Johnson noise for the traps. Early observations of the dependance of the heating rate on position of the ions above the trap () Turchette and on the elapsed time in the ion-loading region DeVoe ; Turchette , lend credence to the role played by surface contaminants. Further experiments with superconducting traps MITsupercond11 corroborate the understanding that the noise source lies on the surface and not in the bulk. The confirmation has come more directly from two recent and complimentary experiments, where laser cleaning Allcock and ion beam bombardment wineland2011 of the trap electrodes led to a reduction of the noise. The experiment reported in wineland2011 also identified the surface contaminants as carbon based, in the form of 2-3 monolayers (MLs) of hydrocarbons.
Theoretical studies of the anomalous heating have been largely phenomenological, aiming to explain the signatures of this noise. These models use the concept of patch potentials developed by Turchette et al. to explain the motional heating in ions Turchette ; DaniilidisNJP2011 ; Dubessy2009 ; Chuang2011 . In a recent work Safavi-Naini2011 we developed a microscopic model to predict the features of electric field noise (distance, frequency and temperature dependencies) from the details of atomic surface processes. This model is predicated on the idea that the noise in ion traps emanates from a random distribution of fluctuating dipoles associated with individual adatoms on a metallic electrode surface.
In this work we extend our earlier theoretical treatment by investigating the dependence of this surface noise on the presence of an additional ML of atomic species on a gold surface. To do so we present detailed numerical calculations on the adsorbate surface potential in the presence or absence of MLs with different reactivity. To this end, we chose He as the ML atom to represent weak binding (physisorbed species) and N as the ML atom for strong binding (chemisorbed species). For computational simplicity we choose hydrogen (H) as our adsorbate and compare the binding potential of , and . Using density functional theory (DFT) we obtain accurate data for these surface potentials, induced dipole moments and modifications on the phonon density of states. Combined with the semi-analytical treatment of Ref. Safavi-Naini2011 we use this data to extrapolate the resulting impact on phonon induced dipole fluctuations and find that MLs of different reactivity can lead to the completely opposite effects of reducing or enhancing the noise.
The remainder of the paper is structured as follows. In Sec. II we briefly review the problem of anomalous heating in ion traps and summarize the basic assumptions of the model detailed in Ref. Safavi-Naini2011 . As the main part of this work we present in Sec. III our numerical results on adatom surface potentials and induced dipole moments for two different types of MLs on Au. Finally, in Sec. IV we discuss the impact of these findings on the adatom dipole fluctuation spectrum and conclude in Sec. V.
II Anomalous ion heating from fluctuating surface dipoles
In micro-fabricated surface ion traps, which are currently developed for quantum information processing, single or multiple ions are trapped by electric potentials at a distance of a few m above a metal electrode. The resulting trapping frequencies are typically around MHz and allow efficient laser cooling and coherent manipulations of the trapped ion. However, when cooled close to the quantum ground state of the trap, the ion motion is still associated with a comparably large electric dipole moment , where is the charge and the zero-point motion for an ion mass . Fluctuating electric fields from the environment couple to this dipole moment and excite the ion motion with a characteristic heating rate Turchette
| (1) |
where is the fluctuation spectrum of the electric field at the position of the ion. Since limits the time for performing coherent manipulations of the ion, a detailed understanding of , its distance, frequency and temperature dependence, is of central importance for a further optimization and miniaturization of ion micro-traps.
As the trapping distance is decreased the ion becomes increasingly more sensitive to electric noise emerging from microscopic processes on the surface. In Safavi-Naini2011 we developed a microscopic model to describe the electric field noise, which is generated from a random distribution of adatoms on a gold surface. In this case the field fluctuation spectrum for a planar trap geometry is given by
| (2) |
where is the surface density of dipoles and is the spectrum of an individual fluctuating dipole. Eq. (2) predicts the expected scaling and together with Eq. (1) it relates the ion heating rate to the microscopic dynamics of individual surface impurities.
II.1 Phonon induced dipole fluctuations of adatoms
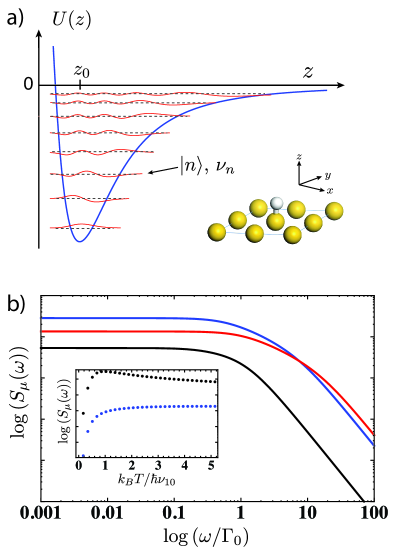
Fig. 1 (a) shows a typical adatom-surface potential , which is attractive at large distances and has a sharp repulsive wall when the electronic wavefunctions of the adatom and the surface atoms start to overlap. The adatom-surface interaction is associated with a distortion of the electronic wavefunctions which results in an induced dipole moment perpendicular to the surface. At large distances one expects Dipole and can reach several Debye when the adatom touches the surface.
The potential usually supports several bound vibrational states with vibrational frequencies and the adatom can undergo phonon induced transitions between those vibrational states. For the corresponding transitions rates are approximately given by Safavi-Naini2011
| (3) | |||||
| (4) |
Here is the surface atom mass, is the phonon density of states (PDOS) and the thermal phonon occupation number, which are both evaluated at the vibrational transition frequency . Due to the different average dipole moment associated with each vibrational state, absorption and emission of phonons creates a fluctuating dipole moment as the adatom jumps between different levels .
II.2 Dipole fluctuation spectrum
From the above considerations and a detailed knowledge of the adatom-surface potential , the induced dipole moment and the phonon density of states , we can evaluate the dipole fluctuation spectrum and thereby the corresponding ion heating rate . The fluctuation spectrum is given by
| (5) |
where and is the projection operator on the vibrational level .
The typical dependence of on frequency and temperature is shown in Fig. 1(b) establishing the rate and the frequency as the relevant scales in the problem. In Safavi-Naini2011 we used approximate analytic model to estimate the relevant scales for a broad range of adatom species, but assuming a clean gold surface. By using a harmonic approximation for and assuming that we obtain Safavi-Naini2011
| (6) |
where is a numerical constant, is the mass of the adsorbate, is the density of the slab, is the potential depth and is the speed of sound.
In the following we consider a more realistic scenario and evaluate the potential modifications of the dipole fluctuation spectrum due to the presence of an additional ML of atoms on top of the Au surface. To do so we present in the following section exact numerical calculations adatom-surface potentials for the case of He and N monolayers, which provides us with an estimate for the minimal and maximal expected modification of the surface potential. Approximate analytic expressions for given in Eq. (6) allow us to extend these predictions for various monolayer-adatom combinations.
III Atom-monolayer-gold surface interaction
The asymptotic potential for a polarizable atom with dynamic polarizability , which approaches a surface of dielectric constant is , where and is the normal to the surface. As the atom approaches the surface, the interaction energy increases due to exchange of energy with phonons, leading to adsorption at some equilibrium distance near the surface, beyond which, for shorter distances of approach, the energy cost of electronic exchange between the electrons of the adsorbate atom and the bulk atom becomes too great to overcome, leading to a repulsive wall in the interaction potential. Below, we present ab initio calculations of the interaction potential energies normal to the substrate surface of H atoms with a ML of adsorbate atoms He and N on top of the Au(111) surface.
III.1 ML surface interaction potentials
Total-energy calculations of bulk Au and Au(111) surfaces, with and without He and N adsorbate atoms, were performed using the spin-polarized density functional theory as implemented in the Vienna Ab initio Software Package (VASP) kresse1996 . The exchange correlation energy was calculated using the local gradient approximation (LDA) with the parametrization of Perdew and Wang (PWC) perdew1992 .
The interaction between valence electrons and ionic cores was described by the Projector Augmented Wave (PAW) method blochl1994 ; kresse1999 . The Au , N and He electrons were treated explicitly as valence electrons in the Kohn-Sham (KS) equations and the remaining cores were represented by PAW pseudopotentials. The KS equations were solved using the blocked Davidson iterative matrix diagonalization scheme followed by the residual vector minimization method. The plane-wave cutoff energy for the electronic wavefunctions was set to 500 eV.
All structures were optimized with periodic boundary conditions applied using the conjugate gradient method, accelerated using the Methfessel-Paxton Fermi-level smearing methfessel1989 with a width of 0.2 eV. The total energy of the system and Hellmann-Feynman forces acting on atoms were calculated with convergence tolerances set to eV and 0.01 eV/Å, respectively. Structural optimizations and properties calculations were carried out using the Monkhorst-Pack special -point scheme monkhorst1976 with and meshes for integrations in the Brillouin zone (BZ) of bulk and slab systems, respectively.
The supercell consisted of a three-layer thick gold slab with orientation and a mesh unit, covered by He or N adsorbate atoms on one side of the slab model. The calculated lattice constant of bulk Au was 4.06 Å, in close agreement with the experimental value of 4.0780 Å at C dutta1963 . The lattice parameters of the Au(111) surface constructed by cleaving the optimized bulk structure were Å and Å, with ca. Å vacuum separating slabs, and and . Although a large vacuum region (ca. 20 Å) was used between periodic slabs, the creation of dipoles upon adsorption of atoms on only one side of the slab can lead to spurious interactions between the dipoles of successive slabs. In order to circumvent this problem, a dipole correction was applied by means of a dipole layer placed in the vacuum region following the method outlined by Neugebauer and Scheffler neugebauer1992 .
The and interaction potentials were calculated by gradually moving a single He or N atom along the -axis normal to the Au(111) surface.
III.2 Atomic adsorption on Au(111)
Four different atomic adsorption sites are possible onto a Au(111) surface: 1) a bridge site between two gold atoms, 2) on top of a gold atom, 3) in a hollow site between three gold atoms, termed an hexagonal close packed (hcp) site when there is a gold atom in the layer directly beneath the surface layer, or 4) termed a face-centered cubic (fcc) site when there is a hole in the layer directly beneath the surface layer.
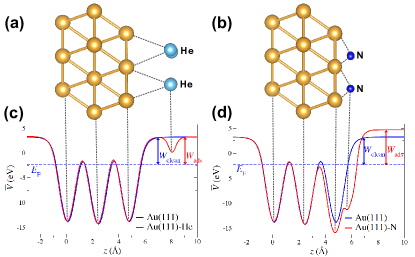
Total-energy calculations indicate that a single He atom adsorbs preferentially at the bridge site ( eV), slightly more energetically favorable than at the top site ( eV), the fcc site ( eV) and the hcp site ( eV). The elongated equilibrium He–Au bond distance of 3.58 Å suggests that He at the bridge site is weakly physisorbed to the Au(111) surface. For the adsorption of a single N atom, the fcc site is energetically preferred ( eV) over the hcp site ( eV), the bridge site ( eV) and the top site ( eV). Contrasting with the He adsorbate, the N atom occupying the fcc site appears chemisorbed to the Au(111) surface with a short N–Au bond distance of 2.05 Å.
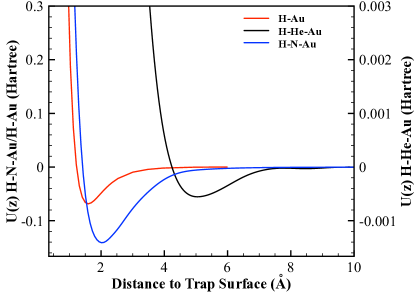
Fig. 2 shows the adsorbate potentials for the two monolayers as well as the bare Au surface. Note that we have shifted the potentials so that . The presence of the weakly adsorbed He results in a much shallower potential while the chemisorbed N has the opposite effect, creating a deeper well that support more bound states.
III.3 Atomic diffusion on Au(111)
Although our primary focus in this work is on dipole fluctuations induced by atomic motion perpendicular to the surface, the numerical data obtained in the previous part allows us with no additional effort to evaluate the diffusion rates of adatoms parallel to the surface. Such data could be relevant to other, diffusion related noise processes Diffusion1 ; Diffusion2 ; Diffusion3 under identical conditions.
The surface diffusion coefficient is given by for an fcc(111) surface, where is the lattice parameter [2.87 Å for Au(111)] and is the jump rate. Two different diffusion regimes exist, namely a thermally activated regime and a quantum tunneling regime.
In the thermally activated regime, the thermal jump rate, , can be calculated through the Arrhenius formula arrhenius1889 ,
| (7) |
where is the activation energy barrier, is the Boltzmann constant, the temperature, and is a prefactor which contains dynamical quantities; Hz for most surfaces ovesson2001 . The diffusion of a He atom on Au(111) is expected to be nearly barrierless due to their weak physisorption interaction.
For the diffusion of a single N atom between adjacent stable fcc sites on Au(111) the activation energy was calculated in this study to be eV using the nudge elastic band method within the DFT framework. This result is close to the value of eV determined previously from experiment and theory for the diffusion of Cr on Au(111) surface ohresser2005 . Following a simple Redhead’s analysis of the migration temperature on solid surfaces masel1996 , we estimate the temperature necessary for a N adatom to overcome this energy barrier to be K [ kcal mol-1 K-1]. Let us note that Redhead’s law predicts the migration temperature of Cr adatoms on Au(111) to be 39 K, in excellent agreement with experimental findings ohresser2005 . The thermally-activated diffusion jump rate of N on Au(111) at 65 K is calculated to be Hz for an activation energy of 0.17 eV and a prefactor Hz; this corresponds to a surface diffusion coefficient . In the temperature range K, and vary from to 2.9 Hz and from to , respectively.
Below K, classical thermally activated surface diffusion can be excluded as the origin of the N adatom diffusion and the site-to-site hopping rate is controlled by quantum tunneling. In this temperature regime the de Broglie wavelength of a N adatom of mass , i.e. , is comparable to the distance separating adjacent adsorption sites on the Au(111) surface, therefore making quantum tunneling possible. For the fundamental energy level, the tunneling jump rate, , can be derived for a one-dimensional parabolic double-well potential and approximated by merzbacher1970
| (8) |
where and is the barrier width [ Å for Au(111)]. Therefore, the activation energy eV corresponds to Hz. If the calculated is considered to be accurate within meV, can vary in the range Hz.
III.4 Work functions and surface dipoles
The work function, , is defined as the minimum energy required to remove an electron from a solid to the vacuum region in the vicinity of the solid surface and is given by:
| (9) |
where is the plane-averaged electrostatic potential in the vacuum at a distance where the microscopic potential has reached its asymptotic value and is the Fermi energy.
The electrostatic potential on a grid in real space can be obtained from a self-consistent electronic structure calculation using a plane wave basis set. Assuming that the surface normal is oriented along the -axis, one can define a plane averaged potential
| (10) |
where is the supercell surface area. The asymptotic value can be extracted by plotting the variation of as a function of , as shown in Fig. 3 for a clean Au(111) surface and for a Au(111) surface covered by 1 ML of He and N atoms.
The calculated Fermi energy and electrostatic potential in the vacuum for the clean Au(111) surface are and . This corresponds to a work function , in good agreement with the experimental value of 5.50 eV recently measured by Bröker et al. for this Miller index plane broker2008 .
Adsorption of one monolayer of He atoms at bridge sites and N atoms at fcc sites onto the Au(111) surface results in and , respectively. Thus, the work functions of He- and N-covered Au(111) surfaces are and .
In order to analyze the change of the work function upon atomic adsorption, we define the variation . For the weakly physisorbed He monolayer this variation is negligible , unlike in the case of the chemisorbed N monolayer . The variation of the work function results from the change in the surface electric dipole caused by adsorption of the adatoms. Simple electrostatics gives the relation jackson1975
| (11) |
where is the surface area taken up by one adatom, is the electric permittivity of free space and is the change in surface dipole that occurs upon atomic adsorption, normalized per adatom. corresponds to the -component of the dipole moment directed along the surface normal, since only this component affects the work function. Since four adatoms form 1 ML covering the supercell surface area, the surface area by adatom can be approximated by . We can now estimate the induced dipole moment for the case of He and N adsorbates. Using a DFT unit cell area of Å2 we find D while D.
It should be noted that the major contribution to the surface dipole results from the charge reordering associated with the formation of the chemical bonds between the metal surface and the adatoms. This contribution is foremost determined by the nature of the chemical bonds, but can also be modified by the packing density of the adatoms.
III.5 Phonon Density of States in Presence of the Monolayer Adsorbates
Phonon density of states (PDOS) were calculated by solving the dynamical matrix for bulk Au, clean Au(111) surface, and adsorbates (e.g., He or N) on the Au(111) surface as shown in Fig. 4. A supercell was adopted to obtain the force constant matrix of bulk Au that can be derived from the Hellmann-Feynman forces obtained from the DFT calculations using VASP kresse1996 . The calculated PDOS of the bulk Au shows two main peaks represented by “T" and “L" that are in good agreement with previous experimental results lynn . According to Lynn et al. lynn , the longitudinal (L) and transverse (T) phonon modes of bulk Au are 4.61 THz and 2.75 THz, respectively, at a high symmetry point (X) in the Brillouin zone.
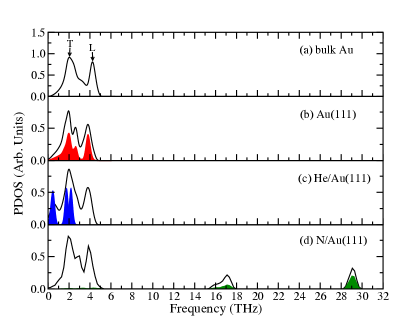
The calculated surface PDOS using the supercells are depicted in Fig. 4(b) for a clean Au(111) surface as well as for 1ML of adsorbates (He or N) on the Au(111) surface. There are three prominent peaks in the calculated PDOS of the clean Au(111) surface, mainly contributed by the partial PDOS projected onto the surface atoms (red shaded area). The previous experimental study has identified four surface modes (2.31 THz, 3.5 THz, 4.0 THz, and 4.3 THz) at a high symmetry point (K) in the surface Brillouin zone ponjee .
The calculated PDOS of the 1ML He-covered Au(111) surface suggests a very weak interaction between He and the metal surface, providing no evidence of stretching or wagging modes of He atoms with respect to the metal surface. However, the partial PDOS projected onto the He atoms (blue shaded area) reveals the possible lattice modes of the 1ML He atoms physisorbed on the surface as shown in Fig. 4(c).
Contrasting with the 1ML He-covered Au(111) surface, two additional peaks appear at high frequency above 5 THz for the 1ML N-covered Au(111) surface due to the wagging and stretching modes of N atoms attributed to the strong interaction with the metal surface, as shown in Fig. 4(d). The green shaded area represents the partial PDOS projected onto the N atoms.
IV Noise spectrum with ML present
Let us now study the impact of the two different types of MLs described above on the dipole fluctuation spectrum of adatoms as discussed in Sec. II. We first note that due to the high reactivity and low mass of H adsorbates – chosen in the previous section to reduce the DFT computational cost – the depth of the binding potential Hartree and vibrational frequencies THz are high. Therefore, for H adatoms thermally activated processes at room temperature do not play a significant role. Instead we use the potentials shown in Fig. 2 together with the mass scaling relations in Eq. (6) to evaluate the noise spectrum for a more realistic set of adsorbates with masses around amu.
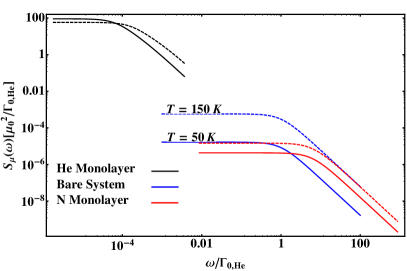
In Fig. 5 we plot the dipole fluctuation spectrum for a bare Au surface and in the presence of a He and N monolayer. For the results shown in Fig. 5 we use the potentials shown in Fig. 2 with an adatom mass of 100 amu and two different temperatures of K (solid) and K (dashed). For the bare Au surface where Å these values correspond to THz, THz and ratios and 0.70 respectively. For a qualitative discussion of the strong modifications of the spectrum in the presence of a ML, we consider low temperatures, where the adatom potential can be approximated by only two vibrational level system and
| (12) |
In Sec. III, we have found that due to its low reactivity, the He monolayer results in a significantly shallower well depth, Hartree, shifting the minimum to Å. Both effects lower the vibrational frequency, THz, and lead to a drastic reduction of the characteristic phonon transition rate MHz. From Eq. (12) this results in an increase of the low frequency noise level, but reduces the noise at frequencies .
The more reactive N monolayer results in a deeper potential well with Hartree, while only slightly affecting the equilibrium distance, Å. This leads to exactly the opposite effect, increasing the vibrational frequency, THz as well as THz. As also seen in Fig. 5, the stronger binding therefore reduces the noise in the low frequency regime. Additionally the low frequency regime of the spectrum extends over a much larger frequency range.
Finally, let us briefly comment on the modified PDOS. Our estimates of so far have been based on Eq. (6), which assumes . This scaling ignores the detailed structure of the PDOS at high frequencies and overestimates for above THz. Although the variations in PDOS shown in Fig. 4 are in general less relevant and only important for adatoms with high vibrational frequencies, it seems feasible to identify ML species, for which the PDOS is peaked at the vibrational frequencies , thereby increasing and suppressing the low frequency noise level.
V Summary and Conclusions
In summary, we have calculated the noise induced heating in ion traps due to randomly-fluctuating adatom dipoles in the presence of a single ML of atomic species on Au(111) surface. Precise DFT calculations of surface potentials for physisorbed and chemisorbed ML species provided us with accurate data for surface potentials, from which the effects on the noise could be evaluated. We have found that within our noise model, the presence of surface contamination can lead to opposite effects of enhancing or reducing the noise level, depending on the reactivity of the ML species as well as the frequency range.
Although an exact quantitative comparison between experiments, for example, in Ref. Allcock and wineland2011 , is beyond the scope of this work, our current analysis points the direction for a more refined understanding of anomalous heating in ion traps, requiring the combined knowledge of atomic surface physics as well as the modeling of different noise processes. In particular, the combined data on surface potentials, PDOS and diffusion rates obtained in this work could in the future serve as a common input to evaluate and compare different alternative noise models. This can lead to better understanding of the noise mechanism, allowing ion traps to be used as exquisite probes of surface reactivity.
VI Acknowledgments
Sandia National Laboratories is a multi-program laboratory managed and operated by Sandia Corporation, a wholly owned subsidiary of Lockheed Martin Corporation, for the U.S. Department of Energy’s National Nuclear Security Administration under contract DE-AC04-94AL85000. P.R. acknowledges support by the Austrian Academy of Sciences, and the Austrian Science Fund (FWF) through the START grant Y 591-N16. This work was supported by NSF through a grant to ITAMP at the Harvard-Smithsonian Center for Astrophysics.
References
- (1) H. Haeffner, C. F. Roos, and R. Blatt, Phys. Rep. 469, 155 (2008).
- (2) D. J. Wineland and D. Leibfried, Laser Phys. Lett. 8, 175 (2011).
- (3) D. J. Wineland, C. Monroe, W. M. Itano, D. Leibfried, B. E. King, and D. M. Meekhof, J. Res. Natl. Inst. Stand. Technol. 103, 259 (1998).
- (4) Q. A. Turchette, D. Kielpinski, B. E. King, D. Leibfried, D. M. Meekhof, C. J. Myatt, M. A. Rowe, C. A. Sackett, C. S. Wood, W. M. Itano, C. Monroe, and D. J. Wineland, Phys. Rev. A 61, 063418 (2000).
- (5) R. G. DeVoe and C. Kurtsiefer, Phys. Rev. A 65, 063407 (2002).
- (6) L. Deslauriers, P. C. Haljan, P. J. Lee, K-A. Brickman, B. B. Blinov, M. J. Madsen, and C. Monroe, Phys. Rev. A 70, 043408 (2004).
- (7) L. Deslauriers, S. Olmschenk, D. Stick, W. K. Hensinger, J. Sterk, and C. Monroe, Phys. Rev. Lett. 97, 103007 (2006).
- (8) R. J. Epstein et al., Phys. Rev. A 76, 033411 (2007).
- (9) J. Labaziewicz et al., Phys. Rev. Lett. 100, 013001 (2008); J. Labaziewicz et al., Phys. Rev. Lett. 101, 180602 (2008).
- (10) S. X. Wang, Y. Ge, J. Labaziewicz, E. Dauler, K. Berggren, and I. L. Chuang, App. Phys. Lett. 97, 244102 (2010).
- (11) N. Daniilidis, S. Narayanan, S. A. Möller, R. Clark, T. E. Lee, P. J. Leek, A. Wallraff, St. Schulz, F. Schmidt-Kaler, and H. Häffner, New J. Phys. 13, 013032 (2011).
- (12) D. T. C. Allcock, L. Guidoni, T. P. Harty, C. J. Ballance, M. G. Blain, A. M. Steane, and D. M. Lucas, New J. Phys. 13, 123023 (2011).
- (13) D. A. Hite et al., Phys. Rev. Lett. 109, 103001 (2012).
- (14) R. Dubessy, T. Coudreau, and L. Guidoni, Phys. Rev. A 80, 031402 (2009).
- (15) G. H. Low, P. F. Herskind, and I. L. Chuang, Phys. Rev. A 84, 053425 (2011).
- (16) A. Safavi-Naini, P. Rabl, P. F. Weck, and H. R. Sadeghpour, Phys. Rev. A 84, 023412 (2011).
- (17) P. R. Antoniewitz, Phys. Rev. Lett. 32, 1424 (1974).
- (18) G. Kresse and J. Furthmüller, Phys. Rev. B 54, 11169 (1996).
- (19) J. P. Perdew and Y. Wang, Phys. Rev. B 45, 13244 (1992).
- (20) P. E. Blöchl, Phys. Rev. B 50, 17953 (1994).
- (21) G. Kresse and D. Joubert, Phys. Rev. B 59, 1758 (1999).
- (22) M. Methfessel and A. T. Paxton, Phys. Rev. B 40, 3616 (1989).
- (23) H. J. Monkhorst and J. D. Pack, Phys. Rev. B 13, 5188 (1976).
- (24) B. N. Dutta and B. Dayal, Phys. Stat. Sol. 3, 473 (1963).
- (25) J. Neugebauer and M. Scheffler, Phys. Rev. B 46, 16067 (1992).
- (26) M. A. Gesley and L. W. Swanson, Phys. Rev. B 32, 7703 (1985).
- (27) G. W. Timm and A. Van der Ziel, Physica 32, 1333 (1966).
- (28) C. Henkel and B. Horovitz, Phys. Rev. A 78, 042902 (2008).
- (29) S. Arrhenius, Z. Phys. Chem. (Leipzig) 4, 226 (1889).
- (30) S. Ovesson, A. Bogicevic, G. Wahnström, and B. I. Lundqvist, Phys. Rev. B 64, 125423 (2001).
- (31) P. Ohresser, H. Bulou, S. S. Dhesi, C. Boeglin, B. Lazarovits, E. Gaudry, I. Chado, J. Faerber, and F. Scheurer, Phys. Rev. Lett. 95, 195901 (2005).
- (32) R. I. Masel, Principles of Adsorption and Reaction on Solid Surfaces, Wiley, New York, 1996.
- (33) E. Merzbacher, Quantum Mechanics, Wiley, New York, 1970.
- (34) B. Bröker, R.-P. Blum, J. Frisch, A. Vollmer, O. T. Hofmann, R. Rieger, K. Müllen, J. P. Rabe, E. Zojer, and N. Koch, Appl. Phys. Lett. 93, 243303 (2008).
- (35) J. D. Jackson, Classical Electrodynamics, Wiley, New York, 1975.
- (36) J. W. Lynn, H. G. Smith, and R. M. Nicklow, Phys. Rev. B 8, 3493 (1973).
- (37) M. W. G. Ponjee, C. F. J. Flipse, A. W. Denier van der Gon, and H. H. Brongersma, Phys. Rev. B 67, 174301 (2003).
- (38) S. Wetterer, D. Lavrich, T. L. Cummings, S. L. Bernasek and G. Scoles., J. Phys. Chem. B 102, 9266 (1998)