Comparison of Ground- and Space-based Longitudinal Magnetograms
Abstract
We compare photospheric line-of-sight magnetograms from the Synoptic Long-term Investigations of the Sun (SOLIS) vector spectromagnetograph (VSM) instrument with observations from the 150-foot Solar Tower at Mt. Wilson (MWO), Helioseismic and Magnetic Imager (HMI) on Solar Dynamics Observatory (SDO), and Michelson Doppler Imager (MDI) on Solar and Heliospheric Observatory (SOHO). We find very good agreement between VSM and the other data sources for both disk-averaged flux densities and pixel-by-pixel measurements. We show that the VSM mean flux density time series is of consistently high signal-to-noise with no significant zero-offsets. We discuss in detail some of the factors -spatial resolution, flux dependence and position on the solar disk- affecting the determination of scaling between VSM and SOHO/MDI or SDO/HMI magnetograms. The VSM flux densities agree well with spatially smoothed data from MDI and HMI, although the scaling factors show clear dependence on flux density. The factor to convert VSM to HMI increases with increasing flux density (from 1 to 1.5). The nonlinearity is smaller for the VSM vs. SOHO/MDI scaling factor (from 1 to 1.2).
keywords:
Solar magnetic fields, photosphere, magnetograms1 Introduction
Synoptic observations play a key role in, e.g., space weather forecasting and solar-stellar studies as well as understanding the fundamental properties of solar activity. A good synoptic data set has a long duration and consistently high quality e.g., no artificial trends or jumps in the data and only few outlier points. For long-term measurements, however, it is inevitable that instruments will be upgraded or even replaced. It is therefore critical to ensure the continuity of data sets from one instrument to another. Inter-instrument comparisons are one way to ensure the continuity. The aim of this paper is to provide a comparison between the Synoptic Long-term Investigations of the Sun (SOLIS; \openciteKeller+others2003) photospheric line-of-sight (LOS) magnetograms and the synoptic data sets from the 150-foot Solar Tower at Mt. Wilson (MWO; \openciteUlrich+others2002), Helioseismic and Magnetic Imager (HMI; \openciteHMI) on the Solar Dynamics Observatory (SDO) satellite and Michelson Doppler Imager (MDI; \opencitemdi) on the Solar and Heliospheric Observatory (SOHO) satellite.
In earlier days of solar magnetography, several studies were conducted to compare the LOS and vector magnetograms taken by different observatories. These early studies indicated difficulties when comparing the not strictly simultaneous observations taken with different spatial and spectral resolution and in different spectral lines. The results of comparisons also depend on position on the solar disk and which solar feature is under consideration (see \inlineciteDemidov+others2008 for details and additional references). More recently, \inlineciteLeka+Barnes2012 present a comprehensive study of the effects of different spatial resolutions on magnetic field measurement comparisons confirming many earlier findings. Other examples of magnetogram comparisons include Tran et al. (2005; SOHO/MDI and MWO), Berger and Lites (2003; Advanced Stokes Polarimeter at NSO/Sacramento Peak and and SOHO/MDI), and Liu et al. (2012; SDO/HMI and SOHO/MDI). While the three comparisons above include data from either MDI, MWO, and/or HMI, the main difference between them and the comparison presented here is that they are either for very low spatial resolution, all space-based instruments, or for a single observation. In contrast, SOLIS magnetograms are synoptic, ground-based, and have moderate spatial resolution. The vector spectro-magnetograph (VSM) on SOLIS was designed in part to continue the synoptic data set of LOS magnetograms from the 512-channel magnetograph and the NASA/NSO Spectromagnetograph (SPM) operated during 1974–2003 at NSO/Kitt Peak (\opencitekpvt1,1976b; \openciteJones+others1992). Comparison of SOLIS/VSM measurements with MDI, HMI, and MWO is necessary for ensuring the continuity of the combined data set from these two NSO instruments.
2 SOLIS VSM
SOLIS is a synoptic facility to study the solar activity cycle, energetics in the solar atmosphere, and solar irradiance changes. It consists of three telescopes: The 50 cm vector spectro-magnetograph (VSM), the 8 mm integrated sunlight spectrometer (ISS), and the 14 cm full-disk patrol (FDP). Currently there is one SOLIS system operating at Kitt Peak in Arizona, but a global network of SOLIS/VSM instruments is envisioned in the NSO long range plan. VSM, operational since 2003, is designed to measure solar magnetic fields in a synoptic manner to address the SOLIS science questions and to continue the synoptic observations made by NSO during 1974-2003. The VSM magnetic field observations include measurements of the full vector field (Stokes , , and ) using the photospheric Fe i 630.15 and 630.25 nm lines and full-disk LOS flux density measurements (Stokes and ) using photospheric Fe i 630.15 nm and chromospheric Ca ii 854.2 nm lines.
Several authors (e.g., \openciteJones+Ceja2001; \openciteThornton+Jones2002; \openciteWenzler+others2004; \openciteDemidov+others2008) have shown that the Kitt Peak SPM and MDI data are in good agreement except that the MDI measurements are a factor 1.4 higher than raw SPM measurements Jones and Ceja (2001); Thornton and Jones (2002); Wenzler et al. (2004). \inlineciteJones+others2004 compared VSM measurements with SPM and found that the two are virtually identical except for the improved sensitivity of VSM. Since the agreement between SPM and MDI as well as SPM and VSM has already been established by other authors, we do not include SPM data in the current analysis. The differences between measurements can be attributed to several factors. Berger and Lites (2002, 2003) present a detailed comparison of magnetograms derived from slit- and filter-based instruments and conclude that the response of filter-based magnetograms depends strongly on thermodynamic conditions, spatial resolution and field inclination effects. The effect of spectral resolution on LOS flux measurements and choice of method used to measure the flux was addressed by \inlineciteCauzzi+others1993. They found that the center of gravity method Rees and Semel (1979) offers the best way to measure LOS fields from high and moderate spectral resolution observations while the derivative method based on the weak field approximation and the single wavelength modeling-based calibration result in increased scatter. Also other factors such as calibration procedures, e.g., treatment of instrumental polarization and zero-offsets, and choice of spectral line can contribute to discrepancies between instruments. Due to these multiple factors even spectrograph-based instruments do not necessarily result in identical magnetograms.
A detailed description of the VSM telescope and spectrograph can be found in, e.g., \inlinecitesolis and \inlineciteKeller+others2003. The VSM magnetograms are constructed by scanning (2048 steps) in declination (from geocentric south to north) with the spectrograph slit across the solar disk. The slit, 2048′′ in length, is oriented in the east-west direction. Thus, a single scanline provides full spectra for all points on the solar disk from the eastern to the western limb. Currently there is no telescope guider to stabilize the image during the observations. This may lead to shifts of the solar image relative to the slit during bad seeing conditions. Seeing conditions can be considered bad when granulation is not visible in the continuum intensity images. To account for the curvature of the spectrum, the slit is curved with a radius of 16173′′ (the center of the slit is shifted southward by approximately 32′′ relative to the endpoints of the slit). The image of the spectrum is split by a focal plane beam-splitter into two parts, each 1024′′ long, which are re-imaged onto two separate 1024256 pixel CCD cameras (camera A and camera B). The LOS magnetograms are derived from the Stokes () and (-) spectra (nominal spectral sampling is 23 mÅ) using the SPM algorithm Jones et al. (1992); Jones (1996), which is a variant of the center of gravity method Rees and Semel (1979).
The computed magnetograms have an instrumental zero-point magnetic field (“magbias”) that varies as a function of pixel position along the slit. The variations are typically within 2 G (gauss) for the Fe i 630.15 nm line. To remove the magbias, we compute the flux distribution of pixels located in vertical bands (parallel to the scanning direction) across the solar image. Each band is 11 pixels wide and displaced by 1 pixel with respect to the preceding band. Only pixels with values in the range 15 G are used. To mitigate the effect of decaying active regions each band includes pixels from the current observation and also from observations taken during the previous 14 days. A Gaussian fit is applied to determine the center (magbias value) of the individual distributions. The magbias is subtracted from the magnetograms. The end product, zero-point corrected magnetograms, are geometrically corrected to remove the slit curvature and to merge the cameras (by removing the gap between the two halves of the solar disk as observed by the two cameras) in order to produce a circular solar disk with a spatial sampling of about 1′′.
The major changes to VSM since 2003 include a move of the telescope from a temporary site to its current location on Kitt Peak in 2004. The original VSM modulators were replaced in 2006 leading to better polarimetric measurements. The original Rockwell cameras had a pixel size of 1.125′′. In 2010 they were replaced by Sarnoff cameras with smaller pixel size, 1′′, and better sensitivity. The circular polarization efficiency of the current LOS modulator was carefully measured in 2011 and found to range from 0.96 at the east end of the slit to 0.75 at the west end. The modulator efficiency was measured by inserting a linear polarizer followed by a quarter-wave plate in front of the telescope focal plane. Sixty-four sets of solar spectra were recorded with various angles of the polarizer and wave plate relative to the slit direction. Each spectral set consisted of two simultaneous spectra produced by a Savart plate polarizing beam splitter located just in front of the camera focal plane and two sequential spectra produced by changing the modulator state. At each slit position the observed intensities of the four spectra for all 64 combinations of polarizer and wave plate angles were fit to a model of the polarization properties of the telescope and spectrograph. Seven parameters of the model were allowed to vary in the fitting process while another seven were fixed based on previous measurements. One of the adjustable parameters is the amount by which circular polarization fails to be completely modulated as recorded by the cameras. This factor varies along the slit and depends mainly on imperfect performance of the modulator, unmodulated scattered light within the spectrograph, and image lag within the camera CCD detectors. Dividing one by the varying factor produces a multiplicative correction function along the slit that is applied to recorded magnetograms. This process corrects measured magnetic field values that are weakened by internal instrumental effects. Calibration data needed to construct a correction function are not available for the Rockwell era.
The level of scattered light in VSM is less than 10%. It varies with position in the final optical plane and with the position of the Sun on the entrance slit. The correction function for the efficiency of the modulator for Sarnoff includes instrumental scattered light. Scattered light from other sources, i.e., atmosphere, telescope and image blurring, is not accounted for. The reduction in the apparent circular polarization signal due to scattered light is most pronounced in sunspot umbrae.
An internal calibration to account for the camera change was done by comparing the widths of flux density distributions in remapped heliographic (180180∘) magnetograms during 2009 and 2010. It was determined that a scaling factor of 1.59 needs to be applied to the raw VSM/Rockwell magnetograms to reconcile the observations made with VSM/Rockwell and VSM/Sarnoff. This relatively large factor is attributed to image lag in the Rockwell cameras and not using a modulator efficiency correction function for Rockwell data.
The full-disk LOS Fe i 630.15 nm magnetograms (referred to as Level2 data products) are used to create synoptic maps and mean magnetic flux density time series (Level3). All SOLIS data products are available on-line at: http://solis.nso.edu. For the comparisons discussed in this paper we use VSM data taken after the new modulator was installed in 2006.
2.1 Weak Signal Distribution
To estimate the noise level of VSM LOS Fe i 630.15 nm magnetograms and how it varies spatially we make a data cube () of all magnetograms where the solar radius is larger than 855 pixels (for VSM/Rockwell, 272 magnetograms) or 970 pixels (VSM/Sarnoff, 195 magnetograms). The radius criterion is used to minimize the effect of size variation of the solar disk on the noise levels per pixel. We then fit Gaussian functions to the distributions of low flux density pixels (below 100 G) for each pixel on the solar disk. The width, , of the Gaussian is used as a proxy for noise. This is an upper limit for instrumental noise since the distribution is dominated by a significant amount of genuine weak solar signals: Measurements of the instrumental noise using out of focus images give a pixel-by-pixel noise level of well below 1 G. The results of the analysis are shown in figure \ireffig:noise.
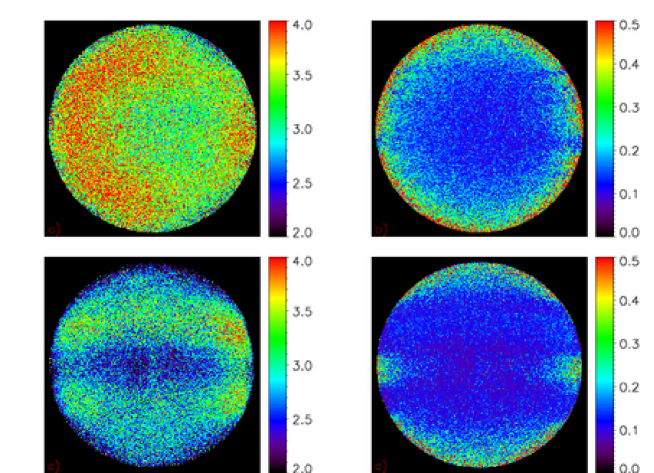
The VSM/Sarnoff noise image (Figure 1c) also includes visible contributions from solar activity, not only weak quiet Sun fields, as seen by the presence of activity belts in the noise images. The mean noise is 2.8 G in VSM/Sarnoff and slightly higher, 3.5 G, in VSM/Rockwell. In both cases the noise is lowest at disk center and increases toward the limb. The noise appears to decrease again very near the limb. The errors of the Gaussian fits, however, also increase near the limb making it difficult to judge the reason for the decrease. In fact, the near limb behavior is expected for a distribution of nearly horizontal fields that become difficult to resolve near the limb (see \openciteHarvey+others2007). Both VSM/Rockwell and VSM/Sarnoff noise images have an area of increased noise near the west limb. This is likely caused by minor vignetting and consequent light level reduction near the west edge of the slit. There is an additional east-west hemisphere asymmetry in the VSM/Rockwell magnetograms, with the exception of the west limb, camera B has lower noise than camera A. This may be due to variation in modulator efficiency (modulator inefficiency is corrected for only in VSM/Sarnoff magnetograms) and possible differences in gain and scattered light. VSM/Sarnoff data do not show this asymmetry. The area around the gap between camera A and camera B is visible as a region of increased noise. The prism that splits the spectrum into the camera A and camera B beams has some dust particles on it. These are nearly in focus at the vertex of the prism but rapidly defocus away from the vertex. When the dust is in focus, it adds noise to the algorithm used to determine the LOS flux density. Since the gap is not always placed on the same position relative to the solar disk (-angle variations and centering of the solar image on the slit) the width of the increased noise region may be exaggerated in the noise image.
3 Comparison of VSM Magnetograms with Other Instruments
3.1 Mean Magnetic Flux Density Comparison
We compare VSM mean flux density measurements (flux density averaged over the entire disk) with MDI and MWO (R. K. Ulrich, private communication) data. The MDI and MWO data are interpolated to the same temporal sampling as VSM and all pixels with values above 1 G are excluded from the analysis. Figures \ireffig:wilson and \ireffig:mdi and Table \ireftab:mf summarize the results of the comparison. The first 780 days of the MWO mean flux density time series have a different zero-offset than the rest of the time series (see the top panels of figure \ireffig:wilson). We exclude these data points from the analysis.
| MWO vs. VSM | -0.019 (0.0038) | 0.75 (0.019) | 0.77 |
| MWO vs. VSM/Rockwell | 0.0011 (0.0026) | 0.59 (0.017) | 0.80 |
| MWO vs. VSM/Sarnoff | -0.0035 (0.0091) | 0.83 (0.028) | 0.77 |
| MDI vs. VSM | -0.18 (0.0023) | 0.62 (0.010) | 0.78 |
| MDI vs. VSM/Rockwell | -0.18 (0.0020) | 0.60 (0.012) | 0.76 |
| MDI vs. VSM/Sarnoff | -0.18 (0.0040) | 0.71 (0.018) | 0.86 |
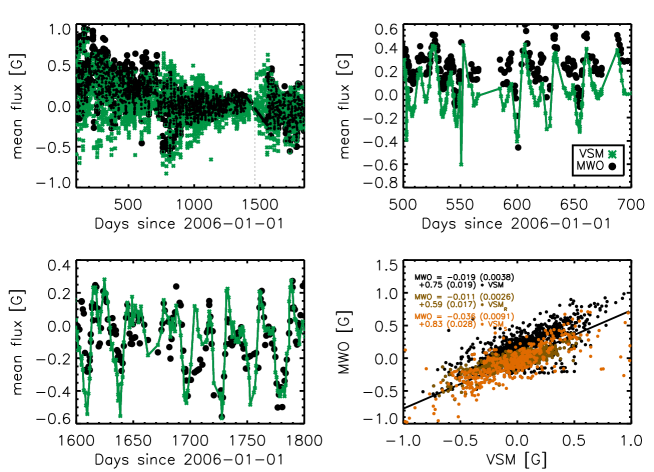
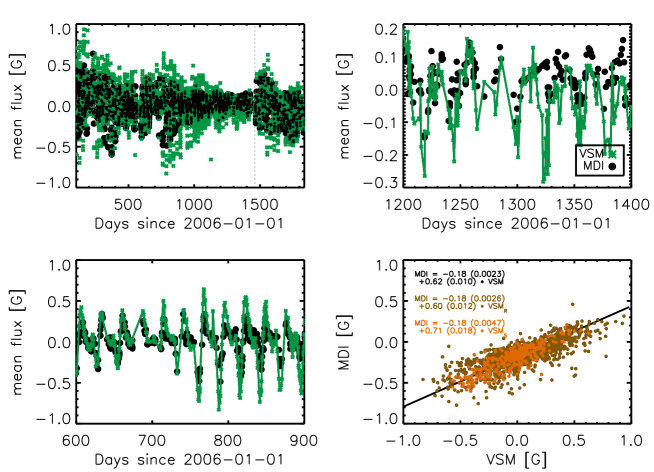
The overall agreement between the data sets, VSM, MWO and MDI, is good: The change in activity level and solar rotation modulation in the three time series are similar and the correlation between the different series is strong. A linear bisector fit Isobe et al. (1990), MDI (MWO) = VSM, gives scaling factors of approximately 0.6 for VSM vs. MDI and 0.75 for VSM vs. MWO.
The zero-offsets for the MWO and VSM mean fluxes are small. For MDI, a considerably larger value is found. It is known that MDI level 1.8 data has a zero-offset so we attribute the offset to be mostly due to MDI. Based on the analysis, the “magbias” applied to the VSM data successfully removes instrumental artifacts. No difference in zero-offsets is seen for VSM/Rockwell and VSM/Sarnoff.
If the VSM time series is divided into VSM/Rockwell and VSM/Sarnoff and the comparison with MDI and MWO is repeated, the retrieved scaling factors for VSM/Rockwell and VSM/Sarnoff are not consistent: The VSM/Sarnoff gives higher values. If only weak fields (data points where the mean flux density is less than 0.3 G) are included, the resulting scaling factors for MDI vs. VSM/Rockwell and MDI vs. VSM/Sarnoff agree within error bars of the fits, 0.62. The disagreement of the mean flux density scaling and agreement of the scaling if only weak fluxes are included indicates that the internal scaling of VSM/Rockwell and VSM/Sarnoff is nonlinear, i.e., weak and strong fields cannot be scaled with a single factor.
3.2 Pixel-by-pixel LOS Magnetogram Comparison
We also make a comparison of VSM magnetograms with HMI and MDI magnetograms on a pixel-by-pixel basis. All the scaling factors are determined from a linear bisector fit to the MDI (HMI) and VSM data points: MDI (HMI) = VSM/Rockwell (VSM/Sarnoff). The 1- errors of the measured scaling factors are small (less than ) and not shown for most of the results.
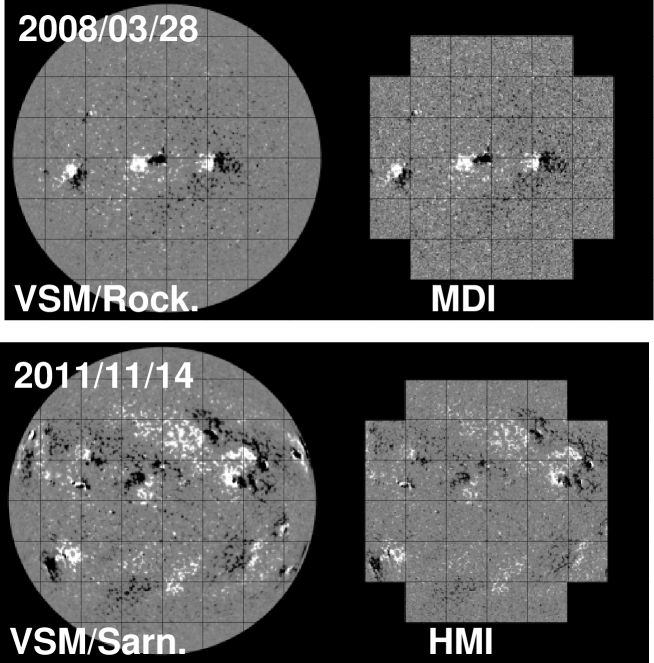
For the pixel-by-pixel comparison, we use full-disk magnetograms from MDI (level 1.8) and HMI (45 s). We compare the magnetograms on the largest pixel scale common to the MDI vs. VSM/Rockwell and HMI vs. VSM/Sarnoff pairs (1.98′′ for MDI vs. VSM/Rockwell and 1′′ for HMI-VSM/Sarnoff). To co-align the magnetograms we divide all the images in 88 tiles (254254 and 128128 pixels for HMI and MDI, respectively). Only tiles which are fully on the solar disk are included in the analysis (see figure \ireffig:fd). To co-register the images we use the Solar Software Freeland and Handy (1998) image co-alignment routine auto_align_images.pro, which determines the scaling and shifts in and as well as allows for possible warping of the magnetograms, due to varying seeing conditions within the VSM data. The alignment is optimized using the Powell minimization algorithm. Cubic convolution is used to interpolate the images onto a common grid. The resulting co-alignment is not very sensitive to the method used: Rigid displacements computed via cross correlations yield very similar results, although the quality of the co-alignment using the first method is better near the limb. We co-align two sets of MDI vs. VSM/Rockwell and three sets of HMI vs. VSM/Sarnoff magnetograms.
The instruments differ not only by their pixel sizes, but in also spatial resolutions and point spread functions leading to very different apparent flux density per pixel of the magnetograms. VSM observations are affected by variations in seeing conditions which can lead to a varying spatial resolution in different magnetograms and, at times, even within a single magnetogram. In particular, the VSM magnetograms are affected during bad seeing conditions by perturbations in seeing moving the solar image on the slit. To compensate for the different spatial resolutions we spatially smooth the space-based images by convolving them with a Gaussian of a given FWHM (FWHM=2.35). A better match between the magnetograms might have been achieved through using a two parameter Voigt function. However, to minimize the number of free parameters in the comparisons, we chose to use a Gaussian with a varying FWHM. The spatially smoothed magnetograms have apparent flux densities in better agreement with the VSM data, but the smoothing also artificially reduces the apparent flux density of the space-based measurements.
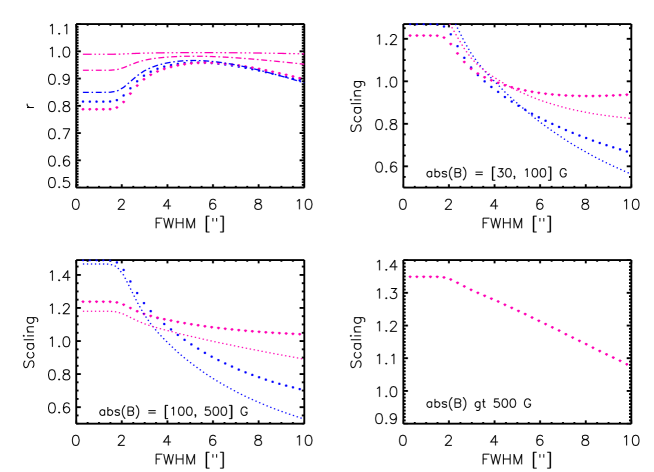
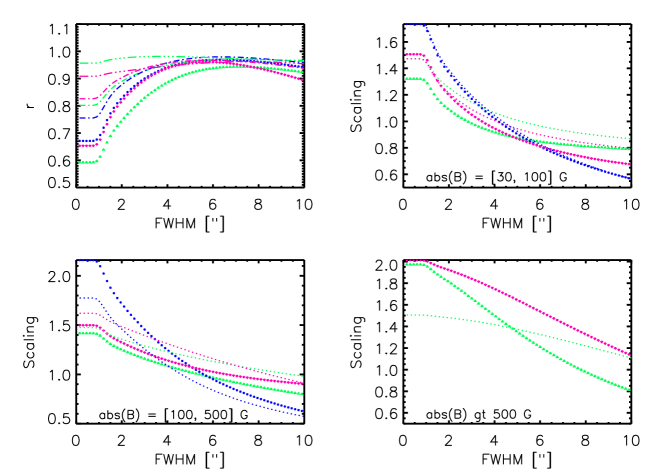
Figures \ireffig:rock-var and \ireffig:sarn-var demonstrate how spatial smoothing changes the magnetograms. Maximizing the correlation coefficient between the magnetograms effectively optimizes the agreement of the apparent flux densities. However, smoothing affects the correlation coefficients differently for weak or strong fluxes.
Scaling factors for the unsmoothed MDI data and VSM data are 1.2-1.4, similar to the values found for SPM and MDI Jones and Ceja (2001); Wenzler et al. (2004). This further demonstrates the good agreement between SPM and VSM data as previously shown by \inlineciteJones+others2004 for early VSM data.
For strong fluxes the effect of smoothing on the correlation function is fairly small. Strong fluxes are easy to co-align and they are nearly always surrounded by fairly strong fluxes leading to strong correlation, even in the case of spatially unsmoothed data. The scaling factor for the strong fluxes decreases with increased smoothing.
For intermediate fluxes (typical features are network fields), the correlation first increases with increased smoothing, reaches a plateau, and eventually begins to decrease again. The scaling factors decrease with increased smoothing, but not in as linear a manner as was the case for the strong fluxes. For the intermediate fluxes an optimal minimum amount of smoothing (i.e., when the plateau is reached) can be roughly determined from figures \ireffig:rock-var and \ireffig:sarn-var: For HMI vs. VSM/Sarnoff it is 4′′ and for MDI vs. VSM/Rockwell 5′′. Note that the optimal smoothing is not the same for all the data sets. In figure \ireffig:sarn-var the green lines correspond to a set when the VSM magnetogram was taken under seeing conditions worse than the two other data sets included in the analysis. The initial correlation coefficient for it is smaller and as a function of smoothing the curve peaks at higher values than for the two other data sets. The effect of location on the solar disk for determining scaling factors is already implied in figures \ireffig:rock-var and \ireffig:sarn-var: Disk center (tiles surrounded in all directions by tiles fully located on the solar disk) and edge (tiles fully on the solar disk, but partially surrounded by tiles not fully on the disk) give slightly different scaling factors.
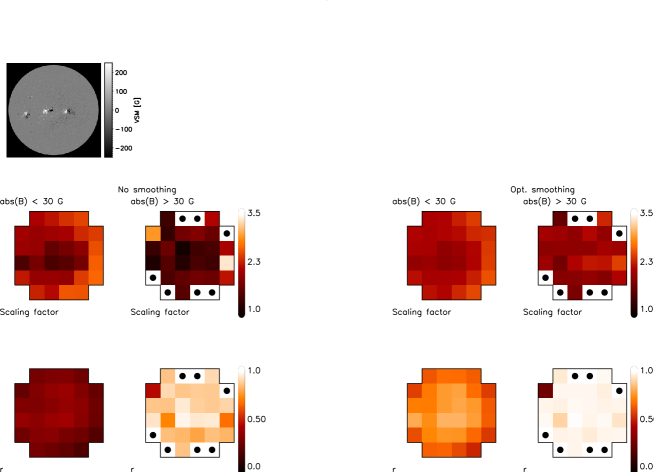
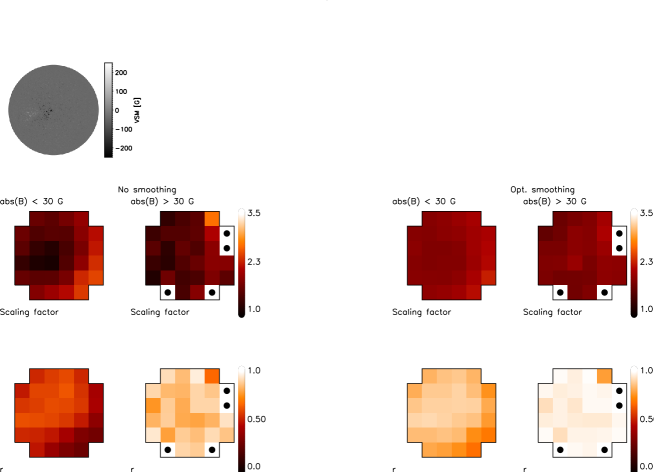
Figure \ireffig:mdi-slope shows how the MDI vs. VSM/Rockwell scaling factors change across the solar disk. Both sets of magnetograms have an east-west asymmetry in the behavior of weak (below 30 G, likely dominated by noise) fields: The west side (especially lower right corner) has weaker correlation and larger scaling factors. This is consistent with higher noise in MDI magnetograms in the bottom right corner; see Figure 9 in \inlineciteLiu+others2012. Spatial smoothing (using the “optimal” 5′′ FWHM Gaussian) increases the spatial homogeneity of the scaling factors, especially for fields clearly above the noise level of unsmoothed MDI data. The spatial variation of the scaling factors can be attributed to center-to-limb variation (and spatial asymmetries in instruments) as well as the amount of flux present in the tile.
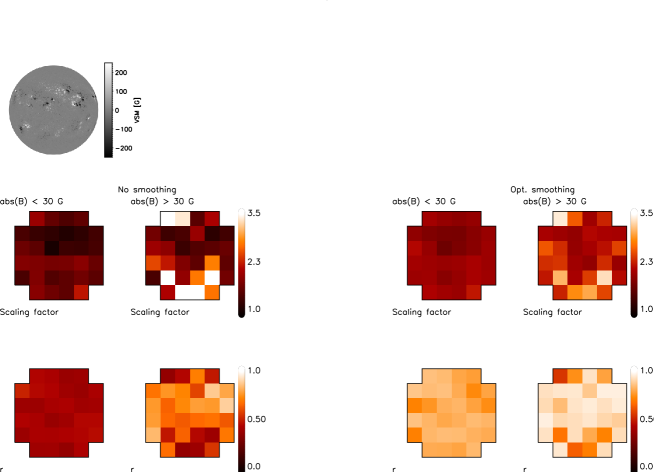

The same tile-by-tile analysis is shown for HMI vs. VSM/Sarnoff in figure \ireffig:hmi-slope. Unlike the MDI vs. VSM/Rockwell case, there is no apparent east-west asymmetry. Tiles with low correlation tend to have higher scaling factors. In the smoothed data these tiles are located mostly near the limb where the noise is higher. The spatial variation of the scaling factors is also partly due to the nonlinearity of the scaling factor as a function of flux density: The scaling between HMI vs. VSM/Sarnoff is more nonlinear than for MDI vs. VSM/Rockwell as shown below.
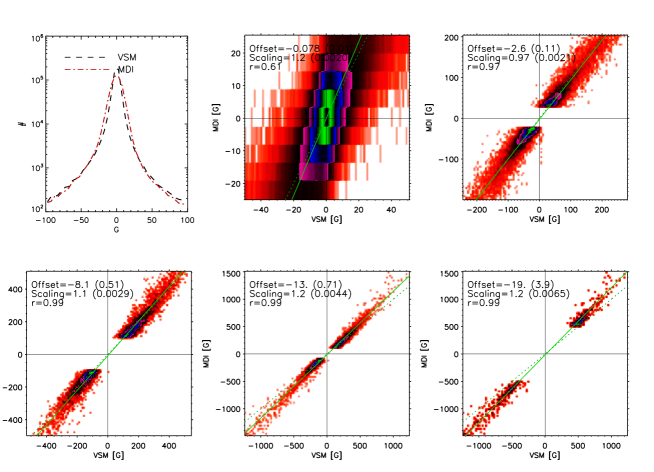
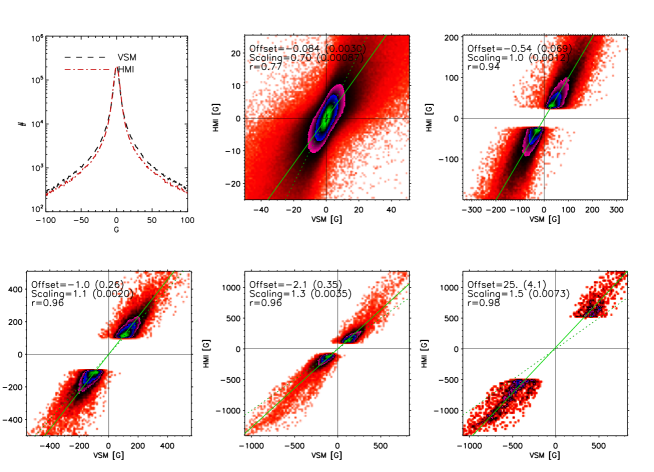
Figures \ireffig:mdi-dflux and \ireffig:hmi-dflux demonstrate how the scaling factors depend on the magnetic flux density range considered. All tiles fully on the solar disk are included in the analysis, i.e., no consideration is given to the relative position, edge or center, of the tiles. The analysis is made for ”optimally” smoothed data (4′′ for HMI vs. VSM/Sarnoff and 5′′ for MDI vs. VSM/Rockwell). Spatial smoothing reduces the noise of the MDI (HMI) magnetograms and brings them closer to the VSM data. Fitting a Gaussian to the histograms of the VSM/Rockwell and VSM/Sarnoff magnetograms gives widths, of 3.8 G and 3.0 G, respectively. Prior to smoothing MDI and HMI s are 24.0 G and 8.8 G, and after smoothing 7.5 G and 3.4 G, respectively. Due to the smaller dynamic range (BSCALE=2.8 G) of MDI, the MDI histogram is binned in increments of 5 G instead of 1 G as was done for the other magnetograms. Doing this gives a slightly larger . If the VSM/Rockwell histogram is binned in increments of 5 G the resulting Gaussian has a slightly larger , 4.3 G.
The flux dependence of the scaling factors is systematic: The scaling factors are larger for higher fluxes. The difference is more modest for MDI vs. VSM/Rockwell (the scaling factor is 1.0 for weak fields, 1.2 for strong fields) than for HMI vs. VSM/Sarnoff (varies from 1.0 to 1.5 for weak to strong fields), i.e., the HMI vs. VSM/Rockwell scaling is more nonlinear. This possibly contributes to the higher spatial inhomogeneity in Figure \ireffig:hmi-slope as compared to Figure \ireffig:mdi-slope. Not surprisingly, the zero-offset, , also increases when strong fluxes are considered.
4 Summary
Determining scaling factors to inter-calibrate magnetograms from different sources is challenging and finding universal scaling factors which apply for all flux ranges, disk positions, spatial resolutions and seeing conditions is unattainable. The comparison presented here, despite the challenges, demonstrates very good agreement between VSM LOS magnetic flux density measurements and data from other sources (MWO, SDO/HMI and SOHO/MDI). This is true both for disk-averaged quantities and pixel-by-pixel comparisons.
Comparison of mean flux density time series shows that the VSM compares favorably with MWO and MDI data: It has no zero-offset issues found in both MDI and MWO data. (A zero-offset is present in the first 780 days of the MWO data used in the comparison.) Despite the nonlinearity at high flux densities, the VSM/Rockwell and VSM/Sarnoff provide a consistent data set of disk-averaged mean flux densities essential for synoptic studies.
The comparison showed that the internal instrument calibration between VSM/Rockwell and VSM/Sarnoff is not fully linear: The internal calibration coefficient, constructed to reach the best possible agreement between VSM magnetograms, does not fully reconcile the mean flux density measurements of VSM/Rockwell and VSM/Sarnoff unless strong fields are excluded. We do not yet fully understand the reason for this nonlinearity.
The noise levels in VSM data are significantly lower than in HMI or MDI, less than 3 G compared to 10 G and 26 G for HMI and MDI Liu et al. (2012). Even after applying optimal spatial smoothing to HMI and MDI data, their noise levels remain somewhat higher than those of VSM. We showed through various analyses how the determination of scaling factors is affected by spatial smoothing, flux dependence, and center-to-limb variations. Spatial smoothing is needed to match the apparent flux densities of the different magnetograms. Smoothing, however, decreases the apparent flux density of the data leading to altered scaling factors. Due to varying seeing conditions, determining optimal smoothing may not be not trivial when the comparison includes ground-based instruments. While the correlation of the magnetograms is fairly constant for a wide range of smoothing amplitudes, the scaling factors can change significantly. Furthermore, for ground-based instruments the optimal smoothing can change not only from one observation to another, but, in the worst case, also within an single observation.
The flux dependence of the scaling factors needs to be considered in the comparisons. In particular, the HMI vs. VSM/Sarnoff comparison showed that even in the case of spatially smoothed data, the scaling factors have a non-negligible dependence on the flux density. There are many possible causes for the nonlinear scaling. For example, scattered light reduces measured fluxes in sunspots in VSM observations. Strong blending in the Ni i 676.8 nm line in the umbrae of sunspots reduces estimates of flux density in instruments that use this line (MDI and Global Oscillation Network Group, GONG). At low flux densities, the scaling factor between MDI vs. VSM/Rockwell is roughly unity and at high densities the scaling factor increases to 1.2. For HMI vs. VSM/Sarnoff the factors are 1 for low and1.5 for high flux densities. Note that these values do not address center-to-limb variation and are computed after spatial smoothing has been applied to the space-based data.
Acknowledgement
We thank R. K. Ulrich for providing the MWO mean flux time series. SOLIS data used here are produced cooperatively by NSF/NSO and NASA/LWS. HMI/SDO is a project of NASA. MDI/SOHO is a project of international cooperation between ESA and NASA.
References
- Balasubramaniam and Pevtsov (2011) Balasubramaniam, K.S., Pevtsov, A.: 2011, Ground-based synoptic instrumentation for solar observations. In: Fineschi, S., Fennelly, J. (eds.),Solar Physics and Space Weather Instrumentation IV., Proc. SPIE 8148. 814809.
- Berger and Lites (2002) Berger, T.E., Lites, B.W.: 2002, Weak-field magnetogram calibration using Advanced Stokes Polarimeter flux-density maps - I. Solar Optical Universal Polarimeter calibration. Sol. Phys. 208, 181.
- Berger and Lites (2003) Berger, T.E., Lites, B.W.: 2003, Weak-field magnetogram calibration using Advanced Stokes Polarimeter flux density maps - II. SOHO/MDI full-disk mode calibration. Sol. Phys. 213, 213.
- Cauzzi et al. (1993) Cauzzi, G., Smaldone, L.A., Balasubramaniam, K.S., Keil, S.L.: 1993, On the calibration of line-of-sight magnetograms. Sol. Phys. 146, 207.
- Demidov et al. (2008) Demidov, M.L., Golubeva, E.M., Balthasar, H., Staude, J., Grigoryev, V.M.: 2008, Comparison of solar magnetic fields measured at different observatories: peculiar strength ratio distributions across the disk. Sol. Phys. 250, 279.
- Freeland and Handy (1998) Freeland, S.L., Handy, B.N.: 1998, Data analysis with the SolarSoft System. Sol. Phys. 182, 497.
- Harvey et al. (2007) Harvey, J.W., Branston, D., Henney, C.J., Keller, C.U., SOLIS and GONG Teams: 2007, Seething horizontal magnetic fields in the quiet solar photosphere. ApJ 659, L177.
- Isobe et al. (1990) Isobe, T., Feigelson, E.D., Akritas, M.G., Babu, G.J.: 1990, Linear regression in astronomy. ApJ 364, 104.
- Jones (1996) Jones, H.P.: 1996, Online analysis and compression of spectra-spectroheliograms. In: Rust,D.M. (ed.). Missions to the Sun, Proc. SPIE 2804, 110.
- Jones and Ceja (2001) Jones, H.P., Ceja, J.A.: 2001, Preliminary comparison of magnetograms from KPVT/SPM, SOHO/MDI and GONG+. In: Sigwarth, M. (ed.) Advanced Solar Polarimetry – Theory, Observation, and Instrumentation, ASP. Conf. Ser. 236, 87.
- Jones et al. (1992) Jones, H.P., Duvall, T.L. Jr., Harvey, J.W., Mahaffey, C.T., Schwitters, J.D., Simmons, J.E.: 1992, The NASA/NSO spectromagnetograph. Sol. Phys. 139, 211.
- Jones et al. (2004) Jones, H.P., Harvey, J.W., Henney, C.J., Keller, C.U., Malanushenko, O.M.: 2004, Measurement scale of the SOLIS vector spectromagnetograph. Bull. Am. Astron. Soc. 36, 709.
- Keller, Harvey, and Giampapa (2003) Keller, C.U., Harvey, J.W., Giampapa, M.S.: 2003, SOLIS: An innovative suite of synoptic instruments. In: Keil, S. L., Avakyan, S. V. (eds.) Innovative Telescopes and Instrumentation for Solar Astrophysics, Proc. SPIE 4853, 194.
- Leka and Barnes (2012) Leka, K.D., Barnes, G.: 2012, Modeling and interpreting the effects of spatial resolution on solar magnetic field maps. Sol. Phys. 277, 89.
- Liu et al. (2012) Liu, Y., Hoeksema, J.T., Scherrer, P.H., Schou, J., Couvidat, S., Bush, R.I., Duvall, T.L., Hayashi, K., Sun, X., Zhao, X.: 2012, Comparison of line-of-sight magnetograms taken by the Solar Dynamics Observatory/Helioseismic and Magnetic Imager and Solar and Heliospheric Observatory/Michelson Doppler Imager. Sol. Phys. 279, 295.
- Livingston et al. (1976a) Livingston, W.C., Harvey, J., Pierce, A.K., Schrage, D. Gillespie, B., Simmons, J., Slaughter, C.: 1976a, Kitt Peak 60-cm vacuum telescope. Appl. Opt. 15, 33.
- Livingston et al. (1976b) Livingston, W.C., Harvey, J., Slaughter, C., Trumbo, D.: 1976b, Solar magnetograph employing integrated diode arrays. App. Opt. 15, 40.
- Rees and Semel (1979) Rees, D.E., Semel, M.D.: 1979, Line formation in an unresolved magnetic element - A test of the centre of gravity method. A&A 74, 1.
- Scherrer et al. (1995) Scherrer, P.H., Bogart, R.S., Bush, R.I., Hoeksema, J.T., Kosovichev, A.G., Schou, J., et al.1995, The Solar Oscillations Investigation - Michelson Doppler Imager. Sol. Phys. 162, 129.
- Scherrer et al. (2012) Scherrer, P.H., Schou, J., Bush, R.I., Kosovichev, A.G., Bogart, R.S., Hoeksema, J.T., et al.2012, The Helioseismic and Magnetic Imager (HMI) Investigation for the S olar Dynamics Observatory (SDO). Sol. Phys. 275, 207.
- Thornton and Jones (2002) Thornton, C.E., Jones, H.P.: 2002, Comparison of three solar magnetographs. Bull. Am. Astron. Soc. 34, 1243.
- Tran et al. (2005) Tran, T., Bertello, L., Ulrich, R.K., Evans, S.: 2005, Magnetic fields from SOHO MDI converted to the Mount Wilson 150 Foot Solar Tower scale. ApJS 156, 295.
- Ulrich et al. (2002) Ulrich, R.K., Evans, S., Boyden, J.E., Webster, L.: 2002, Mount Wilson synoptic magnetic fields: Improved instrumentation, calibration, and analysis applied to the 2000 July 14 flare and to the evolution of the dipole field. ApJS 139, 259.
- Wenzler et al. (2004) Wenzler, T., Solanki, S.K., Krivova, N.A., Fluri, D.M.: 2004, Comparison between KPVT/SPM and SoHO/MDI magnetograms with an application to solar irradiance reconstructions. A&A 427, 1031.