Identifying the Magnetoelectric Modes of Multiferroic BiFeO3
Abstract
We have identified three of the four magnetoelectric modes of multiferroic BiFeO3 measured using THz spectroscopy. Excellent agreement with the observed peaks is obtained by including the effects of easy-axis anisotropy along the direction of the electric polarization. By distorting the cycloidal spin state, anisotropy splits the mode into peaks at 20 and 21.5 cm-1 and activates the lower mode at 27 cm-1 ( K). An electromagnon is identified with the upper mode at 21.5 cm-1. Our results also explain recent Raman and inelastic neutron-scattering measurements.
pacs:
75.25.-j, 75.30.Ds, 78.30.-j, 75.50.EeMultiferroic materials hold tremendous technological promise due to the coupling between the electric polarization and cycloidal magnetic order. Two classes of multiferroic materials have been identified. In “proper” multiferroics, the cycloid develops at a lower temperature than the ferroelectric polarization; in “improper” multiferroics, the electric polarization is directly coupled to the cycloid khomskii06 ; cheong07 so they develop at the same temperature. Although the multiferroic coupling is typically stronger in “improper” multiferroics, those materials also have rather low transition temperatures. Due to the high magnetic transition temperatures of “proper” multiferroics like BiFeO3 with K sosnowska82 ; lebeugle08 ; slee08 , those materials continue to attract a great deal of interest. With the availability of single crystals, the physical understanding of BiFeO3 has advanced rapidly over the past few years but the description of the distorted spin cycloid and microscopic interactions in BiFeO3 remains incomplete.
Recent inelastic neutron-scattering measurements on single-crystal samples of BiFeO3 jeong12 ; matsuda12 were used to estimate the easy-axis anisotropy along the polarization direction as well as the Dzyaloshinskii-Moriya (DM) coupling that induces the long-period cycloidal order with wavevector and ramazanoglu11 ; herrero10 ; sosnowska11 . However, more precise estimates for those coupling constants may be obtained based on the magnetoelectric peaks recently measured using THz spectroscopy talbayev11 . In this work, we evaluate the magnetoelectric peaks from a model that includes easy-axis anisotropy and DM interactions. In addition to providing excellent agreement for three of the four experimental peaks, we also provide several new predictions for the selection rules governing those three peaks and one higher-energy peak.
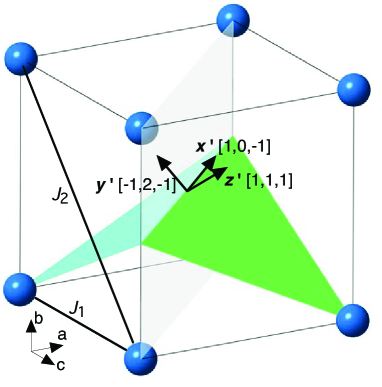
Due to the displacement of the Bi3+ ions, ferroelectricity appears in rhombohedral BiFeO3 below K teague70 . For the pseudo-cubic unit cell in Fig.1 with lattice constant , cycloidal order develops below with propagation vector along for each plane sosnowska82 ; lebeugle08 ; slee08 . Neighboring planes are coupled by the antiferromagnetic (AF) interaction between the Fe3+ spins. The DM interaction along or produces a cycloid with spins in the plane. Easy-axis anisotropy along , parallel to the polarization , distorts the cycloid by producing odd harmonics of the fundamental ordering wavevector kadomtseva04 .
Although is much lower than , the magnetic domain distribution of BiFeO3 can be effectively manipulated by an electric field lebeugle08 ; slee08 ; slee08_2 . In a magnetic field above 20 T, the transformation of the cycloid to an almost commensurate structure with weak ferromagnetic moment ohoyama11 is accompanied by a sharp drop of about 40 nC/cm2 in the electric polarization kadomtseva04 ; park11 ; tokunaga10 . Therefore, the additional polarization observed below is induced by the cycloidal spin state.
This coupling between the cycloid and electric polarization is produced by the inverse DM mechanism katsura05 ; mostovoy06 ; sergienko06 with induced polarization where and are the Fe3+ spins. Within each plane, connects spins at and . So points along and points along .
To evaluate the spin-wave (SW) excitations of BiFeO3, we use the Hamiltonian talbayev11 ; sosnowska95 ; jeong12 :
| (1) |
In the first and second exchange terms, denotes a sum over nearest neighbors and a sum over next-nearest neighbors. The third term originates from the easy-axis anisotropy along and the fourth term from the DM interaction with along . For a fixed cycloidal period, is a smoothly increasing function of , as shown in Fig.5 of Ref.matsuda12 .
Since is close to 1/222, a unit cell containing 222 sites within each plane was used to characterize the distorted cycloid, which was expanded in odd harmonics of the fundamental wavevector fishman10 :
| (2) |
| (3) |
The harmonic coefficients obey the sum .
Excitation frequencies and intensities were evaluated by performing a expansion in the rotated frame of reference for each spin haraldsen09 in the 444-site unit cell with two AF-coupled layers. Due to zone folding, there are 222 positive eigenfrequencies for each wavevector. However, only a handful of those frequencies have any intensity.
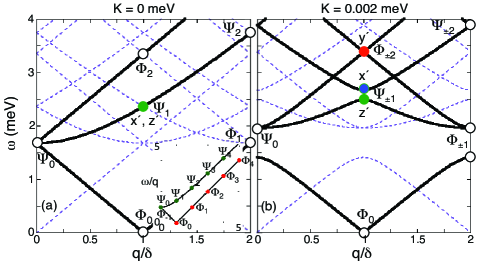
To evaluate the SW frequencies, we use AF interactions meV and meV, which describe the inelastic neutron-scattering measurements jeong12 ; matsuda12 at 200 K temp . Below 4 meV and for , all possible SW frequencies are denoted by the dashed curves in Fig.2 for and 0.002 meV. Branches with nonzero intensity are indicated by the dark solid curves.
When , the two strongest SW branches are plotted in the inset to Fig.2(a) with points at multiples of the wavevector labeled as or . For small frequencies and , and , where is the SW velocity of the linear branches sousa08 . In the reduced-zone scheme, odd- and even- modes lie at the zone center while even- and odd- modes lie at the zone edge .
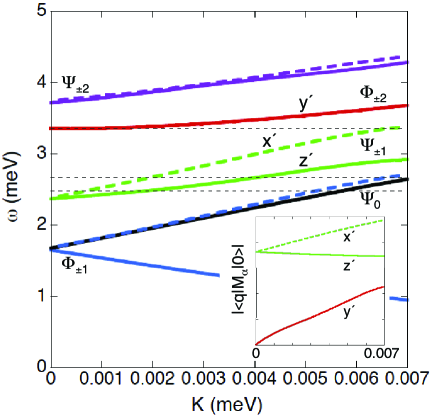
When , the SW spectrum for small frequencies changes dramatically. Higher harmonics of the cycloid split every set of crossing and modes. The largest splitting occurs at between the modes. A smaller splitting occurs at between the modes. While the mode is shifted slightly above zero frequency, the mode is moved up to just below the top mode. Figure 3 plots the evolution of those points with anisotropy. Although too small to appear in this plot, even the modes are split by anisotropy.
Spectroscopic intensities are given by the matrix elements of for magnetic resonance (MR) and by the matrix elements of the induced polarization
| (4) |
for the electromagnon (EM) miyahara12 . Each matrix element is evaluated between the ground state and an excited state containing a single magnon with wavevector at the cycloidal zone center .
When , there is a single MR peak at the point in Fig.2(a). For this mode, and . An EM peak with component coincides with the MR peak. Only the component of is nonzero. No other frequencies at are magnetoelectrically active for .
When , both modes are active with nonzero and MR matrix elements for the upper and lower modes, respectively. The MR matrix elements of those modes are plotted versus anisotropy in the inset to Fig.3. While the matrix element of the lower mode decreases with anisotropy, that of the upper mode increases. Because the third harmonic of the modes couples to the first harmonic of the modes, the lower mode is activated by anisotropy sousa08 with a nonzero MR matrix element plotted in the inset to Fig.3.
A large EM peak with matrix element coincides with the upper mode. Another EM peak with matrix element about 10 times smaller was found at the upper mode with frequency 5.39 meV (43.4 cm-1). This peak also has a significant MR matrix element . Hence, the active peaks correspond to out-of-plane modes of the cycloid (excited by magnetic fields along or ) while the active peaks correspond to in-plane modes of the cycloid (excited by a magnetic field along ).
Below 30 cm-1, THz spectroscopy talbayev11 observed four infrared modes with wavevectors (measured at or extrapolated to 200 K temp ) of 17.5, 20, 21.5, and 27 cm-1. The upper three mode frequencies are denoted by the dashed lines in Fig.3. These modes can be quite accurately described by meV, which produces MR peaks at 2.49, 2.67, and 3.38 meV, remarkably close to the observed peaks at 2.48, 2.67, and 3.35 meV. Talbayev et al. talbayev11 conjectured that the 20 and 21.5 cm-1 lines were produced by the splitting of the modes due to a modulated DM interaction along . We conclude that the splitting of the modes is caused by easy-axis anisotropy along with quantitatively accurate values. Perhaps due to the small matrix element plotted in the inset to Fig.3, the lower peak at 27 cm-1 was not detected talbayev11 above about 150 K.
The selection rules governing the MR modes also agree with the results of Ref.talbayev11 . Field directions and can be written as and . Consequently, the lower mode with MR component and the upper mode with MR component are excited both by fields and , but the lower mode with MR component is only excited by field magnetic-domain . The predicted upper mode with MR component should be excited by both fields and .
Since it is associated with a large EM peak, the upper mode can also be excited by an electric field along . The observation of non-reciprocal directional dichroism (NDD) under an external magnetic field along miyahara12 would confirm this prediction. NDD requires linearly-polarized electromagnetic waves propagating along with electric and magnetic components and .
By contrast, the observed low-energy mode at wavevector 17.5 cm-1 (2.17 meV) cannot be explained by our model because there are no zone-center excitations below the lower mode at 2.5 meV. Nevertheless, the 2.17 meV peak lies tantalizingly close to both the upper mode and the mode at the zone boundary in Fig.2(b). It is possible that the 2.17 meV peak is associated with a more complex magnetic structure induced by some interaction or anisotropy not included in our model. Indeed, additional long-range order with wavevector or would hybridize the and modes at the zone edge with the modes at the zone center. In Raman spectroscopy, the anomalies of the 2.17 meV peak at 140 K and 200 K were identified with spin reorientations cazayous08 ; singh08 of the cycloid. However, any spin reorientation must respect the selection rules for the zone-center MR modes.
All of the active zone-center modes have been observed with Raman spectroscopy cazayous08 ; singh08 ; rovillain09 . The Raman peak rovillain09 at 23 cm-1 ( K) detected with parallel polarizations (exciting out-of-plane modes) can be identified with the modes and the 25.5 cm-1 peak detected with crossed polarizations (exciting in-plane modes) can be identified with the lower mode. Another Raman peak singh08 at 43.4 cm-1 ( K) lies quite near the estimated wavevector of the upper mode.
Because it is governed by different selection rules than THz spectroscopy, Raman spectroscopy has also observed several zone-edge cycloidal modes. That includes strong peaks at 34.5 cm-1 (4.28 meV, K) singh08 and 32 cm-1 (3.96 meV, K) rovillain09 , close to the predicted energy of the zone-edge modes. As conjectured above, additional long-range order may produce such zone-edge cycloidal peaks in the Raman spectrum.
Earlier estimates for and were based on low-energy inelastic neutron-scattering measurements taken at the wavevector matsuda12 . Because the inelastic-scattering cross section is quite broad, estimates based on those measurements are not as precise as the estimates described above based on spectroscopy measurements. By using the predicted frequencies of the modes to match the primary inelastic peaks at 1.1 and 2.5 meV, Matsuda et al. estimated that meV temp . However, peaks in the inelastic intensity may be slightly shifted away from those frequencies due to the finite resolution of the measurements.
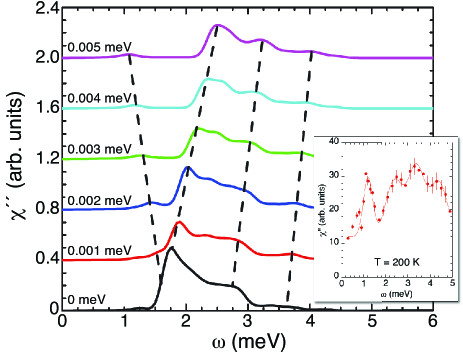
Averaged over a realistic resolution function and including the three sets of twins states with wavevectors along , , and , is plotted in Fig.4 for six values of from 0 to 0.005 meV. The inset provides the inelastic measurements at 200 K, which are almost temperature independent between 100 and 300 K. For , the lowest two peaks are near the points. Higher-energy peaks might be expected near the and zone-center modes and near the zone-edge modes. But due to the instrumental resolution, those peaks are smeared into broad features in .
The best qualitative agreement with the inelastic measurements is obtained using meV. Below 5 meV, the measured contains peaks at 1.2, 2.4, 3.4, and 4.4 meV. While four nearby peaks are predicted by our model, the lowest-energy peak is too weak and the two highest-energy peaks are slightly too low compared to the experimental results.
A value for between 0.002 and 0.004 meV is consistent with the prediction meV obtained from Monte-Carlo simulations of the phase diagram in a magnetic field ohoyama11 . As discussed above, anisotropy produces higher harmonics of the cycloid. Within the predicted range of , . Elastic neutron-scattering ramazanoglu11 and NMR measurements zalesskii02 indicate that is given by 500 and 25, respectively. Because more precise estimates are provided by THz spectroscopy, we believe that a value of closer to the lower limit of 0.002 meV and a value for close to 500 is likely.
We conclude that the upper three peaks measured by THz spectroscopy for BiFeO3 can be quantitatively predicted by a model that includes both DM and easy-axis anisotropy interactions. Our results for the MR components in Fig.3 can be used to check the selection rules governing those three peaks. A higher-energy EM peak at 5.39 meV is predicted with MR component . The low-energy 2.17 meV peak measured by THz and Raman spectroscopies may be produced by additional long-range order.
Research sponsored by the U.S. Department of Energy, Office of Basic Energy Sciences, Materials Sciences and Engineering Division (RF) and Scientific User Facilities Division (MM), by the Center for Integrated Nanotechnologies, a U.S. Department of Energy, Office of Basic Energy Sciences user facility at Los Alamos National Laboratory, operated by Los Alamos National Security, LLC for the National Nuclear Security Administration of the U.S. Department of Energy (JH), by Grants-in-Aid for Scientific Research from the Ministry of Education, Culture, and Technology, Japan (MEXT) (NF) and by the Max Planck Society (MPG), the Korea Ministry of Education, Science and Technology (MEST), Gyeongsangbuk-Do and Pohang City (SM).
References
- (1) D.I. Khomskii, Magn. Magn. Mater. 306, 1 (2006).
- (2) S.-W. Cheong, and M. Mostovoy, Nat. Mat. 6, 13 (2007).
- (3) I. Sosnowska, T. Peterlin-Neumaier, and E. Steichele, J. Phys. C: Solid State Phys. 15, 4835 (1982).
- (4) D. Lebeugle et al., Phys. Rev. Lett. 100, 227602 (2008).
- (5) S. Lee et al., Appl. Phys. Lett. 92, 192906 (2008).
- (6) J. Jeong et al., Phys. Rev. Lett. 108, 077202 (2012).
- (7) M. Matsuda et al., Phys. Rev. Lett. 109, 067205 (2012).
- (8) M. Ramazanoglu et al., Phys. Rev. B 83, 174434 (2011).
- (9) J. Herrero-Albillos et al., J. Phys.: Condens. Matter 22, 256001 (2010).
- (10) I. Sosnowska and R. Przenioslo, Phys. Rev. B 84, 144404 (2011).
- (11) D. Talbayev et al., Phys. Rev. B 83, 094403 (2011).
- (12) J.R. Teague, R. Gerson, and W.J. James, Solid State Commun. 8, 1073 (1970).
- (13) A.M. Kadomtseva et al., JTEP Lett. 79, 571 (2004).
- (14) S. Lee et al., Phys. Rev. B 78, 100101(R) (2008).
- (15) K. Ohoyama et al., J. Phys. Soc. Jpn. 80, 125001 (2011).
- (16) J. Park et al., J. Phys. Soc. Jpn. 80, 114714 (2011).
- (17) M. Tokunaga, M. Azuma, and Y. Shimakawa, J. Phys. Soc. Jpn. 79, 064713 (2010).
- (18) H. Katsura, N. Nagaosa, and A.V. Balatsky, Phys. Rev. Lett. 95, 057205 (2005).
- (19) M. Mostovoy, Phys. Rev. Lett. 96, 067601 (2006).
- (20) I.A. Sergienko and E. Dagotto, Phys. Rev. B 73, 094434 (2006).
- (21) I. Sosnowska and A.K. Zvezdin, J. Mag. Mag. Matter. 140-144, 167 (1995).
- (22) R.S. Fishman and S. Okamoto, Phys. Rev. B 81, 020402(R) (2010).
- (23) J.T. Haraldsen and R.S. Fishman, J. Phys.: Condens. Matter 21, 216001 (2009).
- (24) To account for the suppression of the observed moment at 200 K, Ref.matsuda12 took to be about 30% lower than its value with . Here we take and reduce the exchange interactions accordingly. So the estimates meV, meV, meV, and meV from Ref.matsuda12 are equivalent to meV, meV, meV, and meV in this paper.
- (25) R. de Sousa and J.E. Moore, Phys. Rev. B 77, 012406 (2008).
- (26) S. Miyahara and N. Furukawa, J. Phys. Soc. Jpn. 81, 023712 (2012).
- (27) In a crystal with , there are three possible orientations of . The selection rules indicate that either or is realized in Ref.talbayev11 since the upper mode would be inactive in field for a cycloid with .
- (28) M. Cazayous et al., Phys. Rev. Lett. 101, 037601 (2008).
- (29) M.K. Singh, R.S. Katiyar, and J.F. Scott, J. Phys.: Condens. Matter 20, 252203 (2008).
- (30) P. Rovillain et al., Phys. Rev. B 79, 180411(R) (2009).
- (31) A.V. Zalesskii et al., JTEP 71, 465 (2000); A.V. Zalesskii et al., JTEP 95, 101 (2002).