WISE J163940.83-684738.6: A Y dwarf identified by Methane Imaging**affiliation: This paper includes data gathered with the 6.5 meter Magellan Telescopes located at Las Campanas Observatory, Chile.
Abstract
We have used methane imaging techniques to identify the near-infrared counterpart of the bright WISE source WISE J163940.83-684738.6. The large proper motion of this source (3.0″ yr-1 ) has moved it, since its original WISE identification, very close to a much brighter background star – it currently lies within 1.5″ of the J=14.900.04 star 2MASS 16394085-6847446. Observations in good seeing conditions using methane sensitive filters in the near-infrared J-band with the FourStar instrument on the Magellan 6.5m Baade telescope, however, have enabled us to detect a near-infrared counterpart. We have defined a photometric system for use with the FourStar J2 and J3 filters, and this photometry indicates strong methane absorption, which unequivocally identifies it as the source of the WISE flux. Using these imaging observations we were then able to steer this object down the slit of the FIRE spectrograph on a night of 0.6″ seeing, and so obtain near-infrared spectroscopy confirming a Y0-Y0.5 spectral type. This is in line with the object’s near-infrared-to-WISE J3–W2 colour. Preliminary astrometry using both WISE and FourStar data indicates a distance of 5.00.5 pc and a substantial tangential velocity of 738 km s-1. WISE J163940.83-684738.6 is the brightest confirmed Y dwarf in the WISE W2 passband and its distance measurement places it amongst the lowest luminosity sources detected to date.
Subject headings:
Brown dwarfs: individual: WISE J163940.83-684738.6; Techniques: photometric; Methods: observational; Parallaxes1. Introduction
Data from the NASA Wide-field Infrared Survey Explorer (WISE; Wright et al., 2010) have delivered unprecedented advances in our understanding of the properties and space densities of the coldest compact astrophysical sources identified outside our Solar System – the Y-type brown dwarfs(Cushing et al., 2011; Kirkpatrick et al., 2012).
These very cold brown dwarfs have scientific impacts that span multiple astronomical arenas. In the field of star formation, they can deliver a historical record of the star formation process at very low masses and at epochs billions of years prior to the star forming regions we observe today. In the field of planetary atmospheric theory, they represent low-temperature atmospheres that can be readily observed without the contaminating glare of a host star, and without the photochemical complications introduced by host star irradiation. While in the field of exoplanet searches, they provide nearby, low-luminosity search targets potentially hosting planetary systems of their own.
WISE is readily able to identify these very cold brown dwarfs by their mid-infrared methane absorption bands. The shortest wavelength WISE band (hereafter W1) has a central wavelength of 3.4 m, which sits in the middle of the strong fundamental methane absorption band near 3.3 m. The second shortest WISE band (hereafter W2), has a central wavelength of 4.6 m, where the photosphere is reasonably transparent, so it detects flux from deeper, hotter layers in the brown dwarf. As a result, cold brown dwarfs can be identified via their very red W1–W2 colour. Thirteen Y dwarfs have been identified and spectroscopically confirmed to date by the WISE Brown Dwarf Science Team (Cushing et al., 2011; Kirkpatrick et al., 2012).
2. Observations of WISE J163940.83-684738.6
The WISE source WISE J163940.83-684738.6 (hereafter W1639) passes all the selection criteria for being a cold Y-type brown dwarf (see Kirkpatrick et al., 2012, for details), but the identification of a near-infrared counterpart to the WISE flux has proved difficult. With W2 and W1–W2 , W1639 would represent (if confirmed as a brown dwarf) the brightest Y dwarf in the WISE survey.
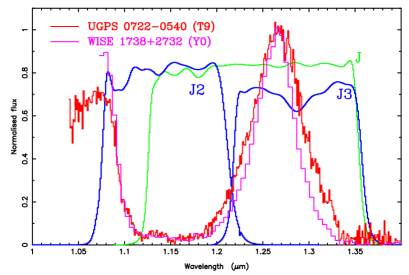
We have been carrying out observations of WISE sources since early 2012 using the FourStar infrared mosaic camera (Persson et al., 2008) mounted on the 6.5m Magellan Baade telescope at Las Campanas Observatory, Chile. This program has dual goals: to contribute to the complete identification of all WISE sources with W1–W22.0; and to carry out astrometric measurements of confirmed cold brown dwarfs. The first of these science goals is pursued using the near-infrared methane-sensitive J2 and J3 filters installed in FourStar. The J2 filter (see Fig. 1) is centred on a region in which methane absorption produces strong suppression in very cool brown dwarfs, while the J3 filter is centred on one of the few opacity holes (at 1.27 m) in cold brown dwarf photospheres. In this respect they represent J-band analogues of the H-band CH4s and CH4l filters used in the methane system of Tinney et al. (2005).
W1639 was observed on 2012 May 10-11 (UT)111All dates and times used in this paper are UT dates and times. with FourStar for approximately 4h, using 50 exposures of 120s in each filter and random telescope dithering. Each of FourStar’s four 20482048 pixel detectors sees a field 325″ on a side – in this analysis we deal only with data from a single detector (Chip2) in which all our targets were placed. Data processing was performed using a version of the ORACDR pipeline system (Cavanagh et al., 2008)222See also http://www.oracdr.org/ modified by us for use with FourStar. This creates and subtracts averaged dark frames, combines observations of a given target in each filter to create a flat-field, flattens all frames and then mosaics them to produce a final image. The results of each first-pass processing with ORACDR were used to identify frames with poor image quality and/or poor transmission, and these were then removed before a second-pass reprocessing. The final images for W1639 are created from the 29 best J3 images (totalling 58 min of exposure time and delivering 0.66 ″ images) and the 27 best J2 images (totalling 54 min and delivering 0.81 ″ images). The resulting images, centred on W1639’s WISE All Sky release position, are shown in Figure 2(a) and (b). No obvious source is visible with the very red J3–J2 colour expected for a cool brown dwarf. The bright source to the south of W1639’s position is the J=14.900.04 star 2MASS J163940.85-684744.6 (hereafter 2M1639).
These images were then photometered using the DAOPHOT II package (Stetson, 1987), as implemented within the Starlink environment (Draper et al., 2005)333See also http://starlink.jach.hawaii.edu/starlink. Unsaturated point-spread function (PSF) stars were selected within a 1’ radius of W1639, and used to create an initial model PSF. This was used to fit and subtract all identified stars within the image. In many cases this reveals the presence of companion stars within the haloes of PSF stars. Identifying these stars and including them in the PSF analysis on a second pass allowed us to iterate towards an “uncontaminated” PSF, which was then used to fit and subtract the bright star 2M1639. The resulting images “cleaned” of this bright star are shown in Figure 2(c) and (d), and demonstrate the existence of a near-infrared source previously hidden within the halo of 2M1639. Moreover this source is bright in J3 and faint in J2 – precisely the signature expected if the WISE W1639 flux is due to a cool brown dwarf.
(a) (b)
(b)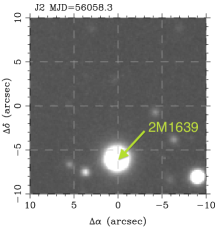
(c) (d)
(d)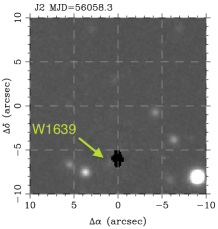
Subsequently, the same field was re-observed as an astrometric target in the J3 filter for around one hour in each of the nights 2012 July 10,11 and August 10. This data is discussed further in §5.
3. Photometry on the J3/J2 system.
We can use imaging data to ask what the J3–W2 colours for W1639 imply for this system. We have used SExtractor (Bertin & Arnouts, 1996) to obtain aperture photometry for stellar sources in both the “cleaned” W1639 images (obtained as described above), and for processed images of other late-T and Y dwarfs observed with FourStar as part of our WISE follow-up program on the nights of 2012 March 9, May 10 and July 10-11. These uncalibrated photometric catalogues were then position-matched against 2MASS catalogue data in these fields for both astrometric and photometric calibration.
| Object | Type | RefaaSpectral Type Sources are: 1 – Kirkpatrick et al. (2012); 2 – Mace et al. in prep.; 3 – Tinney et al. in prep,; 4 – Kirkpatrick et al. (2011); 5 – Cushing et al. (2011); 6 – this paper. | JMKObbJMKO values from Kirkpatrick et al. (2012) | Obs.Date | J3ccWhere multiple measures are available, the mean is reported along with the number of observations averaged. | J2 | J3-J2 | W2 | J3–W2 |
|---|---|---|---|---|---|---|---|---|---|
| WISEPC J014807.25-720258.7 | T9.5 | 1,5 | 18.96 0.07 | Jul 6 | 19.83 0.09 | 20.57 0.10 | 0.74 0.14 | 14.69 0.05 | 5.14 0.13 |
| WISE J053516.80-750024.9 | Y1: | 1 | Mar 9 | 21.98 0.13 | 15.06 0.07 | 6.92 0.15 | |||
| WISE J071322.55-291751.9 | Y0 | 1 | 19.64 0.15 | Mar 9 | 19.48 0.03 | 21.00 0.05 | 1.52 0.06 | 14.48 0.06 | 5.00 0.07 |
| WISE J073444.02-715744.0 | Y0 | 1 | 20.41 0.27 | Mar 9 | 20.06 0.04 | 15.36 0.06 | 4.70 0.07 | ||
| WISE J081117.81-805141.3 | T9.5 | 2 | Mar 9,May 10 | 19.32 0.03 (2) | 21.04 0.09 | 1.72 0.10 | 14.38 0.04 | 4.95 0.05 | |
| WISE J091408.96-345941.5 | T5 | 3 | May 10 | 17.73 0.02 | 19.03 0.02 | 1.30 0.03 | 15.03 0.09 | 2.70 0.09 | |
| WISEPC J104245.23-384238.3 | T8.5 | 4 | Mar 9,May 10,Jul 7 | 18.57 0.02 (3) | 14.52 0.06 | 4.05 0.06 | |||
| WISE J150115.92-400418.4 | T6 | 3 | May 10 | 15.95 0.01 | 17.01 0.01 | 1.06 0.02 | 14.21 0.05 | 1.74 0.05 | |
| WISEPA J154151.66-225025.2 | Y0.5 | 1,6 | 20.74 0.31 | May 10,Jul 7 | 20.96 0.05 (2) | 21.48 0.10ddJ2 photometry poor due to contaminating J2=18.6 star 1.3″ away. The real uncertainty will be much larger than the formal photon-counting uncertainty reported here. | 0.52 0.10ddJ2 photometry poor due to contaminating J2=18.6 star 1.3″ away. The real uncertainty will be much larger than the formal photon-counting uncertainty reported here. | 14.25 0.06 | 6.77 0.09 |
| WISE J163940.86-684744.6 | Y0: | 6 | May 10 | 20.62 0.08 | 22.27 0.10 | 1.65 0.12 | 13.64 0.05 | 6.98 0.09 | |
| WISE J210200.15-442919.5 | T9 | 3 | May 10,Jul 6,7 | 18.06 0.02 (3) | 19.38 0.09 | 14.12 0.05 | 3.93 0.06 | ||
| WISEPA J213456.73-713743.6 | T9p | 1 | Jul 6,Jul 7 | 19.38 0.09 | 13.99 0.05 | 5.39 0.06 | |||
| WISE J222055.31-362817.4 | Y0 | 1 | 20.38 0.17 | May 10 | 20.10 0.05 (2) | 21.75 0.20 | 1.65 0.2 | 14.66 0.06 | 5.45 0.09 |
With no pre-existing standards to define a J2/J3 photometric system, we are forced to define our own system (as we did in Tinney et al., 2005). Following that example, we base our system on Mauna Kea Observatories (MKO) J-band photometry – i.e. we adopt JMKO standards over a narrow colour range to define our magnitude zero-point for J3 and J2. We obtain JMKO photometry for stars in each field by converting 2MASS JHKs photometry to the MKO system, for stars in the colour ranges where the transformations in the Explanatory Supplement to the 2MASS All Sky Data Release and Extended Mission Products444http://www.ipac.caltech.edu/2mass/releases/allsky/doc/ are reliable (i.e. in the range (J–Ks)2M and (J–H)2M).
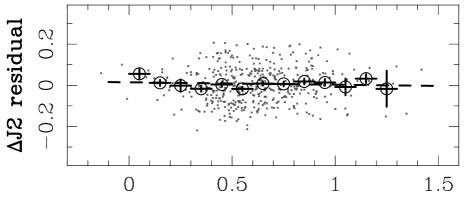
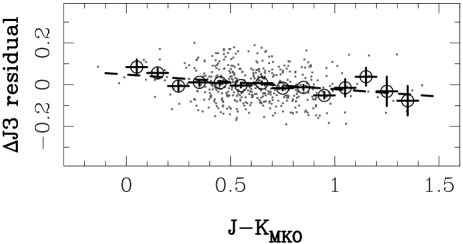
In Tinney et al. (2005) we used relatively hot A,F and G-type dwarf stars to define a CH4s and CH4l magnitude system in the H-band. Unfortunately, such stars (with colours in the range (J–K)MKO ) are rare in an arbitrary FourStar field. Instead we base our J2/J3 system on stars in the range (J–K)MKO , corresponding to the spectral type range G6-M3. Fortunately the colour terms involved in the calibration of this J2 and J3 photometry using JMKO are small. Figure 3 shows a plot of the residuals about this calibration, as a function of (J–K)MKO for more than 400 stars in nine FourStar Chip2 fields – the small dots show individual data points, and the large circles show the results of binning these points into 0.1 mag bins in colour, while the dashed line shows a linear fit. There is no evidence for systematic colour terms in the residuals for J2 over the range (J–K)MKO . The colour term present in J3 over this range is small (0.07 magmag) meaning that using stars with a mean J–K of 0.6, rather than 0.25, would at worst introduce a potential zero-point error of 0.025 mag. This is at a level similar to the standard-error-in-the-mean for the zero-points obtained in each field, and so neglecting the colour-term is acceptable.
The result is photometry on the natural system of these J2 and J3 filters, with a zero-point measured using JMKO photometry for stars with (J–K)MKO . This system has the significant advantage that it can deliver high quality differential J2/J3 photometry without the need for absolute photometric conditions. The FourStar field of view typically delivers between 5 and 100 2MASS stars suitable for calibrating each FourStar detector, and typical uncertainties on the determination of this zero-point are in the range 0.01-0.02 mag. Table 1 presents photometry on this system for both W1639 and a sample of comparison late-T and Y dwarfs observed with FourStar. Also listed are the relevant WISE All Sky release photometry and spectral classifications.
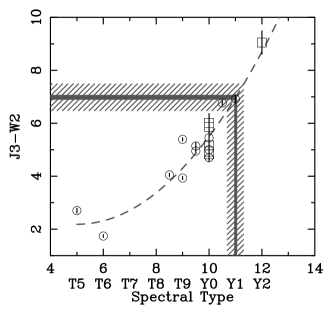
Figure 4 shows J3–W2 colours from Table 1 as a function of spectral type. The Y dwarfs in Table 1 with both JMKO and J3 photometry indicate a mean offset between these two systems of JMKOJ3=0.140.25 for Y dwarfs555Essentially all the Y dwarf flux in the J band emerges within the J3 bandpass (see Fig.1), so a simple correction is appropriate – at present most of the scatter in this zero-point is due to photon-counting uncertainties for these faint targets. Applying this correction to the published JMKO photometry for WISE J173835.53+273259.0, J140518.39+553421.3, J035934.06540154.6, J041022.71+150248.4, J182831.08+265037.7 and J205628.91+145953.2 in Kirkpatrick et al. (2012) allows us to add computed J3–W2 colours and spectral types for these objects (plotted with square symbols) to Fig. 4.
Much like the plots of JMKO–W2 presented in Kirkpatrick et al. (2011), it is clear that J3–W2 provides considerable leverage on the measurement of how cool a late-T or Y dwarf is – particularly when combined with a J3–J2 colour. The latter allows one to determine whether an object has significant methane absorption (i.e. is J3–J2 ), in which case J3–W2 can be relied on to be a monotonic estimator of how cool the brown dwarf is (or equivalently of its spectral type). In the case of W1639 (which has almost exactly the same J3–W2 as the Y1: brown dwarf WISE J053516.80+750024.9), this procedure produces an spectral type estimate of Y1 with an uncertainty of 0.3 sub-types (arising from the scatter about the calibration curve in Fig. 4 rather than the precision of the J3 photometry).
4. FIRE Spectroscopy
Spectroscopic observations of W1639 were carried out on 2012 July 10 (UT) using the Folded-port Infrared Echellette (FIRE; Simcoe et al., 2008, 2010) on the Magellan Baade Telescope. FIRE uses a 20482048 HAWAII-2RG array and in prism mode delivers a wavelength range from 0.8 to 2.5m at a resolution of 500 in the J band (when used with a 0.6″ slit).
Our FourStar astrometric observations on the night of 2012 July 10 were processed on-the-fly using ORACDR, to obtain a precise position angle and separation at this epoch between the bright source 2M1639 and the faint source W1639. FIRE was rotated to this position angle, and 2M1639 positioned on the slit, ensuring that W1639 would also be acquired down the slit. Six 600s exposures were obtained nodding the slit by 10″ in an ABBA pattern.
These spectra were then processed in a standard fashion, using arc lines to remove FIRE’s optical curvature and traces of the bright star 2M1639 to remove a slight tilt of the spectra with respect to the detector rows. Images were pair subtracted and combined to produce a pair of A-B and B-A images, and these then had any residual sky extracted and subtracted.
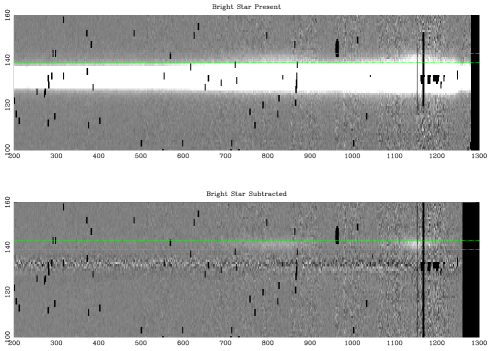
The resulting images are dominated by flux from the bright source 2M1639, together with much fainter emission from W1639 (which is offset by +9.2 pixels in the FIRE data). The expected spectrum of a very-late-T or Y dwarf can be seen nonetheless in this data (see Fig. 5 - upper panel). To remove the contaminating flux due to the bright companion, we implemented a “spectral PSF” subtraction using custom scripts in the Perl Data Language666http://pdl.perl.org. We extracted spatial profiles from the spectra by averaging every 100 pixels in the spectral direction, and fitting a model PSF to the resulting spatial profile – after much experimentation we settled on a Gaussian model for the core of the spectral PSF, a Moffat function for its wings, and we also allowed for a “companion” Gaussian (with the same width as the core) at the spatial separation known between W1639 and 2M1639, but with an amplitude allowed to float as a free parameter. We found that even this model, however, left systematic residuals when subtracted, and so we followed the lead of DAOPHOT (Stetson, 1987) and allowed for an empirical look-up table of residuals as a fraction of the total peak height of the spectral PSF. The free parameters for the spectral PSF were then fitted with quadratic polynomials to generate a model PSF that varied smoothly with wavelength. This PSF (minus the “companion” terms that modelled W1639) was then generated, normalised to each column of the image, and subtracted to create a “cleaned” spectral image (see Fig. 5 - lower panel). Spectra were then extracted from this image, wavelength calibrated and averaged over the A-B and B-A beams to produce a final extracted spectrum (see Fig. 6).
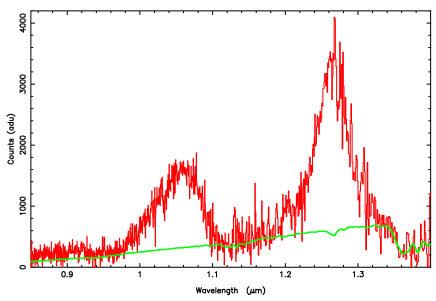
Despite the considerable care with which we removed the 5 magnitudes brighter spectrum of 2M1639, Fig. 6 indicates that there is nonetheless some contaminating 2M1639 flux still present in the extracted spectrum. This is demonstrated by the flux seen in the extracted spectrum at 1.36-1.4m – very cool brown dwarfs emit essentially zero flux at these wavelengths, and they certainly don’t show sharp atmospheric absorption at 1.36m. The spectrum of 2M1639 does, however, show such a feature and a scaled version of that spectrum (shown in the figure) is an excellent match to the “baseline” flux present in the extracted spectrum. We are therefore confident that removing the scaled 2M1639 spectrum, as shown, is required to generate a decontaminated spectrum of W1639. This decontaminated spectrum was then binned by a factor of 3 (to match spectral pixels to the FIRE resolution in this wavelength range) and a telluric star correction applied to remove atmospheric absorption as well as place our spectra on an Fλ scale. The final spectrum is shown in Figure 7.
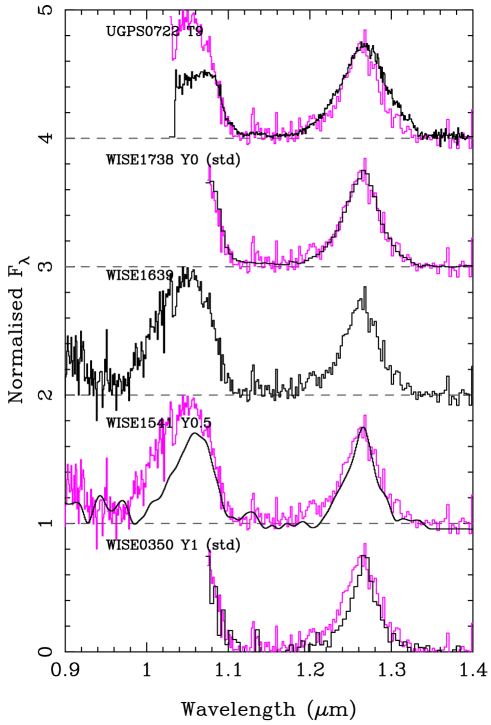
We then follow the procedure outlined in Kirkpatrick et al. (2012), and rank the relative lateness of W1639 against other Y dwarfs using a comparison of spectra scaled by the flux peak in the J-band. W1639 is clearly seen to have a J-band peak narrower than that of the T9 prototype UGPS 0722, and itself has a J-band peak significantly broader than that of the Y1 prototype WISE 0350. It matches best the Y0 prototype, but given the quality of the spectra we have obtained for this difficult-to-observe object, it could lie anywhere in the range Y0-Y0.5.
It is tempting to associate the features seen near 1.03 m in this spectrum with the NH3 features near 1.03 m predicted by the models of Saumon et al. (2012, see their Figure 7). To examine this we plot in Fig. 8 the W1639 spectrum near this wavelength before rebinning, along with the 500K BYTe NH3 model in Saumon et al.’s Fig. 7. The alignment of the predicted NH3 “doublet” feature near 1.02 and 1.035m is tantalising, but due to the noise added to the spectral extraction by the contaminating flux of the bright companion, we are unable to claim this as a robust NH3 detection from this data alone.

5. Astrometry
W1639 has now been observed at four epochs with Magellan on three observing runs. It was also observed at two epochs by WISE. Given its very large proper motion, and the fact a Y spectral type and J3=20.620.08 would suggest a likely distance of less than 10 pc, an astrometric analysis is warranted.


FourStar : Our J3-passband, ORACDR-processed images were analysed using DAOPHOT to obtain precision differential astrometry in a manner identical to that used by us in previous astrometric papers (Tinney et al., 2003; Tinney, 1996). We use local 2MASS sources within the FourStar field to determine the plate scale (0.15920.0001″/pix) and the orientation to the cardinal directions of a single frame, which is selected for use as an astrometric master.
WISE : W1639 was observed twice by WISE – once as part of the WISE All Sky release and once again as part of the WISE 3 Band Cryo extended mission. We have extracted data from both these catalogs in a 600″ region around W1639 using the IRSA gateway777http://irsa.ipac.caltech.edu. The reported photometry and astrometry for W1639 in the All Sky release arises from 11 epochs spread over a period of less than 2 days centred on 2010 Mar 11 (UT), while that in the WISE 3 Band Cryo release arises from 18 epochs centred on 2010 Sep 7 (UT). Because these data spans are short, we treat each observation as a single epoch obtained at the mean MJD of the observations that make up each catalog entry (as obtained from the relevant Single Exposure Source Tables). The result is a set of co-ordinates on the system defined by the 2MASS Point Source Catalog (Skrutskie et al., 2006). To enable a differential comparison with our FourStar images, these co-ordinates were tangent-projected about the WISE All Sky release position of W1639, scaled by the FourStar plate scale, and offset to place W1639 at the approximate location where it is actually observed in our FourStar images.
5.1. Results
The result is a set of observations in a FourStar pixel system, which we then subjected to standard differential astrometric processing (Tinney et al., 2003; Tinney, 1996). A set of 20 reference stars was chosen to surround W1639 in the field-of-view. We required all 20 stars to be present in both WISE epochs and all FourStar epochs. The FourStar observations transfer on to the FourStar master frame with typical root-mean-square (rms) residuals of 3-5 mas. These astrometric precisions are for the reference stars, which in the FourStar data are typically much brighter than W1639 itself. Tests with background stars of similar magnitude to W1639 indicate that the FourStar astrometric precision for W1639 itself is 8-10 mas, and these are the precisions that have been adopted in our astrometric solution.
In contrast, the WISE data have residuals with an rms of 100 mas. This is hardly surprising – WISE is a small telescope with 6″ resolution, so 0.1″ astrometric precision for this reference frame is itself remarkable. W1639 is quite bright in the WISE data, and the precision achieved for the reference stars is representative of that expected for W1639 itself. The 2 year time baseline delivered by WISE means that it provides critical astrometric information, in spite of this lower precision. The Magellan data constrain on the parallax motion, while the WISE data constrain the proper motion.
The resulting astrometric solution is shown in Fig. 9. With only five independent epochs, and with two separate instruments coming into play, we consider this astrometry to be preliminary. In particular, the formal uncertainties do not reflect potential systematic differences between the two instrument’s co-ordinate systems. Nonetheless, we see that W1639 has a very large proper motion (306940 mas yr-1 at a PA=169.10.4) which places it in the top 30 fastest moving stars in the Solar Neighbourhood. The formal parallax solution is 20012 mas. With only five epochs in hand, this formal uncertainty will be an underestimate and the real uncertainty will be larger – we recommend considering this preliminary parallax good to 20 mas until a FourStar-only parallax can be produced within the next 12 months. Parallactic motion has, nonetheless, been detected with high significance, and we expect this solution to rapidly improve over the next 12 months.
6. Discussion
W1639 has a measured distance of 5.00.5 pc. This places it comfortably inside the 8pc Nearby Star Sample and makes it about the 55th closest stellar system to the Sun (Kirkpatrick et al., 2012). The measured distance to W1639 implies an absolute magnitude in the J passband (using the correction from J3 to J adopted earlier) of M. Figure 10 places this result in context with other late-T and Y dwarfs with measured parallaxes (spectral types are plotted as sub-type+10 for Y dwarfs, and sub-type+0 for T dwarfs. These data suggest that W1639 has an absolute magnitude in the J passband at the lower end of that observed for Y0 brown dwarfs (and just slightly fainter than that for the Y0 brown dwarf WISEPC J140518.40+553421.5), but significantly brighter than the Y1 brown dwarf WISE J053516.80750024.9 (Kirkpatrick et al., 2012). This is in line with the spectra presented earlier, which suggest a Y0-Y0.5 spectral type.

Combining the distance and proper motion, W1639 has a significant tangential velocity (Vtan) of 738 km s-1, and is among the fastest moving normal (i.e. non-subdwarf or non-low-surface-gravity) cool brown dwarfs yet observed (Faherty et al., 2009; Kirkpatrick et al., 2011; Faherty et al., 2012). Faherty et al. (2012) derived the median Vtan and values for the closely related T dwarf population to be 31 km s-1 and 20 km s-1 (respectively), suggesting that W1639 is kinematically deviant from brown dwarfs with ages typical of the field population (3-5 Gyr). While individual velocities can not be used as an age indicator, general information can be obtained by comparing to the population of similar temperature objects. Faherty et al. (2009) found that the members of the population of high-Vtan, low-temperature brown dwarfs show a correlation with being blue photometric outliers (and hence having either low-metallicity, high surface gravity, thin photospheric clouds, or a combination thereof), and can be regarded as being kinematically older than the field population. Using the measured distance, proper motion, and galactic coordinates (), we have estimated likely values for the full space motion for W1639 (assuming a radial velocity in a range similar to the Vtan observed: 73, 0 and 73 mms) and find a range of UVW velocities which consistently place W1639 outside the “Eggen box” for young disk stars ( 2 Gyr), indicating that this source is likely older than the field population (Eggen & Iben, 1989).
While there are a limited number of Y dwarfs with distance measurements for comparison (Marsh et al. submitted, Beichman et al. submitted), Kirkpatrick et al. (2012)report Vtan values for a portion of newly discovered WISE brown dwarfs using photometric distance estimates for all sources. Two Y dwarfs, WISE 0410+1502 (Y0) and WISE 1405+5534 (Y0pec) also have significant tangential velocities (V km s-1) . We note that this might be an indication that photometric distances are overestimated for these new sources. More Y dwarfs with distance measurements are needed to investigate whether the kinematics of the new low temperature class of objects differs from that of the warmer brown dwarfs.
7. Conclusion
We have detected the near-infrared counterpart to the WISE mid-infrared source WISE J163940.83684738.6. Spectroscopy indicates a spectral type of Y0-Y0.5, and this is consistent with the near-infrared-to-WISE J3–W2 colour of W1639 which suggests it to be of type Y1. W1639 is a bright, nearby Y dwarf – it is the brightest Y dwarf in the W2 passband in the WISE survey. It is likely to be a “hot button” target for future studies of the coolest brown dwarfs as its large proper motion moves it quickly away from the contaminating field star 2MASS J163940.83-684738.6 over the next 12 months.
These observations have shown, once again, that methane filters have significant utility in the follow-up of large surveys for cool brown dwarfs – the use of imaging permits the sort of differential analysis that can identify Y dwarfs even when they lie quite close to bright background stars, while the unique methane signature provides an unambiguous means of identifying very cool photospheres. Moreover, we have shown that methane filters placed in the near-infrared J band (as installed in FourStar) can be very powerful for observations of the coolest brown dwarfs. At very cold temperatures, the J-band methane signature is significant (J2–J3 ), and allows observers to take advantage of the much fainter sky in the J-band – especially compared to that seen by more traditional H-band methane filters (Tinney et al., 2005).
8. Acknowledgments
CGT gratefully acknowledges the support of ARC Australian Professorial Fellowship grant DP0774000. Australian access to the Magellan Telescopes was supported through the National Collaborative Research Infrastructure Strategy of the Australian Federal Government. Travel support for Magellan observing was provided by the Australian Astronomical Observatory.
This publication makes use of data products from the Wide-field Infrared Survey Explorer, which is a joint project of the University of California, Los Angeles, and the Jet Propulsion Laboratory/California Institute of Technology, funded by the National Aeronautics and Space Administration. This publication also makes use of data products from 2MASS, which is a joint project of the University of Massachusetts and the Infrared Processing and Analysis Center/California Institute of Technology, funded by the National Aeronautics and Space Administration and the National Science Foundation. This research has made extensive use of the NASA/IPAC Infrared Science Archive (IRSA), which is operated by the Jet Propulsion Laboratory, California Institute of Technology, under contract with the National Aeronautics and Space Administration.
And finally, this research has benefitted from the M, L, and T dwarf compendium housed at DwarfArchives.org, whose server was funded by a NASA Small Research Grant, administered by the American Astronomical Society. We gratefully acknowledge the assistance of Phil Lucas and Ben Burningham who provided a digital copy of their UGPS 0722 spectrum.
Facilities: Magellan:Baade (FourStar, FIRE), WISE
References
- Bertin & Arnouts (1996) Bertin, E. & Arnouts, S., A&AS, 117, 393
- Cavanagh et al. (2008) Cavanagh, B., Jenness, T., Economou, F. & Currie, M. J., AN, 329, 295
- Cushing et al. (2011) Cushing, M. C., Kirkpatrick, J. D., Gelino, C. R., et al. 2011, ApJ, 743, 50
- Draper et al. (2005) Draper, P.W., Allan, A., Berry, D.S., et al. 2005, in P. Shopbell, M. Britton, R. Ebert (eds.), Astronomical Data Analysis Software and Systems XIV, ASPC 347, p. 22
- Eggen & Iben (1989) Eggen, O. J., & Iben, I., Jr. 1989, AJ, 97, 431
- Faherty et al. (2012) Faherty, J. K., Burgasser, A. J., Walter, F. M., et al. 2012, ApJ, 752, 56
- Faherty et al. (2009) Faherty, J. K., Burgasser, A. J., Cruz, K. L., et al. 2009, AJ, 137, 1
- Kirkpatrick et al. (2011) Kirkpatrick, J. D., Cushing, M. C., Gelino, C. R., et al. 2011, ApJS, 197, 19
- Kirkpatrick et al. (2012) Kirkpatrick, J. D., Gelino, C. R., Cushing, M. C., , et al. 2012, ApJ, 753, 156
- Lucas et al. (2010) Lucas, P. W., Tinney, C. G., Burningham, B., et al. 2010, MNRAS, 408, L56
- Persson et al. (2008) Persson, S. E., Barkhouser, R., Birk, C., et al. 2008, Proc. SPIE, 7014, 95
- Saumon et al. (2012) Saumon, D., et al. 2012, ApJ, 750, 74
- Simcoe et al. (2010) Simcoe, R. A., et al. 2010, Proc. SPIE, 7735,
- Simcoe et al. (2008) Simcoe, R. A., et al. 2008, Proc. SPIE, 7014,
- Skrutskie et al. (2006) Skrutskie, M. F., Cutri, R. M., Stiening, R., et al. 2006, AJ, 131, 1163
- Stetson (1987) Stetson, P.B., 1987, PASP, 99, 191
- Tinney (1996) Tinney, C. G. 1996, MNRAS, 281, 644
- Tinney et al. (2003) Tinney, C. G., Burgasser, A. J., & Kirkpatrick, J. D. 2003, AJ, 126, 975
- Tinney et al. (2005) Tinney, C. G., Burgasser, A. J., Kirkpatrick, J. D., & McElwain, M. W. 2005, AJ, 130, 2326
- Westphal (1969) Westphal, J. A. 1969, ApJ, 157, L63
- Wright et al. (2010) Wright, E. L., et al. 2010, AJ, 140, 1868