A photospheric metal line profile analysis of hot DA white dwarfs with circumstellar material
Abstract
Some hot DA white dwarfs have circumstellar high ion absorption features in their spectra, in addition to those originating in the photosphere. In many cases, the line profiles of these absorbing components are unresolved. Given the importance of the atmospheric composition of white dwarfs to studies of stellar evolution, extra-solar planetary systems and the interstellar medium, we examine the effect of including circumstellar line profiles in the abundance estimates of photospheric metals in six DA stars. The photospheric C and Si abundances are reduced in five cases where the circumstellar contamination is strong, though the relative weakness of the circumstellar Si iv absorption introduces minimal contamination, resulting in a small change in abundance. The inability of previous, approximate models to reproduce the photospheric line profiles here demonstrates the need for a technique that accounts for the physical line profiles of both the circumstellar and photospheric lines when modelling these blended absorption features.
keywords:
stars: abundances - atmospheres - circumstellar matter - white dwarfs - ultraviolet: ISM - stars1 Introduction
White dwarfs are the evolutionary end products of most stars. As such, a detailed knowledge of these objects is crucial to comprehend the end states of stellar evolution and planetary systems. Accurate Teff and log g measurements for white dwarfs are necessary for a proper understanding of these bodies. Using evolutionary models (e.g. Fontaine et al. 2001), these stellar parameters can be used to derive a mass, which can then be used in studies of white dwarf mass distributions (e.g. Bergeron et al. 1992; Liebert et al. 2005), initial-final mass relations (e.g. Casewell et al. 2009; Dobbie et al. 2009) or luminosity functions (e.g. Liebert et al. 2005). Given that white dwarfs represent some of the oldest stellar objects, their ages can be used to date stellar populations, or the Galactic disc (e.g. Fontaine et al. 2001). This makes reliable measurements of stellar parameters such as Teff and log g (found by fitting the Balmer/Lyman series in DA white dwarfs; e.g. Holberg et al. 1985; Bergeron et al. 1992), and thus a robust understanding of the white dwarf atmospheres in which the absorption series arise, critical.
Over the previous few decades of white dwarf research, evidence for the presence of metals in the photospheres of hot DA stars has abounded (e.g. Barstow et al. 1993, 2003b; Marsh et al. 1997), where radiative levitation is sufficient to counter the downward diffusion of the heavy ions (e.g. Chayer et al. 1994; Chayer, Fontaine & Wesemael 1995; Chayer et al. 1995). Proper inclusion of these metals significantly affects the predicted Balmer/Lyman line profiles, influencing the measured white dwarf Teff and log g; the measured Teff for DAs hotter than 55 000 K (where radiative levitation is the dominant process governing metallic composition, and metal line blanketing affects Teff measurements; e.g. Dreizler & Werner 1993) using a metallic, non-local thermodynamic equilibrium (NLTE) analysis reduces the measured Teff by 4 000 to 7 000 K when compared to a pure hydrogen, local thermodynamic equilibrium (LTE) analysis (Barstow et al. 1998). Furthermore, for objects with T 50 000 K, the Teff values measured using Balmer and Lyman lines are inconsistent for a given object by up to 10 000 K (Barstow et al. 2001, 2003a). This is also observed at DAO stars (Good et al. 2004), with more severity (with Teff values above 55 000 K differing by up to 60 000 K in some cases). Thus, properly accounting for the metals in hot white dwarfs is crucial to a proper understanding of the Teff and log g of a given star.
However, the inclusion of metals in hot white dwarf models at the correct abundance is not trivial. Using homogeneous models of white dwarf photospheres, Barstow et al. (2003b) found some significant deviations between the measured abundances and those predicted by radiative levitation for the stars in their sample, though the predicted abundance-Teff/log g patterns are reproduced in that hotter stars have higher metal abundances. Indeed, some stars with similar Teff and log g values have somewhat different metal abundances. In addition to homogeneously distributed models, self-consistent stratified models, where the metal abundances present are those resulting from diffusive equilibrium, have been used to model hot DA stars (Dreizler 1999; Dreizler & Wolff 1999; Schuh et al. 2002). Comparisons of the abundances measured using the stratified models of Schuh et al. (2002) to the homogeneous models of Barstow et al. (2003b) show that, although abundance measurements are roughly consistent with each other across the sample (when systematic errors are accounted for), measurements do not match up on an object by object basis (Schuh, Barstow & Dreizler 2005). Models with highly abundant metals present in only the upper atmospheric regions have been used to explain the profiles of the N v (Holberg et al. 1995, 1999, 2000; Barstow et al. 2003b) and O vi (Chayer et al., 2006) absorption lines in some stars, while other studies find homogeneous metal distributions with abundances in keeping with those of DAs with higher Teff represent the observations well (Chayer et al., 2005; Dickinson et al., 2012a). Models with stratified Fe have also been used to explain observations of WD 0501+527 (G191-B2B; Barstow, Hubeny & Holberg 1999; Dreizler 1999; Dreizler & Wolff 1999). Furthermore, absorption from elements such as Ge, Sn, Pb (Vennes et al., 2005) and Ar (Werner, Rauch & Kruk 2007) has been detected in DA stars.
At cooler white dwarfs, where metallic ions should sink out of the stellar atmospheres on short timescales (e.g. Koester & Wilken 2006), photospheric metals, where observed, are attributed to the accretion of tidally disrupted minor planets or asteroids (e.g. Zuckerman et al. 2007, 2011; Dufour et al. 2010; Klein et al. 2011), since white dwarf kinematics and abundances do not favour ISM accretion (Aannestad et al. 1990; Zuckerman & Reid 1998; Zuckerman et al. 2003; Farihi et al. 2010) and the C, Si and Al abundances observed in the sample studied by Dupuis et al. (2010) require measurable accretion in addition to the recently calculated radiative levitation effects (Chayer & Dupuis 2010). Circumstellar discs with dust and gas components have been seen around some hot DAs (Gänsicke et al. 2006, 2007; Gänsicke et al. 2008; Brinkworth et al. 2009; Melis et al. 2011; Debes et al. 2012), with the gaseous components being due to the sublimation of dust grains by the intense radiation from the hot stars. The anomalously high metal abundances seen in some hot DA stars (e.g. WD 2111+498/GD 394; Holberg et al. 1997; Chayer et al. 2000; Dupuis et al. 2000; Vennes et al. 2006) may be similarly linked to the accretion of circumstellar material, most likely in the form of a gas disc, due to the sublimation of dust expected near white dwarfs with higher Teff values. However, searches for such material around hot DAs with anomalous metal abundances have not yet yielded any definitive detections of either gas disc emission or infrared excesses (e.g. Burleigh et al. 2010, 2011, in preparation). A proper understanding of the hot DAs with anomalous metal abundances is crucial to our understanding of which hot stars may be accreting, and will therefore impact significantly on our understanding of the fate of planetary systems at the evolutionary end point of their host stars.
Further complications arise in our understanding of metal absorption in these objects, when non-photospheric high ion absorption features are present in DA spectra. Such absorption features were first detected nearly 20 years ago in the IUE spectrum of WD 1620391 (CD 38o10980), at velocities far from the the photospheric and interstellar medium (ISM) lines, leading to the interpretation that they were ‘circumstellar’ (Holberg et al. 1995). Later studies have found such circumstellar features in other white dwarf spectra (Holberg et al. 1997; Holberg et al. 1998; Bannister et al. 2003; Lallement et al. 2011). Originally thought to be related to stellar mass loss (Holberg et al. 1998, 1999; Bannister et al. 2003), vaporised planetesimals (Lallement et al. 2011) or the ionisation of either the ISM or ancient, diffuse remnants of planetary nebulae (PNe) (Bannister et al. 2003; Dickinson et al. 2012b) have been proposed as alternative origins for the observed features, since mass loss is no longer thought to occur at these hot DAs (Dickinson et al. 2012b; Unglaub 2007, 2008). Indeed, the ionisation of the ISM inside hot white dwarf Strömgren spheres may account for some of the observed ionisation structure of the LISM (e.g. Welsh et al. 2010, Welsh et al. in preparation). Furthermore, non-photospheric Si iv absorption has been identified in Hubble Space Telescope (HST) Cosmic Origins Spectrograph (COS) observations of WD 0843+516 (PG 0843+516) and SDSS 1228+1040 (given the strong Si iv detections and lack of C iv at these objects, these features are attributed to absorption in the circumstellar discs about the stars, and are not thought to be from the same type of absorber as those seen at the hotter DAs; Gänsicke et al. 2012).
In some cases, these circumstellar features have velocities close to those of the photospheric absorption lines, leading to blended absorption line profiles. Some studies (e.g. Barstow et al. 2003b) that estimated the metal abundances of stars where such blended absorption lines are present neglected the circumstellar components of the absorption features, since the potential for the circumstellar components to act as contaminants to photospheric abundance measurements was not then know. However, Dickinson et al. (2012b) found that the circumstellar components to the 1548 Å and 1550 Å C iv features in the spectrum of WD 0501+527 account for a significant proportion of the absorption line profiles, having equivalent widths of 128.77 mÅ and 106.47 mÅ respectively, while the total equivalent widths of the features are 160.01 mÅ and 141.93 mÅ demonstrating the sizeable effect the circumstellar absorption may have on photospheric abundance estimates.
The recent study of DA circumstellar absorption by Dickinson et al. (2012b) has allowed, for the first time, full characterisation of the circumstellar absorbing components (using the technique described in studies such as Welsh & Lallement 2005, 2010). By taking proper account of these non-photospheric absorption profiles in blended high ion features, more robust photospheric metal abundances can be derived. Given the great importance and wide ranging applications a thorough understanding of white dwarf metal content has, we present here an analysis of the photospheric components of such blended absorption features, with the aim of better understanding how the stellar absorption features contribute to the blended absorption line profiles, and to see how the inclusion of the previously characterised circumstellar components affects the derived DA metal abundances.
2 Observations and Method
| WD | Alt.name | Teff | log g | Data source [Mode] | Resolving Power (, FWHM) |
|---|---|---|---|---|---|
| 0232+035∗ | Feige 24 | 61 0001 100 | 7.500.06 | STIS [E140M] | 40 000 |
| 0501+527 | G191-B2B | 53 500900 | 7.530.09 | STIS [E140H] | 110 000 |
| 0556375 | REJ 0558373 | 60 0002 200 | 7.700.09 | STIS [E140M] | 40 000 |
| 0939+262 | Ton 021 | 69 700530 | 7.470.05 | STIS [E140M] | 40 000 |
| 1611084 | REJ 1614085 | 38 800480 | 7.920.07 | GHRS [G160M] | 22 000 |
| 2218+706 | 58 6003 600 | 7.050.12 | STIS [E140M] | 40 000 |
∗the blending of components occurs only at the 0.24 binary phase. Note: though the Teff and log g values here are taken from Barstow et al. (2003b), they have been adjusted to reflect the significance of the stated error.
Of the 23 stars in the sample analysed by Bannister et al. (2003) and Dickinson et al. (2012b), eight yield unambiguous circumstellar detections. At only two of these objects (WD 0455282 and WD 1738+665) are the circumstellar features completely resolved from their photospheric counterparts, while at WD 0232+035 the components are resolved at one of the binary phases (0.74). Table 1 lists the objects at which the circumstellar and photospheric components are blended, and gives the stellar parameters of the objects (from Barstow et al. 2003b). We used data from the Barstow et al. (2003b) study111available from the MAST archive (http://archive.stsci.edu), with observation information for each DA in table 1.
| C iv | |||||||||
|---|---|---|---|---|---|---|---|---|---|
| WD | (Å) | (km s-1) | b (km s-1) | N (x10) | (x10-3 keV) | (x10-7 keV) | (x10-7) | (km s-1) | |
| 0232+035a | 1548.187 | 0.19 | 7.3 | 6.2 | 27.6 | 8.008 | 1.171 | 5.746 | 125.7 |
| 1550.777 | 0.0952 | 7.1 | 6.5 | 29.0 | 7.995 | 1.226 | 3.027 | 128.9 | |
| 0232+035b | 1548.187 | 0.19 | 7.9 | 7.1 | 29.4 | 8.008 | 1.341 | 6.132 | 29.7 |
| 1550.777 | 0.0952 | 7.1 | 5.8 | 26.8 | 7.995 | 1.094 | 2.803 | 28.7 | |
| 0501+527 | 1548.187 | 0.19 | 8.0 | 5.9 | 107.0 | 8.008 | 1.114 | 22.221 | 26.7 |
| 1550.777 | 0.0952 | 9.8 | 5.4 | 101.0 | 7.995 | 1.018 | 10.534 | 27.0 | |
| 0556375 | 1548.187 | 0.19 | 9.1 | 11.0 | 39.2 | 8.008 | 2.078 | 8.174 | 32.3 |
| 1550.777 | 0.0952 | 11.0 | 1.5 | 54.4 | 7.995 | 2.168 | 5.131 | 31.5 | |
| 0939+262 | 1548.187 | 0.19 | 10.0 | 8.3 | 7.53 | 8.008 | 1.568 | 1.571 | 35.2 |
| 1550.777 | 0.0952 | 7.9 | 8.3 | 8.57 | 7.995 | 1.565 | 0.895 | 34.2 | |
| 1611084 | 1548.187 | 0.19 | 17.7 | 3.7 | 6.57 | 8.008 | 0.699 | 1.371 | 37.4 |
| 1550.777 | 0.0952 | 58.2 | 3.7 | 2.3 | 7.997 | 0.698 | 2.399 | 34.6 | |
| 2218+706 | 1548.187 | 0.19 | 17.4 | 5.0 | 118 | 8.008 | 0.945 | 24.702 | 40.5 |
| 1550.777 | 0.0952 | 18.1 | 8.5 | 120 | 7.995 | 1.603 | 12.498 | 42.5 | |
| Si iv | |||||||||
| 0939+262 | 1393.755 | 0.513 | 6.2 | 9.6 | 1.34 | 8.955 | 2.401 | 0.753 | 36.4 |
| 1402.770 | 0.225 | 18.4 | 13.7 | 2.28 | 8.838 | 2.856 | 0.639 | 38.0 | |
| 1611084 | 1393.755 | 0.513 | 22.8 | 2.4 | 1.30 | 8.896 | 2.560 | 0.731 | 47.9 |
| 2218+706 | 1393.755 | 0.513 | 18.5 | 9.2 | 7.34 | 8.896 | 1.930 | 4.133 | 40.7 |
| 1402.770 | 0.225 | 17.2 | 12.9 | 8.36 | 8.839 | 2.856 | 2.415 | 40.4 | |
†from the NIST Atomic Spectra Database, aresolved spectrum (0.74 binary phase), bblended spectrum (0.24 binary phase). Note: no errors presented, since , and were allowed to vary freely, not within a hard range.
The method used to fit the spectra is a variation of the method used in previous work (e.g. Barstow et al. 2003b; Dickinson et al. 2012a), so a summary is presented here with an explanation of how we accounted for the circumstellar components. xspec (Arnaud 1996) was utilised to perform the spectrum fitting. The Teff and log g values from table 1 were used in the fits, with the parameters allowed to vary within the stated error range. The circumstellar components of the absorption lines were accounted for using the xspec Gaussian absorption line model ‘gabs’. The circumstellar line properties (circumstellar line velocity, ; b value; column density, N) measured by Dickinson et al. (2012b) were converted to the quantities used as input parameters to gabs (line energy in keV, ; Gaussian sigma in keV, ; line depth, ) using equations 1-3, and used as starting values for the Gaussian components (table 2).
| (1) |
| (2) |
| (3) |
where is the laboratory wavelength of the absorption line, is the speed of light, is Planck’s constant and is the optical depth at the line centre, calculated using the formalism of Spitzer (1978) (equation 4).
| (4) |
where and are the charge and mass of an electron and is the oscillator strength.
The parameters of the Gaussian absorption lines were allowed to vary freely, since the fitting method here differs from that used by Dickinson et al. (2012b), and thus the errors associated with , b and N were not considered in the calculation of , and , and are therefore not presented in table 2. The two spectra of WD 0232+035 were fitted separately, not summed in the white dwarf rest frame as in previous work (e.g. Barstow et al. 2003b; Vennes & Lanz 2001), to allow a consistency check of the abundances derived with and without the circumstellar component contaminating the C iv line profiles.
The photospheric absorption components were modelled using the NLTE stellar atmosphere code tlusty (Hubeny & Lanz 1995). The wavelength regions used to fit the spectra are the same as those used by Barstow et al. (2003b), namely 1545 to 1555 Å for the C iv doublet and 1390 to 1405 Å for the Si iv doublet. The absorption lines from any element other than that considered in each spectral region were excluded to avoid the coupling of the abundances of multiple elements. These ‘background’ elements were included at the abundances stated in Barstow et al. (2003b). The line centres of the photospheric components were initially placed at the photospheric velocities (, table 2) found by Dickinson et al. (2012b), and allowed to fit freely. 1 errors were computed for all abundance measurements.
3 Results
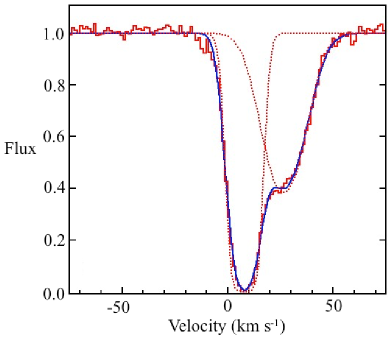
Table 3 details the new abundances found in this study, with the abundances found by Barstow et al. (2003b) presented for comparison. The improvement seen progressing from a photospheric only model (figure 1) to a model that contains photospheric and circumstellar components in the C iv doublet of WD 0501+527 is illustrated in figure 2. Figure 3 shows a comparison of the C abundances derived here to those found by Barstow et al. (2003b), and figure 4 illustrates how the Si abundances measured here compare to previous estimates. The C abundances derived here using the C iv doublet have been revised down when compared to those from Barstow et al. (2003b) for all but two objects (WD 1611084 and WD 2218+706). The C abundances obtained from the different spectra of WD 0232+035 agree well, demonstrating that even in co-added spectra circumstellar contamination can be significant. The Si iv absorption lines do not suffer from such strong circumstellar contamination, leading to less revision of the Si abundances.


| WD | C iv/H† | 1 | 1 | C iii/H‡ | 3 | 3 | C iv/H‡ | 3 | 3 |
|---|---|---|---|---|---|---|---|---|---|
| 0232+035a | 1.62 | 8.80 | 5.53 | 7.64 | 6.00 | 2.90 | 4.00 | 6.70 | 4.90 |
| 0232+035b | 1.69 | 1.83 | 6.59 | 7.64 | 6.00 | 2.90 | 4.00 | 6.70 | 4.90 |
| 0501+527 | 1.40 | 2.07 | 2.12 | 1.99 | 4.40 | 8.80 | 4.00 | 4.40 | 9.80 |
| 0556375 | 4.10 | 4.87 | 1.47 | 1.70 | 8.40 | 3.40 | 4.00 | 6.10 | 3.00 |
| 0939+262 | 4.27 | 3.97 | 1.36 | 3.68 | 3.30 | 3.50 | 1.71 | 1.70 | 9.10 |
| 1611084 | 4.00 | 1.44 | 2.94 | 4.00 | 5.00 | 1.30 | |||
| 2218+706 | 4.08 | 2.23 | 4.96 | 1.59 | 4.90 | 1.58 | 6.70 | 2.80 | 3.30 |
| WD | Si iv/H† | 1 | Si iv/H‡ | 3 | 3 | ||||
| 0939+262 | 2.96 | 7.67 | 8.37 | 2.74 | 6.30 | 4.60 | |||
| 1611084 | 7.26 | 7.87 | 4.54 | 9.50 | 7.00 | 8.30 | |||
| 2218+706 | 5.08 | 1.74 | 2.33 | 1.93 | 1.10 | 1.10 |
†values from this study, ‡values from Barstow et al. (2003b), aresolved spectrum (0.74 binary phase), bblended spectrum (0.24 binary phase). Note: while 1 errors were computed here, Barstow et al. (2003b) computed 3 errors to allow the estimation of upper abundance limits where no unambiguous absorption lines were seen in their study, and so they are presented here.
4 Discussion
The downward revision of the C abundances of the stars examined here shows the significant effect circumstellar contamination can have on photospheric metal abundance measurements. Indeed, the C abundance for WD 0501+527 derived here using the C iv doublet is in better agreement with that measured by Barstow et al. (2003b) using the C iii lines than that found using the C iv doublet. Furthermore, the abundance derived here is also consistent with the C abundance derived by Vennes & Lanz (2001) for WD 0501+527, and with that measured using the C iii multiplet in the star’s FUSE spectrum (Barstow et al., in preparation). The C and Si abundances of WD 1611084 have been subject to little change, with the C abundance consistent with that derived using FUSE data; the Si abundance measured from the FUSE spectrum (Barstow et al., in preparation) is an order of magnitude larger than that found both here and by Barstow et al. (2003b), suggesting that circumstellar absorption may also be present in the FUSE data. Interestingly, the photospheric abundances of this star are in excess of those of most DAs with similar Teff values, and when coupled with the difficulties in both modelling the distribution of nitrogen in this star (Holberg et al. 1999; Chayer et al. 2005; Dickinson et al. 2012a) and in ascertaining the origin of its circumstellar material (Dickinson et al. 2012b), this object remains somewhat enigmatic.
Using the C abundance derived from the C iv doublet at WD 1942+499 and WD 2257073, Lallement et al. (2011) predicted a strong C iii multiplet that was not seen in the FUSE spectra of the stars. This was used to infer a non-photospheric origin for the C iv seen at these objects. Coupled with the contaminating effects detailed here, one can see that the use of the non-resonance C iii absorption lines () gives a better indication of photospheric C abundance than the C iv resonance transitions () where non-photospheric material is present, since the resonance lines will also be present in any highly ionised, low density material along the sight line to a given star. Furthermore, such significant differences in C abundances derived using the C iii and C iv absorption features can be a useful diagnostic of the presence of circumstellar material in future studies. Indeed, were the circumstellar and photospheric components to be completely unresolved, giving rise to symmetric blended absorption features, comparisons of abundances derived using resonant and non-resonant transitions could be used to infer the presence of the circumstellar material.
One way to better constrain the abundance of these stars would be to physically model both the photospheric and circumstellar line profiles, rather than modelling one and approximating the other, as has been done here and in previous work. Indeed, the approximation of the photospheric components used by Dickinson et al. (2012b) yielded line profiles inconsistent with those predicted from stellar atmosphere models (an example of this can be seen when comparing the 1548 Å C iv line profile of WD 0501+527 in figure 2 to that obtained using the fitting method used in Dickinson et al. 2012b; figure 5). This will allow a better understanding of both the photospheric abundances of the hot white dwarfs and the conditions present in the ionised circumstellar medium, and will be the subject of future work. Indeed, a robust physical model of the these absorption features may go some way to better understanding the extremely narrow, almost saturated absorption features of the very hot (110 000 K; Barstow et al. 2003b) DA WD 0948+534 (PG 0948+534), that as yet have proven difficult to model (Barstow et al. 2003b; Dickinson et al. 2012a).
Of the 16 stars surveyed by Bannister et al. (2003) and Dickinson et al. (2012b) with Teff values greater than 50 000 K, seven display unambiguous circumstellar absorption in both studies, with a further four stars (WD 0621376, WD 0948+534, WD 2211495 and WD 2331475) showing evidence for possible, unresolved circumstellar material in one or both studies. This means between 44 % and 69 % of the hot DAs surveyed have circumstellar lines in their spectra; re-observation of the objects with possible circumstellar material in the Bannister/Dickinson sample at higher resolution and signal to noise will allow this fraction to be better constrained. Additionally, of the stars with Teff values less than 50 000 K, one (WD 1611084) displays circumstellar lines, with two other stars serving as candidates for such material (WD 0050335 and WD 2152548). Recently, high signal to noise (S/N) observations have allowed circumstellar absorbing components to be detected at other DAs (e.g. Lallement et al. 2011). Observation of a wider hot DA sample will allow a larger, more statistically robust sample to be built up. This will more accurately establish the ubiquity of this phenomenon, allowing a deeper understanding of how these circumstellar features affect our picture of the hot white dwarf photosphere, and how these stars interact with their circumstellar environments, the ISM and any material still left from the stars’ PN phase, giving crucial insights into how young, hot white dwarfs and their environments evolve.
Acknowledgements
N.J.D. and M.A.B. acknowledge the support of STFC. B.Y.W. would like to acknowledge Guaranteed Time Observer funding for this research through NASA Goddard Space Flight Center grant 005118. N.J.D. wishes to thank Jay Holberg and Ivan Hubeny for useful discussions. We thank the referee for useful comments.
References
- Aannestad et al. (1990) Aannestad P.A., Kenyon S.J., Hammond G.L., Sion E.M., 1990, AJ, 105, 1033
- Arnaud (1996) Arnaud K., 1996, in Jacoby G.H., Barnes J., eds, ASP Conf. Ser., Vol. 101, Astronomical Data Analysis Software and Systems V. Astron. Soc. Pac., San Francisco, p. 17
- Bannister et al. (2003) Bannister N., Barstow M., Holberg J., Bruhweiler F., 2003, MNRAS, 341, 477
- Barstow et al. (1993) Barstow M., Fleming T., Diamond C., Finley D., Sansom A., Rosen S., Koester D., Holberg J., Marsh J., Kidder K., 1993, MNRAS, 264, 16
- Barstow et al. (2003a) Barstow M., Good S., Burleigh M., Hubeny I., Holberg J., Levan A., 2003a, MNRAS, 344, 562
- Barstow et al. (2003b) Barstow M., Good S., Holberg J., Hubeny I., Bannister N., Bruhweiler F., Burleigh M., Napowotzki R., 2003b, MNRAS, 341, 870
- Barstow et al. (2001) Barstow M., Holberg J., Hubeny I., Good S., Levan A., Meru F., 2001, MNRAS, 328, 211
- Barstow et al. (1998) Barstow M., Hubeny I., Holberg J., 1998, MNRAS, 299, 520
- Barstow et al. (1999) Barstow M., Hubeny I., Holberg J., 1999, MNRAS, 307, 884
- Bergeron et al. (1992) Bergeron P., Saffer R., Liebert J., 1992, ApJ, 432, 305
- Brinkworth et al. (2009) Brinkworth C.S. Gänsicke B., Marsh T., Hoard D., Tappert C., 2009, ApJ, 696, 1402
- Burleigh et al. (2010) Burleigh M. et al., 2010, in Werner K., Rauch T., eds, AIP Conf. Proc. Vol. 1273, 17th European White Dwarf Workshop, AIP, New York, p.473
- Burleigh et al. (2011) Burleigh M., et al., 2011, in Schuh S., Drechsel H., Heber U., eds, AIP Conf. Proc. Vol. 1331, Planetary Systems Beyond the Main Sequence, AIP, New York, p.473
- Casewell et al. (2009) Casewell S., Dobbie P., Napiwotzki R., Burleigh M., Barstow M., Jameson R., 2009, MNRAS, 395, 1795
- Chayer & Dupuis (2010) Chayer P., Dupuis J., 2010, in Werner K., Ruach T., eds, AIP Conf. Proc. Vol. 1273, 17th European White Dwarf Workshop, AIP, New York, p.394
- Chayer et al. (1995) Chayer P., Fontaine G., Wesemael F., 1995, ApJS, 99, 189
- Chayer et al. (2000) Chayer P., Kruk J., Ake T., Dupree A., Malina R., Siegmund O., Sonneborn G., Ohl R., 2000, ApJ, 538, 91
- Chayer et al. (1994) Chayer P., LeBlanc F., Fontaine G., Wesemael F., Michaud G., Vennes S., 1994, ApJ, 436, 161
- Chayer et al. (2006) Chayer P., Oliveira C., Dupuis J., Moos H., Welsh B., 2006, in Sonneborn G., Moos H., Anderson B.-G., eds, ASP Conf. Ser. Vol. 348, Astrophysics in the far ultraviolet: five years of Discovery with FUSE. Astron. Soc. Pac., San Francisco, p. 209
- Chayer et al. (2005) Chayer P., Vennes S., Dupuis J., 2005, in Koester D., Moehler S., eds, ASP Conf. Ser. Vol. 334, 14th European Workshop on White Dwarfs. Astron. Soc. Pac., San Francisco, p. 181
- Chayer et al. (1995) Chayer P., Vennes S., Pradhan A., Thejll P., Beauchamp A., Fontaine G., Wesemael F., 1995, ApJ, 454, 429
- Debes et al. (2012) Debes J., Kilic M., Faedi F., Shkolnik E.L., Weinberger A.J., Slesnick C., West R.G., 2012, ApJ, 754, 32
- Dickinson et al. (2012a) Dickinson N., Barstow M., Hubeny I., 2012a, MNRAS, 421, 3222
- Dickinson et al. (2012b) Dickinson N., Barstow M., Welsh B., Burleigh M., Farihi J., Redfield S., Unglaub K., 2012b, MNRAS, 423, 1397
- Dobbie et al. (2009) Dobbie P., Napiwotzki R., Burleigh M., Williams K., Sharp R., Barstow M., Casewell S., Hubeny I., 2009, MNRAS, 395, 2248
- Dreizler (1999) Dreizler S., 1999, A&A, 352, 632
- Dreizler & Werner (1993) Dreizler S., Werner K., 1993, A&A, 278, 199
- Dreizler & Wolff (1999) Dreizler S., Wolff B., 1999, A&A, 348, 189
- Dufour et al. (2010) Dufour P., Kilic M., Fontaine G., Bergeron P., Lachapelle F., Kleinmann S., Legget S., 2010, ApJ, 719, 803
- Dupuis et al. (2010) Dupuis J., Chayer P., Hénault-Brunet V., 2010, in Werner K., Rauch T., eds, AIP Conf. Proc. Vol. 1273, 17th European White Dwarf Workshop, AIP, New York, p.412
- Dupuis et al. (2000) Dupuis J., Chayer P., Vennes S., Damian J., Kruk J., 2000, ApJ, 537, 977
- Farihi et al. (2010) Farihi J., Barstow M., Redfied S., Dufour P., Hambly N., 2010, MNRAS, 404, 2123
- Fontaine et al. (2001) Fontaine G., Brassard P., Bergeron P., 2001, PASP, 113, 409
- Gänsicke et al. (2012) Gänsicke B., Koester D., Farihi J., Girven J., Parsons S., Breedt E., 2012, MNRAS, 424, 333
- Gänsicke et al. (2008) Gänsicke B., Koester D., Marsh T., Rebassa-Mansergas A., Southworth J., 2008, MNRAS, 391, L103
- Gänsicke et al. (2007) Gänsicke B., Marsh T., Southworth J., 2007, MNRAS, 380, L35
- Gänsicke et al. (2006) Gänsicke B., Marsh T., Southworth J., Rebassa-Mansergas A., 2006, Science, 314, 1908
- Good et al. (2004) Good S., Barstow M., Holbergh J., Sing D., Burleigh M., Dobbie P., 2004, MNRAS, 355, 1031
- Holberg et al. (2000) Holberg J., Barstow M., Bruhweiler F., Hubeny I., 2000, American Astron. Soc. Meeting, 197, 8304
- Holberg et al. (1999) Holberg J., Barstow M., Bruhweiler F., Hubeny I., Green E., 1999, ApJ, 517, 850
- Holberg et al. (1995) Holberg J., Barstow M., Bruhweiler F., Sion E., 1995, ApJ, 453, 313
- Holberg et al. (1997) Holberg J., Barstow M., Lanz T., Hubeny I., 1997, ApJ, 484, 871
- Holberg et al. (1998) Holberg J., Barstow M., Sion E., 1998, ApJS, 119, 207
- Holberg et al. (1999) Holberg J., Barstow M., Sion E., 1999, in Solheim S.-E., Meistas E.G., eds, ASP Conf. Ser. Vol. 169, 11th European Workshop on White Dwarfs. Astron. Soc. Pac., San Francisco, p. 485
- Holberg et al. (1985) Holberg J., Wesemael F., Wegner G., Bruhweiler F., 1985, ApJ, 293, 294
- Hubeny & Lanz (1995) Hubeny I., Lanz T., 1995, ApJ, 439, 875
- Klein et al. (2011) Klein B., Jura M., Koester D., Zuckerman B., 2011, ApJ, 741, 64
- Koester & Wilken (2006) Koester D., Wilken D., 2006, A&A, 453, 1051
- Lallement et al. (2011) Lallement R., Welsh B., Barstow M., Casewell S., 2011, A&A, 533, 140
- Liebert et al. (2005) Liebert J., Bergeron P., Holberg J., 2005, ApJS, 156, 47
- Marsh et al. (1997) Marsh M., Barstow M., Burleigh M., Holberg J., Koester D., O’Donoghue D., Penny A., Sansom A., 1997, MNRAS, 287, 705
- Melis et al. (2011) Melis C., Farihi J., Dufour P., Zuckerman B., Burgasser A., Bergeron P., Bochanski J., Simcoe R., 2011, ApJ, 732, 90
- Schuh et al. (2005) Schuh S., Barstow M., Dreizler S., 2005, in Koester D., Moehler S., eds, ASP Conf. Ser. Vol. 334, 14th European Workshop on White Dwarfs. Astron Soc. Pac., San Francisco, p. 237
- Schuh et al. (2002) Schuh S., Dreizler S., Wolff B., 2002, A&A, 382, 164
- Spitzer (1978) Spitzer L., 1978, Physical Processes in the Interstellar Medium, New York, John Wiley & Sons
- Unglaub (2007) Unglaub K., 2007, in Napiwotzki R., Burleigh M., eds, ASP Conf. Ser. Vol. 372, 15th European Workshop on White Dwarfs. Astron. Soc. Pac., San Francisco, p. 201
- Unglaub (2008) Unglaub K., 2008, A&A, 486, 923
- Vennes et al. (2005) Vennes S., Chayer P., Dupuis J., 2005, ApJ, 622, L121
- Vennes et al. (2006) Vennes S., Chayer P., Dupuis J., Lanz T., 2006, ApJ, 652, 1554
- Vennes & Lanz (2001) Vennes S., Lanz T., 2001, ApJ, 553, 399
- Welsh & Lallement (2005) Welsh B., Lallement R., 2005, A&A, 436, 615
- Welsh & Lallement (2010) Welsh B., Lallement R., 2010, PASP, 122, 1320
- Welsh et al. (2010) Welsh B., Lallement R., Vergely J.-L., Raimond S., 2010, A&A, 712, L199
- Werner et al. (2007) Werner K., Rauch T., Kruk J., 2007, A&A, 466, 317
- Zuckerman et al. (2011) Zuckerman B., Koester D., Dufour P., Melis C., Klein B., Jura M., 2011, ApJ, 671, 872
- Zuckerman et al. (2007) Zuckerman B., Koester D., Melis C., Hansen B., Jura M., 2007, ApJ, 671, 872
- Zuckerman et al. (2003) Zuckerman B., Koester D., Reid I.N., Hünsch M., 2003, ApJ, 596, 477
- Zuckerman & Reid (1998) Zuckerman B., Reid I.N., 1998, ApJL, 505, 143