Preliminary Analysis of WISE/NEOWISE 3-Band Cryogenic and Post-Cryogenic Observations of Main Belt Asteroids
Abstract
We present preliminary diameters and albedos for 13511 MBAs that were observed during the 3-Band Cryo phase of the WISE survey (after the outer cryogen tank was exhausted) and as part of the NEOWISE Post-Cryo Survey (after the inner cryogen tank was exhausted). With a reduced or complete loss of sensitivity in the two long wavelength channels of WISE, the uncertainty in our fitted diameters and albedos is increased to for diameter and for albedo. Diameter fits using only the and m channels are shown to be dependent on the literature optical absolute magnitudes. These data allow us to increase the number of size estimates for large MBAs which have been identified as members of dynamical families. We present thermal fits for asteroids previously identified as the parents of a dynamical family that were not observed during the fully cryogenic mission.
1 Introduction
In Masiero et al. (2011, hereafter Mas11) we presented thermal model fits for Main Belt asteroids that were observed during the fully cryogenic portion of the Wide-field Infrared Survey Explorer (WISE, Wright et al., 2010) mission, which ran from 7 January 2010 to 6 August 2010. Sensitivity to Solar system objects was enabled by the NEOWISE augmentation to the WISE mission (Mainzer et al., 2011a) which provided capability for processing and archiving of single-frame exposures and detection of previously known and new asteroids and comets. On 6 August 2010 the hydrogen ice in the outer cryogen tank was exhausted and the telescope began to warm up, resulting in an almost immediate loss of the W4 (m) channel and a decreasing sensitivity in W3 (m) beginning the 3-Band Cryo portion of the mission. On 29 September 2010 the hydrogen ice in the inner cryogen reservoir, used to cool the detectors, was exhausted and the W3 channel was lost. From 29 September 2010 to 1 February 2011, WISE continued to survey the sky in the NEOWISE Post-Cryo survey phase (Mainzer et al., 2012), searching for new near-Earth objects (NEOs) and completing the survey of the largest Main Belt asteroids (MBAs) using the two shortest bandpasses: W1 (m) and W2 (m).
MBAs have temperatures of K, depending on their distance from the Sun and surface properties. This places the peak of their blackbody flux near m. During the fully cryogenic portion of the WISE mission the W3 bandpass straddled this peak and was the primary source of data used for identification and analysis of the thermal emission from MBAs. For objects detected during the 3-Band Cryo portion of the mission we used the W3 data to constrain the thermal emission, and thus the diameter, of the objects observed. As the telescope warmed up, the integration times in W3 were shortened to prevent saturation of the detectors from the increasing thermal emission of the telescope (Cutri et al., 2012), resulting in a decrease in sensitivity to sources in the bandpass. During the Post-Cryo Survey only W1 and W2 were operational: for MBAs W1 was sensitive solely to reflected light, while W2 was a blend of reflected and emitted flux dictated by the object’s physical and orbital parameters (e.g. distance to Sun at the time of observation, surface temperature, albedo, etc.).
In this work, we present preliminary thermal model fits for 13511 Main Belt asteroids observed during the 3-Band Cryo phase of the WISE survey and the NEOWISE Post-Cryo Survey. During the fully cryogenic portion of the survey, detectability of most minor planets was dominated by their thermal emission and so was essentially independent of their albedo (Mainzer et al., 2011c). However, the Post-Cryo Survey data at m and m are a mix of reflected and emitted light. Thus detectability is strongly coupled to albedo. Additionally, objects with lower temperatures will have a smaller thermal emission component to their flux in the W2 band, resulting in a less accurate estimate of diameter. In general, diameter fits using either the 3-Band Cryo or the Post-Cryo Survey data will typically have larger errors and lower precision than fits from the fully cryogenic survey given in Mas11, though they still provide useful information about the observed population of MBAs.
One of the drivers for completing the NEOWISE survey of the inner Main Belt after the cryogen was exhausted was to have a complete census of the largest asteroids, particularly those that may be members of asteroid families. Having this list allows us to constrain the mass of the pre-breakup body and more precisely model the age of the family (Vokrouhlický et al., 2006; Masiero et al., 2012). We present in this work preliminary albedos and diameters for objects observed during the 3-Band Cryo and Post-Cryo Survey and discuss the accuracy of these values because these fits use data processed with the preliminary survey calibration values. Future work by the NEOWISE team will include second-pass processing of the raw data with finalized calibration values as well as extraction of sources at lower signal-to-noise that will precede a final release of albedos and diameters.
2 Observations
In Mas11 we focused our analysis on data taken during the fully cryogenic portion of the WISE mission. For this work, we analyze the 3-Band Cryo and Post-Cryo Survey observations taken by WISE as part of the NEOWISE survey. Observations obtained between Modified Julian Dates (MJDs) of 55414 and 55468 are available in the 3-Band Cryo Single-Exposure database, served by the Infrared Science Archive (IRSA)111http://irsa.ipac.caltech.edu. Post-Cryo data, spanning a MJD range of 55468 to 55593, are archived in the NEOWISE Preliminary Post-Cryo database and also served by IRSA. Data from the 3-Band Cryo survey were released to the public on 29 June 2012222http://wise2.ipac.caltech.edu/docs/release/3band/ and preliminary data from the NEOWISE Post-Cryo Survey were released to the public on 31 July 2012333http://wise2.ipac.caltech.edu/docs/release/postcryo_prelim/. We note that the Post-Cryo Survey data have only undergone first-pass processing, and users are strongly encouraged to consult the Explanatory Supplement (Cutri et al., 2012) associated with the database.
We follow the same method as described in Mas11 to acquire detections of MBAs that have been vetted both by our internal WISE Moving Object Processing System (WMOPS; Mainzer et al., 2011a) and by the Minor Planet Center (MPC). This includes the use of the same quality flag settings from the pipeline extraction for cleaning of detections before thermal fitting as discussed in Mas11. Of the 14638 objects observed by WISE between MJDs 55414 and 55593, 13511 MBAs had data of sufficient quality to perform thermal model fits.
Due to the nature of WISE’s orbit and the synodic period of MBAs, approximately half of the objects observed during the 3-Band Cryo and Post-Cryo Survey had also been observed earlier during the fully cryogenic survey. We use these overlap objects as standards to evaluate the accuracy of the thermal model fits using these data (see Section 4.1). While in some cases extremely irregularly shaped slow-rotating objects may show significant changes in projected area between epochs and thus large variations in both emitted and reflected flux, this is expected to be a small fraction of all objects observed and only to add a small component of random error to the comparison (Grav et al., 2011).
3 Thermal Fitting
Following the procedure discussed in Mas11, we use a faceted NEATM thermal model to determine the diameter and albedo of the MBAs observed after the outer cryogen tank was exhausted. In most cases we only have thermal emission data in a single band, and so we are forced to assume a beaming parameter for the models. We use a beaming parameter of , based on the peak of the distribution for MBAs given in Mas11. Our measured flux in W2 is typically dominated by thermal emission, however the reflected component of the W2 flux will influence our models.
In order to remove the reflected component from the measured W2 flux, we need to determine the optical geometric albedo () and assume a ratio between the near-IR (NIR) and optical albedos. In Mas11 we were able to fit this ratio for objects with with observations in and/or as well as and , however we cannot do this for the Post-Cryo Survey data. Following the best-fit value from Mas11, for those objects we assume a NIR/optical reflectance ratio of . In all cases, we also assume that the reflectivity in W1 is identical to that in W2 (). For objects with very red spectral slopes this may not necessarily be a good assumption (cf. Mainzer et al., 2011b; Grav et al., 2012) however without additional data (e.g. spectral taxonomy) it is impossible to disentangle these two values for this dataset.
To determine optical albedo we used the absolute magnitude and slope parameter given in the Minor Planet Center’s MPCORB file444http://www.minorplanetcenter.net/iau/MPCORB.html, and updated using other databases following Mas11. We note that recent work has shown that these values may be systematically offset in some magnitude ranges by up to mags when comparing predicted and observed apparent magnitudes (Pravec et al., 2012). This will affect the albedos that we calculate for the asteroids presented here, which in turn will change the relative contribution of emitted and reflected light in W2. Unlike the results presented in Mas11, where the diameter determination is independent of the optical measurement, any future revision to the measured values will require a refitting of the thermal models and will likely result in an change in modeled diameter.
4 Discussion
4.1 Comparison of Overlap Objects
Mainzer et al. (2012) showed a comparison between the thermal fits performed with the Post-Cryo Survey data and non-radiometrically determined diameters for a range of NEOs and MBAs to derive a relative accuracy of on diameter and on albedo. As a parallel check we have taken objects that were observed both before and after the exhaustion of the outer cryogen reservoir and compared the diameters and albedos found here to those values given in Mas11. Of the fits presented here, 7222 unique objects also appeared in the fully cryogenic observations that were presented in Mas11. Of these, 2844 were observed during the 3-Band Cryo phase of the survey and 4403 were observed during the Post-Cryo Survey (note that 25 objects appeared in all three phases of the survey).
For all objects seen in both the Post-Cryo Survey and in the fully cryogenic 4-band survey, we have refit the 4-band Cryo data using only the W1 and W2 measurements as a way of differentiating changes in the quality of fit due to the loss of W3 and W4 sensitivity from changes due to the different observing circumstances. The results of this test are shown in Figure 1. We include a running box average of the data in order to assess the population trends, which bins by 100 objects, in steps of 20. In general these tests follow the expected one-to-one relationship, with the exception of the comparison of the 2-band and 4-band fits of the fully cryogenic data (Figure 1b), which deviates at both high and low albedos, and effect that was also observed for the NEOs in the Post-Cryo Survey data by Mainzer et al. (2012). (Mainzer et al., 2011b) have shown that high albedo objects tend to have optical/NIR reflectance ratios of , while objects with low albedos tend to have reflectance ratios of (though D-type objects deviate from this trend and have very large reflectance ratios). As we use a fixed reflectance ratio of , low albedo objects with W1 measurements will have a final fitted below the true value, while high albedo objects will have a slightly above, which corresponds to the twist observed in Figure 1b.
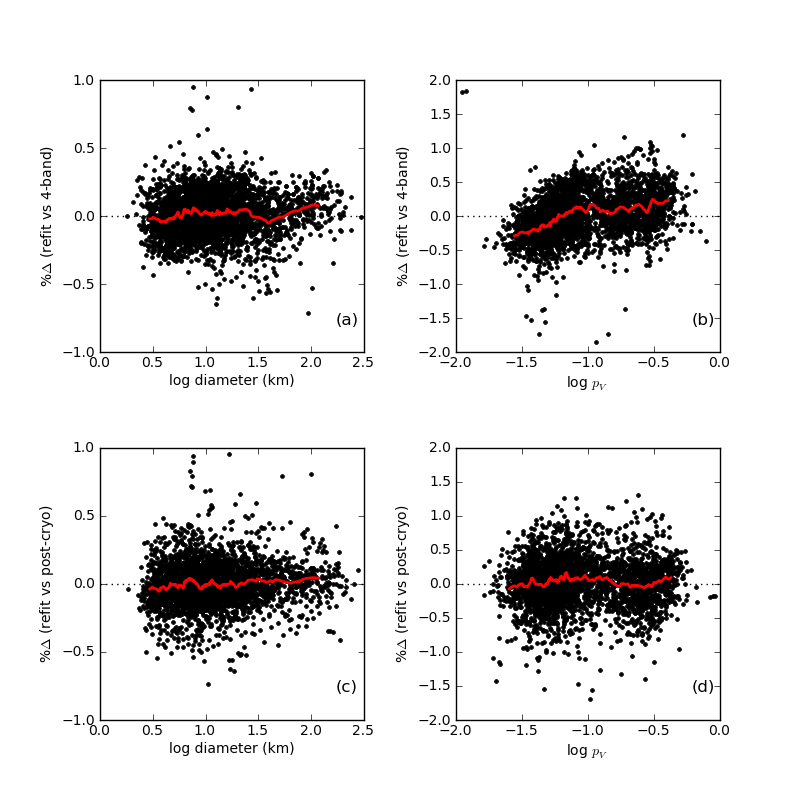
Comparison of the 2-band refits to the results from Mas11 show the uncertainty induced by the loss of W3 and W4 information (Figure 1a-b) results in a scatter of in diameter and in albedo (three points fall outside the plotted range for Figure 1(a); all other panels show all objects considered). Comparison of the 2-band refits of the fully cryogenic data to the Post-Cryo Survey fits (Figure 1c-d) shows the errors induced by both changes in observing aspect as well as calibration differences between the two data sets, which collectively result in a scatter of in diameter and in albedo as well. Combined, these two errors result in a measured relative error on diameter and in albedo.
These total errors are in line with what was found by Mainzer et al. (2012) when comparing the fits from Post-Cryo Survey data to literature diameters. Our errors are also in line with the uncertainties measured for the ExploreNEOs project which uses a similar pair of bandpasses (m and m) from the Warm Spitzer mission to model diameters and albedos for previously known NEOs (Trilling et al., 2010; Harris et al., 2011). Our measured level of error indicates that the random error introduced by the combined effect of irregular shape and observing geometry is below this level. We note that the method of source extraction used for all phases of the WISE data processing relies on the position of the object in all detected bands. In general the W1 and W2 measurements from the 4-band data will be at lower signal-to-noise than the data for those objects extracted from the Post-Cryo Data, inflating the errors quoted above.
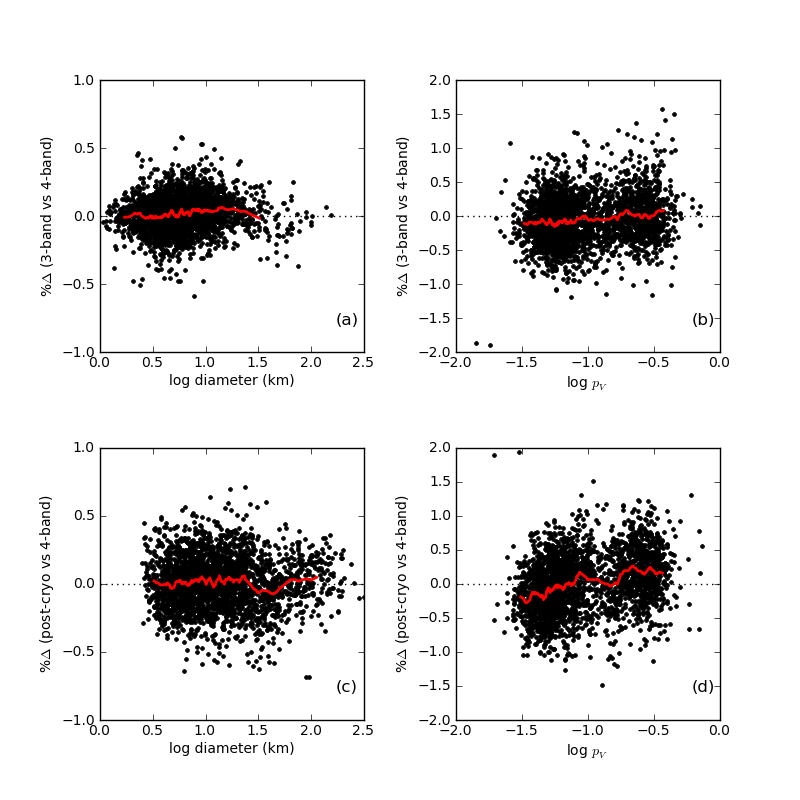
We show in Figure 2 the comparison between the fits for objects appearing in the fully cryogenic data as well as the 3-Band Cryo or Post-Cryo Survey data. As in Figure 1 we include a running box average using the same parameters as above. We see no large-scale systematic shifts between datasets, however we do confirm the increase in scatter in the fits using the latter data sets. We note that in Figure 2d shows a behavior similar to what we observe in Figure 1b, where the fits of albedo deviate to more extreme values for both high and low albedo objects. As discussed above, this is attributed to the use of an assumed optical/NIR reflectance ratio that is between the values measured for high and low albedo objects when they are considered independently.
4.2 Preliminary Diameters and Albedos
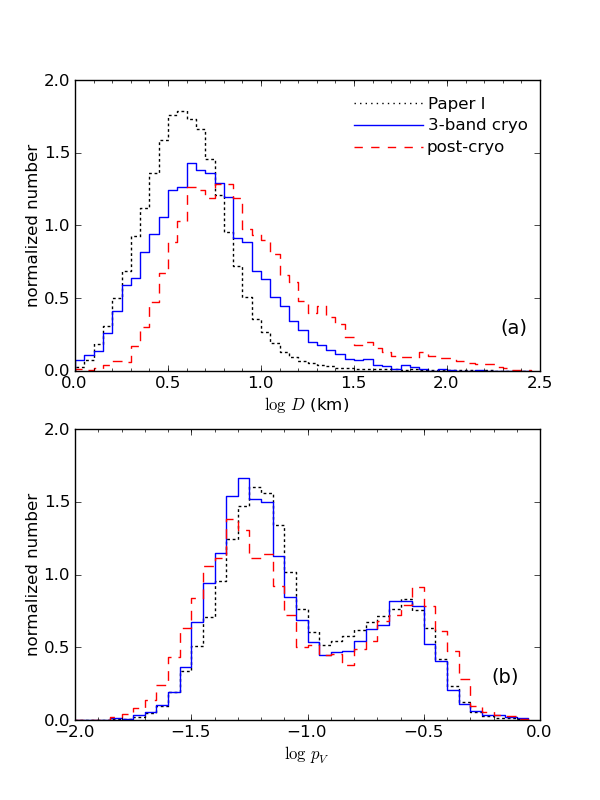
We present in Table 1 the preliminary fitted diameters and albedos for all MBAs observed during the 3-Band Cryo and Post-Cryo surveys, along with their associated errors (note that errors do not include the systematic diameter error or albedo error discussed above). We also include the number of detections used in each band as well as the and values used for the fit. Objects without measured visible magnitudes have “nan” entered for their , , and albedo values. The recommended method for extracting fluxes for asteroid detections is discussed in Mainzer et al. (2011a) and Cutri et al. (2012). Figure 3 shows the preliminary diameter and albedo distributions for the asteroids observed during 3-Band Cryo and Post-Cryo Surveys compared to the population presented in Mas11. With the loss of the long wavelength channels the sensitivity to small objects was reduced and peak of the diameter distribution moves to larger sizes. In both the 3-Band Cryo and Post-Cryo Survey data we see a shift in the high and low branches of the albedo distribution to more extreme values when compared to the population from Mas11. This shift was also observed for the NEOs by Mainzer et al. (2012), and attributed to the forced values for both beaming and NIR/optical reflectance ratio in the fits of the Post-Cryo Survey data.
Reflected light is a much more significant component in the W1 and W2 bandpasses for MBAs than in the W3 and W4 bands used in Mas11 to perform thermal fits. As such, results from the model fits presented here are inherently tied to the optical measurements and cannot be considered insensitive to albedo as was assumed in Mas11. This bias will most strongly affect objects that are small and have low albedos. Thus, care must be taken before extrapolating the trends observed in the these fits to the greater MBA population.
| Name | H | G | D (km) | nW1 | nW2 | nW3 | |
|---|---|---|---|---|---|---|---|
| 00003 | 5.33 | 0.32 | 246.60 10.59 | 0.214 0.026 | 11 | 11 | 0 |
| 00005 | 6.85 | 0.15 | 106.70 3.14 | 0.282 0.050 | 14 | 14 | 0 |
| 00011 | 6.55 | 0.15 | 154.13 3.92 | 0.178 0.030 | 12 | 12 | 0 |
| 00014 | 6.30 | 0.15 | 145.68 5.27 | 0.251 0.041 | 9 | 9 | 0 |
| 00016 | 5.90 | 0.20 | 288.29 4.63 | 0.093 0.024 | 5 | 5 | 0 |
| 00017 | 7.76 | 0.15 | 69.64 2.26 | 0.287 0.051 | 9 | 10 | 0 |
| 00018 | 6.51 | 0.25 | 155.84 5.63 | 0.181 0.033 | 12 | 12 | 0 |
| 00019 | 7.13 | 0.10 | 209.81 2.20 | 0.056 0.012 | 11 | 11 | 0 |
| 00020 | 6.50 | 0.25 | 135.68 3.67 | 0.241 0.018 | 13 | 13 | 0 |
4.3 Asteroid Family Members
One of the primary drivers of the Post-Cryo Survey was to complete the census of large MBAs that are related to dynamically associated asteroid families. The largest body in a family anchors both the mass estimate of the pre-breakup body and the starting point for family age simulations. The 3-Band Cryo and Post-Cryo Survey data contain 3319 objects identified by (Nesvorný, 2010) as members of asteroid families that were able to have thermal models fit to their measurements. Of these, 14 were identified as family parents and were not observed during the WISE fully cryogenic mission, including (3) Juno, (20) Massalia, (44) Nysa, (170) Maria, (298) Baptistina, (363) Padua, (434) Hungaria, (490) Veritas, (569) Misa, (778) Theobalda, (1270) Datura, (1892) Lucienne, (4652) Iannini, and (7353) Kazuya.
Of these 14 bodies that are the largest in their family, only 4 had albedos below , in contrast with the general population presented here where of the MBAs had low albedos. This is due to a number of overlapping selection biases, including the dominance of high albedo objects in the literature family lists (cf. Mas11), preferential sensitivity to high albedo objects in the 3-Band Cryo and Post-Cryo Survey data compared to Mas11 (meaning this data set is more likely to miss low albedo asteroids), and the longer synodic periods of MBAs with smaller semimajor axes. The differences in synodic period resulted in a larger fraction of objects in the inner Main Belt that were not observed during the fully cryogenic phase of the WISE survey, compared to the outer Main Belt. Future work in family identification will begin to mitigate these biases.
5 Conclusions
We present preliminary thermal model fits for 13511 MBAs using observations acquired by the WISE and NEOWISE surveys following the exhaustion of the outer cryogen tank that marked the end of the fully cryogenic WISE survey. Accuracy of these fits is degraded with respect to the results discussed in Mas11 due to the loss of the W3 and W4 bandpasses, however fits of diameter with relative accuracy of are still possible. Unlike the fits presented in Mas11, these determinations depend strongly on the measured value of the optical albedo (as calculated from the absolute magnitude). Thus, any revision to the values will require a new thermal model to be fit to the data. This dataset includes detection of 3319 members of previously identified asteroid families, one of the main goals of the Post-Cryo Survey. Future work by the NEOWISE team will include second-pass processing of these data sets using updated calibration products, which is expected to improve the accuracy of diameter and albedo determination.
Acknowledgments
J.R.M. was supported by an appointment to the NASA Postdoctoral Program at JPL, administered by Oak Ridge Associated Universities through a contract with NASA. We thank the anonymous referee for their helpful comments. This publication makes use of data products from the Wide-field Infrared Survey Explorer, which is a joint project of the University of California, Los Angeles, and the Jet Propulsion Laboratory/California Institute of Technology, funded by the National Aeronautics and Space Administration. This publication also makes use of data products from NEOWISE, which is a project of the Jet Propulsion Laboratory/California Institute of Technology, funded by the Planetary Science Division of the National Aeronautics and Space Administration. This research has made use of the NASA/IPAC Infrared Science Archive, which is operated by the Jet Propulsion Laboratory, California Institute of Technology, under contract with the National Aeronautics and Space Administration.
References
- Cutri et al. (2012) Cutri, R.M., Wright, E.L., Conrow, T., Bauer, J., et al., 2012, http://wise2.ipac.caltech.edu/docs/release/allsky/expsup/index.html
- Grav et al. (2011) Grav, T., Mainzer, A.K., Bauer, J.M., Masiero, J., Spahr, T, et al., 2011, ApJ, 742, 40.
- Grav et al. (2012) Grav, T., Mainzer, A.K., Bauer, J.M., Masiero, J., 2012, ApJ in press.
- Harris et al. (2011) Harris, A.W., Mommert, M., Hora, J.L., Mueller, M., et al., 2011, AJ, 141, 75.
- Mainzer et al. (2011a) Mainzer, A.K., Bauer, J.M., Grav, T., Masiero, J., et al., 2011a, ApJ, 731, 53.
- Mainzer et al. (2011b) Mainzer, A.K., Grav, T., Masiero, J., Hand, E., et al., 2011b, ApJ, 741, 90.
- Mainzer et al. (2011c) Mainzer, A.K., Grav, T., Bauer, J.M., Masiero, J., et al., 2011c, ApJ, 743, 156.
- Mainzer et al. (2012) Mainzer, A.K., Grav, T., Bauer, J.M., Masiero, J., et al., 2012, ApJ, submitted to ApJL.
- Masiero et al. (2011) Masiero, J.R, Mainzer, A.K., Grav, T., Bauer, J.M., et al., 2011, ApJ, 741, 68.
- Masiero et al. (2012) Masiero, J.R, Mainzer, A.K., Grav, T., Bauer, J.M. & Jedicke, R., 2012, ApJ in press.
- Nesvorný (2010) Nesvorny, D., 2010, EAR-A-VARGBDET-5-NESVORNYFAM-V1.0, NASA Planetary Data System.
- Pravec et al. (2012) Pravec, P., Harris, A.W., Kus̆nirák, P., Galád, A. & Hornoch, K., 2012, Icarus, submitted.
- Trilling et al. (2010) Trilling, D., Mueller, M., Hora, J.L., Harris, A.W., et al., 2012, AJ, 140, 770.
- Vokrouhlický et al. (2006) Vokrouhlický, D., Broz̆, M., Bottke, W.F., Nesvorný, D. & Morbidelli, A., 2006, Icarus 182, 118.
- Wright et al. (2010) Wright, E.L., Eisenhardt, P., Mainzer, A.K., Ressler, M.E., Cutri, R.M., Jarrett, T., Kirkpatrick, J.D., Padgett, D., et al., 2010, AJ, 140, 1868.