119–126
Star Formation Efficiency at Intermediate Redshift
Abstract
Star formation is evolving very fast in the second half of the Universe, and it is yet unclear whether this is due to evolving gas content, or evolving star formation efficiency (SFE). We have carried out a survey of ultra-luminous galaxies (ULIRG) between z=0.2 and 1, to check the gas fraction in this domain of redshift which is still poorly known. Our survey with the IRAM-30m detected 33 galaxies out of 69, and we derive a significant evolution of both the gas fraction and SFE of ULIRGs over the whole period, and in particular a turning point around z=0.35. The result is sensitive to the CO-to-H2 conversion factor adopted, and both gas fraction and SFE have comparable evolution, when we adopt the low starburst conversion factor of =0.8 M⊙ (K km s-1 pc2)-1. Adopting a higher will increase the role of the gas fraction. Using =0.8, the SFE and the gas fraction for z0.2-1.0 ULIRGs are found to be significantly higher, by a factor 3, than for local ULIRGs, and are comparable to high redshift ones. We compare this evolution to the expected cosmic H2 abundance and the cosmic star formation history.
keywords:
galaxies: evolution; galaxies: ISM; galaxies: interactions; galaxies: starburst; radio lines: galaxies1 Introduction
Star formation (SF) was processing at a much larger rate in galaxies in the first half of the universe history, and the most striking feature in the cosmic SF rate density is the decline by a factor 10 since z=1 (Madau et al. 1998, Hopkins & Beacom 2006). Several factors could be invoked to explain such a behavior: first the gas fraction in star forming galaxies is likely to have been higher in the past, as already suggested by CO surveys, tracing the molecular gas content of galaxies. Locally, the gas fraction for giant spirals is about 7-10% (Leroy et al. 2008, Saintonge et al. 2011a), while at z1.2 it increases to 345% and at z2.3 to 446% (Tacconi et al. 2010, Daddi et al. 2010). Second, the star formation efficiency might have been higher in the past, due to the dynamical trigger of galaxy interactions, whose frequency increases with redshift (e.g. Conselice et al. 2009, Kartaltepe et al. 2010), and also the more violent instabilities in more unstable disks, with lower bulge-to-disk ratios. The star formation efficiency (SFE) defined as the ratio of SFR to gas content, has been observed to increase with redshift (e.g. Greve et al. 2005), even for the most extreme starbursts, represented by ultra-luminous infrared galaxies (ULIRG). This tendency is however supported mainly by comparing local and high-z galaxies, at z1, and very little is known about the molecular gas content of galaxies at intermediate redshift between z=0.2 and 1. This CO desert is mainly due to observational difficulties, and motivated our CO survey of starburst galaxies in this redshift range. A first study at 0.2z0.6 (Combes et al. 2011) has indeed confirmed a strong increase of SFE in this redshift range.
2 Star formation efficiency and gas fraction
We have now completed our CO survey of 69 starburst galaxies with 0.2z1.0, and obtained a global detection rate of 48%. Since the conversion factor is a key parameter in this study, we have obtained CO detections in several J-lines for a dozen of galaxies, and found different excitation for the gas. When the gas mass could be derived from the dust emission however, the resulting values conforted our adoption of the =0.8 conversion factor (Combes et al. 2012). Mapping of some galaxies with the IRAM interferometer showed that the molecular gas is extended at kpc scales, and not only confined to a nuclear component (Combes et al. 2006, and in prep.).
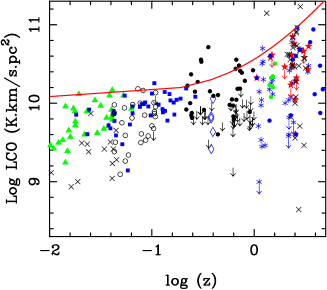
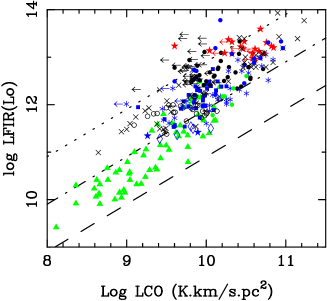
Figure 1 shows that the data gap at intermediate redshift is now filled. The CO luminosities of starburst galaxies display an envelope which is constantly rising with redshift in this interval. The FIR to CO correlation is non-linear, and define gas depletion time between 6 and 600 Myr (fig 1 right).
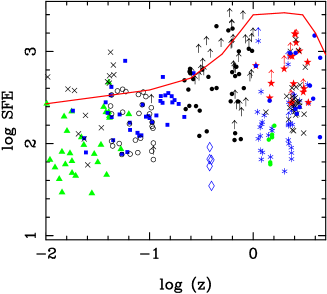
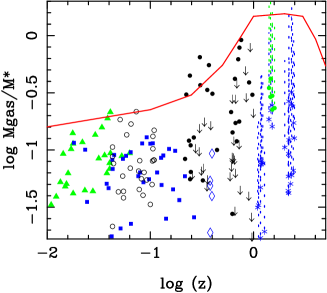
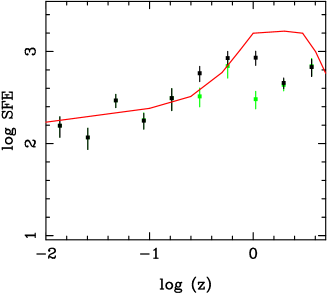
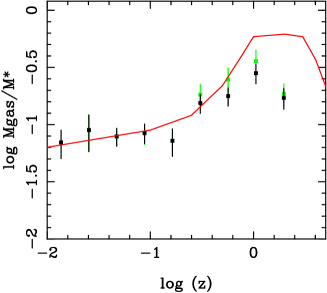
The gas fraction requires the determination of stellar mass, which was obtained through SED-fitting of optical and near-infrared luminosities (Combes et al. 2012). We define the star formation efficiency as the ratio of far infrared luminosity (proxy of star formation rate) and the molecular mass derived from the CO luminosity, with a constant conversion factor = 0.8 M⊙ (K km s-1 pc2)-1. The SFE and gas fraction are plotted versus redshift and compared to available data in Fig 2. Both display an envelope which rises with redshift in the intermediate range between 0.2 and 1.0, the range where the cosmic star formation rate density is remarkably increasing by an order of magnitude. These trends are also visible in the bin-averages of the data, taking or not the upper limits into account (cf fig 3).
3 Conclusion
The increase of both star formation efficiency and gas fraction with redshift in the intermediate range for starburst galaxies suggests that both factors play a role in driving the evolution of the cosmic star formation rate density. The relative influence of each physical quantity is strongly linked to the CO-to-H2 conversion factor. If a standard Milky Way ratio is used for these galaxies, their gas fraction will then dominate the evolution. We have tried to relate the star formation efficiency to the compactness of the starburst, measured from the half-light radius in the I-band (corresponding to the blue band in the rest frame). There is indeed an anticorrelation of SFE with half-light radius, but with a large scatter. The SFE was also plotted with respect to the specific star formation rate (or SFR per unit stellar mass), and compared to the locus of local “normal” star forming galaxies from the COLD GASS survey (Saintonge et al. 2011b). The starburst galaxies are globally located below, meaning that their gas content is significantly higher.
References
- [] Bouwens R.J., Illingworth G.D., Franx M., Ford H.: 2008, ApJ 686, 230
- [] Chung, A., Narayanan, G., Yun, M. S., Heyer, M.,Erickson, N.R.: 2009, AJ 138, 858
- [] Combes, F., García-Burillo, S., Braine, J. et al. : 2006, A&A 460, L49
- [] Combes, F., García-Burillo, S., Braine, J. et al. : 2011, A&A 528, A124
- [] Conselice, C. J., Yang, C., Bluck, A.F.L.: 2009, MNRAS 394, 1956
- [] Daddi E., Bournaud, F., Walter, F.et al. : 2010 ApJ 713, 686
- [] Gao Y., Solomon P.M.: 2004 ApJS 152, 63
- [] Geach, J.E., Smail I., Coppin K. et al. : 2009, MNRAS 395, L62
- [] Geach, J.E., Smail I., Moran S.M. et al. : 2011, ApJ 730, L19
- [] Genzel, R., Tacconi, L. J., Gracia-Carpio, J. et al. : 2010, MNRAS 407, 2091
- [] Greve. T.R., Bertoldi, F., Smail, I. et al. : 2005, MNRAS 359, 1165
- [] Hopkins, A.M., Beacom J.F.: 2006, ApJ, 651, 142
- [] Iono, D., Wilson, C. D., Yun, M.S. et al. : 2009, ApJ, 695, 1537
- [] Kartaltepe, J. S.,Sanders, D. B., Le Floc’h, E. et al. : 2010, ApJ 721, 98
- [] Kistler M.D., Yüksel H., Beacom J.F. et al. : 2009, ApJ 705, L104
- [] Leroy, A. K., Walter, F., Brinks, E. et al. 2008, AJ 136, 2782
- [] Madau P., Pozzetti L., Dickinson M.E.: 1998, ApJ 498, 106
- [] Obreschkow, D., Rawlings, S.: 2009 ApJ 696, L129
- [] Saintonge, A., Kauffmann, G., Kramer, C. et al. : 2011a, MNRAS 415, 32
- [] Saintonge, A., Kauffmann, G., Wang J. et al. : 2011b, MNRAS 415, 61
- [] Solomon P., Downes D., Radford S., Barrett J.: 1997, ApJ 478, 144
- [] Solomon P., Vanden Bout P.A.: 2005, ARAA 43, 677
- [] Tacconi L.J., Genzel R., Neri R. et al. : 2010, Nature 463, 781