Modulated structure in the martensite phase of Ni1.8Pt0.2MnGa: a neutron diffraction study
Abstract
orthorhombic modulated structure in the martensite phase of Ni1.8Pt0.2MnGa is reported by powder neutron diffraction study, which indicates that it is likely to exhibit magnetic field induced strain. The change in the unit cell volume is less than 0.5% between the austenite and martensite phases, as expected for a volume conserving martensite transformation. The magnetic structure analysis shows that the magnetic moment in the martensite phase is higher compared to Ni2MnGa, which is in good agreement with magnetization measurement.
pacs:
75.50.Cc, 81.30.KfNi2MnGa is a ferromagnetic Heusler alloy, which shows a large magnetic field induced strain (MFIS) and fast actuation in the martensite phase.Ullakko96 ; Murray00 ; Sozinov02 These properties make Ni2MnGa a material with high potential for application as magnetic actuators. However, brittleness and low transition temperature of this material has necessitated the search for new alloys with similar MFIS, but with higher transition temperatures and ductility.Pons08 In the Ni-Mn-Ga family, an increased magnetic transition temperature () of 588 K as well as 4% MFIS has been reported for Mn2NiGa.Liu05 Generally, MFIS is observed in structures that exhibit modulation, since that leads to lower twinning stress.Murray00 The modulation can be described as a shuffling of the (110) planes along the [10] direction.Webster84 ; Brown02 ; Righi06 A modulated structure in Mn2NiGa has been recently reported by x-ray diffraction study.SSingh10 In the case of Ga2MnNi, although is lower than Ni2MnGa, a large martensitic start temperature (Ms) and modulated structure have been observed.Barman08 ; SSingh11 Other ferromagnetic shape memory alloys such as Ni-Mn-Al,Fujita00 Ni-Mn-Fe-Ga,Wang06 ; Koho04 and Ni-Fe-Ga-CoMorito05 showing MFIS with improved ductility have been reported. A modulated structure has also been reported for off-stochiometric Ni-Mn-In compositions.Krenke07 ; Brown11 However, although the above mentioned materials exhibit MFIS, the magnitude is much smaller compared to Ni2MnGa (10%). Of late, ab-initio density functional theory (DFT) has played an important role in predicting new ferromagnetic shape memory alloys.Barman08 ; Chakrabarti09 Taking cue from an earlier experimental work,Wuttig04 a recent DFT study has put forward Pt doped Ni2MnGa to be an alternative to Ni2MnGa.Entel11 The theoretical estimate of maximum MFIS is about 14% that is higher than Ni2MnGa.Entel11 In this letter, we report the existence of a modulated structure in the martensite phase of Ni1.84Pt0.2MnGa0.96 from neutron diffraction studies, which is strongly suggests that it would exhibit MFIS. Our analysis shows that the magnetic moment in the martensite phase is higher than Ni2MnGa.
The specimen has been prepared by melting appropriate quantities of Ni, Pt, Mn and Ga of 99.99% purity in an arc furnace. Less than 1% weight loss was observed after melting. The ingot was then annealed at 1173 K for 3 days for homogeneization and then slow cooled to room temperature. X-ray diffraction at room temperature showed a single phase structure, as expected for the austenite phase. The composition determined by energy dispersive analysis of x-rays (EDAX) was done using scanning electron microscope with Oxford detector model turned out to be Ni1.84Pt0.2MnGa0.96, which we nominally refer to as Ni1.8Pt0.2MnGa henceforth in the manuscript. Powder neutron diffraction was performed using neutrons of wavelength 1.59Å at the D2B neutron diffractometer in ILL, Grenoble. The specimen was placed in a cylindrical vanadium cylinder inside a furnace for recording diffraction patterns at 450 K and 300 K and inside a cryofurnace for the 230 K measurement. Rietveld analysis of the neutron data were carried out using the FULLPROF software package.FullProf00
To obtain the transition temperatures differential scanning calorimetry (DSC) was performed using TA Instruments MDSC model 2910 at a scan rate of 10∘/minute. Magnetization measurements were performed using a MPMS XL5 superconducting quantum interference device (SQUID) magnetometer. From DSC, we obtain the martensite start (), martensite finish (), austenite start () and austenite finish () temperatures to be 285 K, 260 K, 274 K and 305 K, respectively (Fig. 1(a)). These temperatures are slightly different from the values reported earlier,Entel11 ; Entel12 ; note which is possibly related to difference in composition. It is well known that in Ni-Mn-Ga the martensite transition temperatures vary sensitively with composition.Liu05 ; Banik09 An important observation is that Ms (285 K) of this material is close to room temperature, in contrast to Ni2MnGa (200 K), which makes it more attractive for practical applications. The latent heat of transformation turns out to be 1.09 kJoule/mole, which is similar to Ni2MnGa.Banik07 The signature of the magnetic transition at = 3522 K is observed in both heating and cooling curves of DSC. The hysteresis loops for the martensite (250 K) and austenite (300 K) phases show that both the phases are ferromagnetic with magnetic moments of 3.55/f.u. and 2.8/f.u., respectively (Fig. 1(b)).
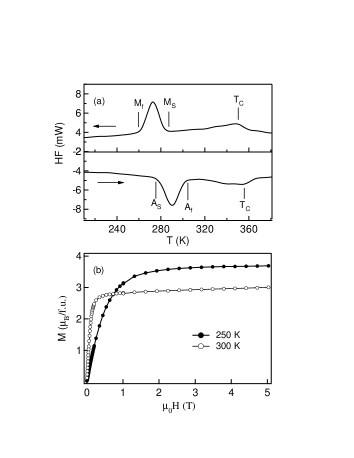
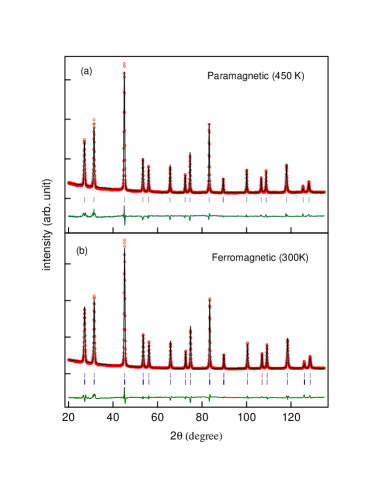
Fig. 2 shows that all the neutron diffraction peaks in the austenite phase obtained at 450 K (paramagnetic) and 300 K (ferromagnetic, = 355 K) can be indexed well using the cubic L21 structure. The lattice parameter is 5.88 at 450 K, while it is 5.852Å at 300 K. Compared to Ni2MnGa (= 5.825 at 300 K)Brown02 , the lattice constant is larger in Ni1.8Pt0.2MnGa. Increase in the volume of the unit cell with Pt doping in Ni2MnGa has been predicted by DFT calculationsEntel11 . The Rietveld refinement was performed using space group Fmm, where Ni and Pt atoms occupy the 8 (0.25, 0.25, 0.25) position, while Mn and Ga are at 4 (0, 0, 0) and 4 (0.5, 0.5, 0.5) Wyckoff positions, respectively. The significantly different coherent nuclear scattering amplitudes of Ni (10.3 fm), Mn (-3.73 fm), Ga (7.29 fm) and Pt (9.6 fm) allows the determination of the occupancies of each site. In order to determine the atomic structure in the ferromagnetic state (300 K), the occupancies were also refined by fitting the diffraction pattern above 2= 60∘, where the magnetic contribution in the peak intensity is negligible. The refined occupancies at 300 K were similar to 450 K, which rules out the possibility of temperature induced disorder effect at 450 K. After determining the site occupancies (Table I), the refinement of the diffraction pattern in 2 range 20∘-140∘ was carried out including a ferromagnetic moment on the manganese atoms characterized by a Mn2+ form factor. The refinement results clearly show that the Pt atoms occupy only the Ni site and Ni-Mn or Mn-Ga anti-site disorder are absent. Antisite disorder was also reported to be absent in Ni2MnGa.Brown02 The magnetic moment of Ni1.8Pt0.2MnGa at 300 K turns out to be 2.44(06) from our analysis and this is close to the the value (2.8 ) obtained from magnetization measurement (Fig. 1b).
| Temperature | 450 K | 300K | ||
| Space group | Fmm | Fmm | ||
| Lattice parameter | 5.884Å | 5.852Å | ||
| Cell volume (Å3) | 203.70 | 200.43 | ||
| 1.5 | 2 | |||
| Atom | site | Occ. | Moment () | |
| Ni | 8 | 1.8 | - | |
| Pt | 8 | 0.2 | - | |
| Mn | 4 | 1 | 2.44(06) | |
| Ga | 4 | 1 | - |
| Crystal system | Orthorhombic | ||
|---|---|---|---|
| Space group | Pnnm | ||
| Cell (Å) | = 4.261, | = 29.604, | = 5.583 |
| Atom | Wych. | Mom. () | |||
|---|---|---|---|---|---|
| Mn1 | 2a | 0 | 0 | 0 | 3.60(1) |
| Ga1 | 2b | 0 | 0 | 0.5 | |
| 0.9Ni1+0.1Pt1 | 4f | 0.5 | 0.0 | 0.25 | |
| Mn2 | 2a | 0.055(13) | 1/7 | 0 | 3.60(1) |
| Ga2 | 2b | -0.038(9) | 1/7 | 0.5 | |
| 0.9Ni2+0.1Pt2 | 4f | 0.443(2) | 1/7 | 0.25 | |
| Mn3 | 4g | 0.087(13) | 2/7 | 0 | 3.60(1) |
| Ga3 | 4g | 0.058(7) | 2/7 | 0.5 | |
| 0.9Ni3+0.1Pt3 | 8h | 0.540(2) | 2/7 | 0.25 | |
| Mn4 | 4g | -0.057(11) | 3/7 | 0 | 3.60(1) |
| Ga4 | 4g | -0.050(7) | 3/7 | 0.5 | |
| 0.9Ni4+0.1Pt4 | 8h | 0.420(2) | 3/7 | 0.25 | |
| = 2.70 |
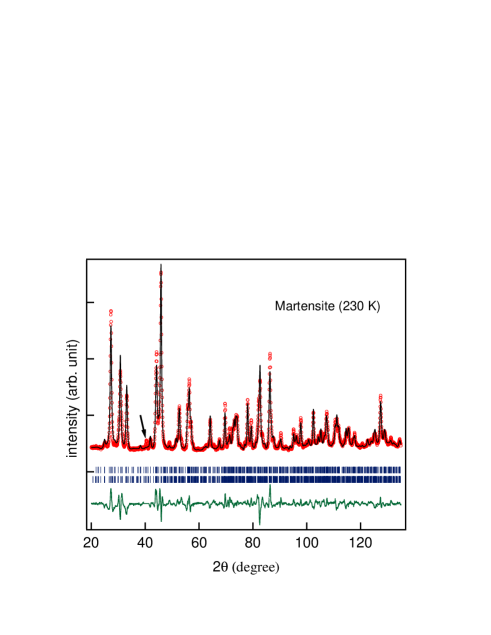
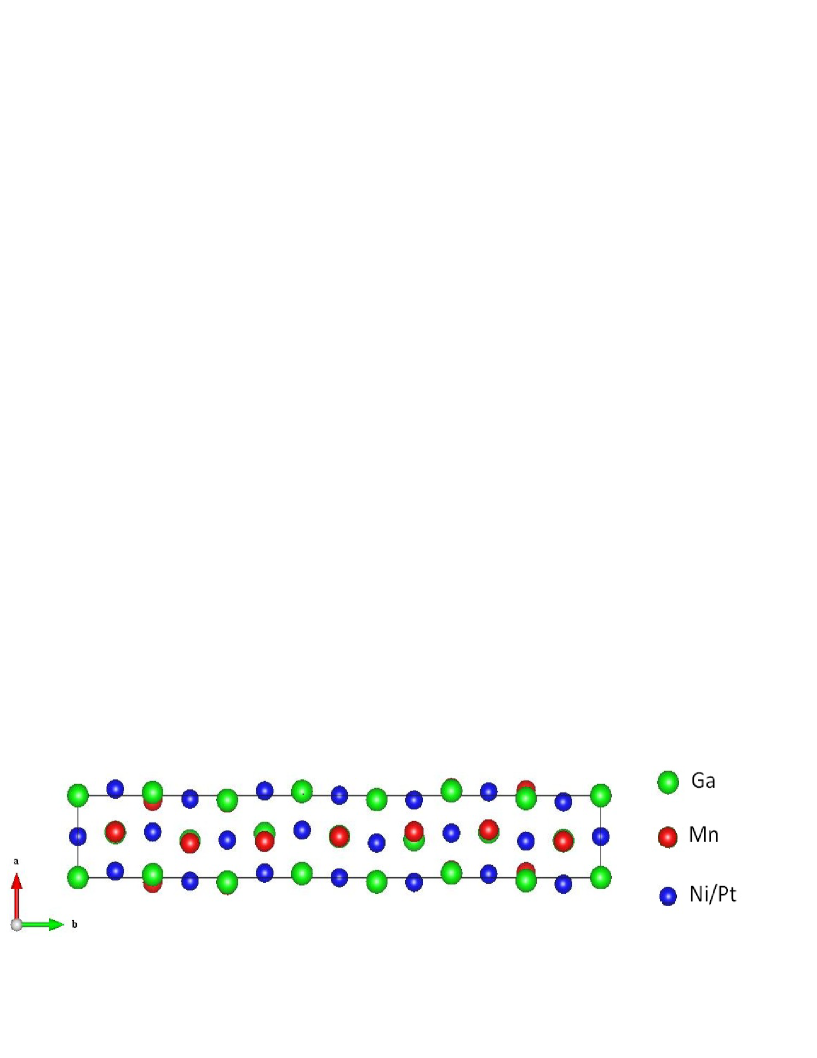
Ni1.8Pt0.2MnGa is expected to transform to the martensite phase below the martensite finish temperature of Mf= 260 K. The diffraction pattern at 230 K (Fig. 3) that depicts the martensite phase is found to be completely different from the austenite phase (Fig. 2) with the occurrence of many extra peaks. The absence of peaks related to the L21 phase confirms that the transformation to the martensite phase is complete. In order to analyze this diffraction pattern, initially Lebail fitting trials using the tetragonal, orthorhombic and monoclinic unit cells were performed. But these failed to account for all the Bragg peaks. This suggests the possibility of the existence of a modulated phase. Since the Pt doping is small (10%) in Ni1.8Pt0.2MnGa, an attempt was made to fit the pattern using the orthorhombic unit cell and space group that has been proposed for Ni2MnGa.Brown02 The starting unit cell parameters were taken as = (), = () and = . All the Bragg peaks could be indexed by using this orthorhombic unit cell. The only peak that could not be accounted for at 2= 40.5∘ is due to aluminum in the cryofurnace wall. So, the 2 range of this peak was excluded during the refinement. The lattice parameters obtained from the refinement are = 4.261 Å, = 29.604 Å and = 5.583 Å, which are larger than Ni2MnGa.Brown02 ; Righi06 However, the relation between and is found to be 7, which indicates a seven-fold increase in the unit cell along . A similar relation between and has been reported for Ni2MnGa and ascribed to the modulated structure.Brown02 ; Righi06 ; Ranjan06 The atomic structure refinement was performed using the Rietveld method and the refined atomic positions are shown in Table II. The modulation waves for all the atoms (Ni/Pt, Mn and Ga) are clearly observed in Fig. 4. If compared to Ni2MnGa,Brown02 ; Righi06 the amplitude of modulation for Mn and Ga is larger, while it is smaller for Ni. The unit-cell volume of the martensite phase (704.25 Å3) is within 0.5% of that of a comparable austenite cell volume given by 7/2 (701.42 Å3). Thus the unit-cell volume of the two phases is very similar, which is a necessary condition for a shape memory behaviour. After the Rietveld refinement of the atomic positions and the magnetic structure (Fig. 3), we find that the magnteic moment is mainly confined to the Mn atoms, which carry a ferromagnetic moment directed perpendicular to the long axis. The magnetic moment is found to be 3.6 . This is in excellent agreement with the value (3.55 ) obtained from the magnetization measurement, as shown in the Fig. 1b.
We thank P. Entel, A. Chakrabarti P. J. Brown and R. Ranjan for fruitful suggestions and discussions. E. V. Sampathkumaran and K. Mukherjee are thanked for useful discussions and for providing the magnetization data. B. A. Chalke is thanked for providing the EDAX data. Funding from the Max Planck Partner Group project; Department of Science and Technology, Government of India; and Institut Laue-Langevin, France is gratefully acknowledged. S. Singh is thankful to the Council for Scientific and Industrial Research for research fellowship.
∗barmansr@gmail.com
References
- (1) K. Ullakko, J. K. Huang, C. Kantner, R. C. O’Handley, and V. V. Kokorin, Appl. Phys. Lett. 69, 1966 (1996).
- (2) S. J. Murray, M. Marioni, S. M. Allen, R. C. O’Handley, T. A. Lograsso, Appl. Phys. Lett. 77, 886 (2000).
- (3) A. Sozinov, A. A. Likhachev, N. Lanska, K. Ullakko, Appl. Phys. Lett. 80, 1746 (2002).
- (4) J. Pons, E. Cesari, C. Seguí, F. Masdeu, and R. Santamarta, Mater. Sci. Eng., A 481, 57 (2008).
- (5) G. D. Liu, J. L. Chen, Z. H. Liu, X. F. Dai, G. H. Wu, B. Zhang, and X. X. Zhang, Appl. Phys. Lett. 87, 262504 (2005).
- (6) S. Singh, M. Maniraj, S. W. D’Souza, R. Ranjan, and S. R. Barman, Appl. Phys. Lett. 96, 081904 (2010).
- (7) P. J. Webster, K. R. A. Ziebeck, S. L. Town, and M. S. Peak, Philos. Mag. B 49, 295 (1984).
- (8) P. J. Brown, J. Crangle, T. Kanomata, M. Matsumoto, K-U. Neumann, B. Ouladdiaf and K. R. A. Ziebeck, J. Phys.: Condens. Matter 14, 10159 (2002).
- (9) L. Righi, F. Albertini, G. Calestani, L. Pareti, A. Paoluzi, C. Ritter, P.A. Algarabel, L. Morellon, M.R. Ibarra, J. Sol. Stat. Chem. 179, 3525 (2006).
- (10) S. R. Barman, A. Chakrabarti, Sanjay Singh, S. Banik, S. Bhardwaj, P.L. Paulose, B.A. Chalke, A.K. Panda, A. Mitra, and A. M. Awasthi, Phys. Rev. B 78, 134406 (2008).
- (11) S. Singh, R. Rawat, and S. R. Barman, Appl. Phys. Lett. 99, 021902 (2011).
- (12) A. Fujita, K. Fukamichi, F. Gejima, R. Kainuma, and K. Ishida, Appl. Phys. Lett. 77, 3054 (2000).
- (13) H. B. Wang, F. Chen, Z. Y. Gao, W. Cai, and L. C. Zhao, Mat. Sci. Eng. A 438, 990 (2006)
- (14) K. Koho, O. Sderberg, N. Lanska, Y. Ge, X. Liu, L. Straka, J. Vimpari, O. Heczko, and V. K. Lindroos, Mat. Sci. Eng. A 378, 384 (2004).
- (15) H. Morito, K. Oikawa, A. Fujita, K. Fukamichi, R. Kainuma, and K. Ishida, Scripta Mater. 53, 1237(2005)
- (16) T. Krenke, E. Duman, M. Acet, E. F. Wassermann, X. Moya, L. Maosa, A. Planes, E. Suard and B. Ouladdiaf, Phys. Rev. B 75, 104414 (2007).
- (17) P. J. Brown, A. P. Gandy , R. Kainuma, T. Kanomata, K. U. Neumann, K. Oikawa , B. Ouladdiaf, A. Sheikh and K. R. A. Ziebeck, J. Phys.: Condens. Matter 23, 456004 (2011).
- (18) A. Chakrabarti and S. R. Barman, Appl. Phys. Lett. 94, 161908 (2009).
- (19) Y. Kishi, Z. Yajima, K. Shimizu, and M. Wuttig, Mater. Sci. Eng. A 378, 361 (2004).
- (20) M. Siewert, M. E. Gruner, A. Dannenberg, A. Chakrabarti, H. C. Herper, M. Wuttig, S. R. Barman, S. Singh, A. Al-Zubi, T. Hickel, J. Neugebauer, M. Gillessen, R. Dronskowski, and P. Entel, Appl. Phys. Lett. 99, 191904 (2011).
- (21) J. R. Carvajal, FULLPROF, a Rietveld refinement and pattern matching analysis program, Laboratoire Leon Brillouin, CEA-CNRS, France, (2000).
- (22) P. Entel, M. Siewert, M. E. Gruner, A. Chakrabarti, S. R. Barman, V. V. Sokolovskiy, V. D. Buchelnikov, J. Alloy Compd. (2012), doi: 10.1016/j.jallcom.2012.03.005
- (23) Experimental value (330 K) noted in Ref.Entel11, is a misprint, the actual value is 300 K, as given in Ref.Entel12, .
- (24) S. Banik, S. Singh, R. Rawat, P. K. Mukhopadhyay, B. L. Ahuja, A. M. Awasthi, S. R. Barman, and E. V. Sampathkumaran, J. Appl. Phys. 106, 103919 (2009).
- (25) S. Banik, R. Ranjan, A. Chakrabarti, S. Bhardwaj, N. P. Lalla, A. M. Awasthi, V. Sathe, D. M.Phase, P. K. Mukhopadhyay, D. Pandey, and S. R. Barman Phys. Rev. B 75, 104107 (2007).
- (26) R. Ranjan, S. Banik, S. R. Barman, U. Kumar, P. K. Mukhopadhyay, and D. Pandey, Phys. Rev. B 74, 224443 (2006).