Chaos-assisted, broadband trapping of light in optical resonators
Abstract
Chaos is a phenomenon that occurs in many aspects of contemporary science. In classical dynamics, chaos is defined as a hypersensitivity to initial conditions. The presence of chaos is often unwanted, as it introduces unpredictability, which makes it difficult to predict or explain experimental results. Conversely, we demonstrate here how chaos can be used to enhance the ability of an optical resonator to store energy. We combine analytic theory with ab-initio simulations and experiments in photonic crystal resonators to show that a chaotic resonator can store six times more energy than its classical counterpart of the same volume. We explain the observed increase with the equipartition of energy among all degrees of freedom of the chaotic resonator, i.e. the cavity modes, which is evident from the convergence of their lifetime towards a single value. A compelling illustration of the theory is provided by demonstrating enhanced absorption in deformed polystyrene microspheres.
Introduction
The enhanced interaction between light and matter in optical cavity resonators is a subject of a great interest that impacts on many areas of condensed matter physics such as cavity electrodynamics Mabuchi and Doherty (2002), quantum and nonlinear optics, but also on more applied aspects such as optical signal processing Bourzac (2012); Kengo et al. (2012); Leo et al. (2010) and resonantly enhanced optical absorption Atwater and Polman (2010).
All these applications are enabled by highly optimized optical resonators that can efficiently trap electromagnetic energy in narrow frequency bands. In conventional cavities, there is a simple trade-off between bandwidth and the enhancement of trapped energy; the higher the enhancement, the narrower the bandwidth. A great challenge in the field is therefore to develop a new generation of cavities that are able to break this fixed relationship and to store more energy in a given bandwidth window than conventional cavities would allow.
The maximum power that can be transferred into a conventional resonator depends on the coupling coefficient and loss of each given mode and tends to vary across the mode spectrum, especially when broadband operation ( 100’s of nm) is considered. In addition, classical 2D and 3D geometries tend to accommodate modes with very different lifetimes in the same spectral region, a good example being the widely used photonic crystal ”L3” type cavity that features modes of very different Q-factor closely spaced in frequency Chalcraft et al. (2007). Therefore, the use of classical resonators for broadband energy storage is limited. Here, we overcome this intrinsic limitation by exploiting specific shape deformations that support chaotic trajectories for light rays. Surprisingly, we note that in a chaotic cavity, the lifetimes of all the modes tend towards a common value, thus improving the transfer of energy into the cavity and increasing the energy-storage capability of the cavity. Such chaotic resonators Campillo (1995) have been well exploited in the field of laser devices
Gensty et al. (2005); Nöckel and Stone (1997); Harayama et al. (2003); Gmachl et al. (1998); Michel et al. (2007); Lee et al. (2008); Chen et al. (2009); Brouwer et al. (1997). We also note that the mode spectrum of deformed microsphere resonators has been studied recently with remarkable changes in the Q-factors being observed Murugan et al. (2012). However, despite this large body of literature, nothing is known about the capacity of such resonators to store and collect light energy over a broad spectral range.
The increased energy storage capacity of a chaotic resonator compared to a classical one can be intuitively explained by adopting a ray optics approach and considering that a suitable shape deformation is accompanied by the breaking of symmetry in the structure. As a consequence, the deformed resonator cannot support any cyclic motion of light, thus the trajectory of light rays changes from regular to random, statistically resulting in a larger lifetime of the photons in the cavity Campillo (1995). In order to clarify this result, we start our analysis from a symmetric (classical) resonator and observe its capacity to trap energy as it is deformed. We define a deformation parameter, , which we will use in the following description as a handle to deform any given geometry, with indicating the original, undeformed structure and indicating a proportionally deformed geometry. For example, a circle would be described by , and a deformed circle by , with describing the degree of deformation. This parameter is generic and can be used to describe the deformation of any type of resonator, e.g. square or disk in 2D or cube or sphere in 3D. In general, the larger , the larger the degree of chaos, until a saturation value is reached. The parameter is defined in Eq. (1) below.
We begin our analysis with a single ab-initio numerical experiment, which demonstrates a six-fold increase of the energy stored inside a chaotic resonator with respect to a classical counterpart of the same volume.
Such an analytic treatment allows us to study the lifetimes of the electromagnetic modes excited in the cavity and to examine the coherent buildup of energy inside the system. We find that energy gets uniformly distributed among the spectral degrees of freedom and that the cavity is able to store the same amount of energy for a given wavelength interval.
We support our theoretical results with a set of experiments both in 2D and 3D geometries.
Two-dimensional resonators were fabricated in planar photonic crystals (PhCs) and analyzed by pump and probe transmission measurements. We observed and characterized the resulting modal lifetimes for varying degrees of chaos.
While the PhC environment provides fine control over the shape of the resonator, hence its chaotic behavior, it is difficult to measure the energy stored inside the cavity directly.
For this reason, we also studied a three-dimensional arrangement of polystyrene spheres, each suitably modified to exhibit chaotic behavior. Despite the high transparency of polystyrene, absorption measurements showed a broadband absorption enhancement of across its entire absorption bandwidth (nm), due to the larger energy trapped in the chaotically deformed resonator. It is worthwhile to stress that the
only reason for the increased amount of energy trapped in the resonator is the onset of chaos caused by the deformation of the spheres, with the amount of material being kept strictly constant.
A single ab-initio experiment: broadband light confinement and energy equipartition
The theory is more easily developed in 2D starting from a circular resonator. Our setup consists of a silicon dielectric resonator with air holes , whose shape is defined by the following function in polar coordinates :
| (1) |
with the resonator area and the single parameter that controls the resonator shape. Equation (1) belongs to the family of analytic curves investigated by
Robnik: for ,
Eq. (1) supports chaos in the trajectory of light rays, which randomly bounce
inside the resonator Robnik (1983). From a physical perspective, the shape defined
by Eq. (1) is equivalent to an asymmetric deformation of a disk, and can be realized experimentally with conventional nanofabrication tools.
In our simulations, we fixed the resonator area to and numerically calculated the electromagnetic energy stored inside the resonator for varying values of . Although the value of in Eq. (1) is not bound to an upper value, we note that the system reaches saturation for a maximum degree of chaos described by (see Materials). We therefore restrict our numerical analysis to . The calculation of the electromagnetic energy is performed by a numerical integration of the energy density in the volume encompassed by the resonator and defined by and
. We simulated the input from a supercontinuum source in the wavelength range between and , which simulates a broadband source such
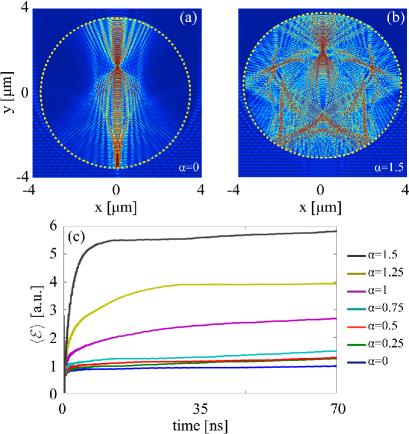
as sunlight. Figure 1a-b shows a time snapshot of the spatial distribution
of after fs, and illustrates how the geometry of the resonator changes with (Fig. 1a-b, dashed line). As seen, a small deformation in the shape (at a constant volume) already yields a radically different behavior in the distribution of light energy inside the resonator.
Figure 1c, conversely, displays the time-averaged energy
evolution with increasing parameter .
Quite remarkably, the introduction of chaos into the motion of light is accompanied by a dramatic change of the energy stored inside the resonator, whose steady state regime
—when the insertion of energy balances radiation losses— shows an 6-fold increase already
for (Fig. 1b). This energy accumulation grows with the
deformation, and monotonically rises as is increased from to .
We use Time Dependent Coupled Mode Theory (TDCMT) Haus (1984) to develop a simple and reliable model for the light-resonator interaction. The system can be modeled as a side coupled resonator, whose dynamical equations can be easily solved to get the energy and the power stored into the the th mode (see Materials):
| (2) |
with the input source power, the mode decay rate, with the intrinsic cavity
decay rate of the k-th mode and the escape rate
due to coupling with the environment.
The power strongly depends on the ratio between the radiation and the
coupling loss through the parameter , achieving the
maximum value of when .
Outside this matching condition, the power coupled into the structure decreases very fast.
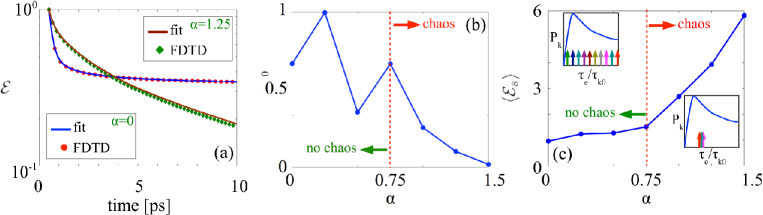
To study how the dynamics of the decay rates can be affected by chaos, we began by calculating the evolution of the decay rates for different in the resonator defined by Eq. (1). In a series of FDTD simulations,
we first excited the resonator with a source and then monitored
the energy evolution when the source was switched off. The decay constants are extracted from
the time energy evolution by applying the Prony method Tijhuis (1987). Fig. 2a shows two typical examples of numerical simulations (markers) and fit (continuous line) for two different values of . In general, modes of different frequency exhibit different decay rates .
However, when strong chaos is generated in the structure, the distribution of converges towards
a frequency independent delta function. In fact, calculations which start from initial
conditions that already belong to the chaotic region of phase space will always be distributed according
to the same probability distribution, which defines the so called natural invariant measures
of the system Beck and Schlögl (1993). As a result, when the entire phase-space is dominated by chaos,
we observe the same evolution of the decay rates for all possible initial conditions towards a frequency-independent decay rate . A convenient way of highlighting this dynamics is to plot the difference between the maximum and the minimum decay constant:
, for different values of (Fig. 2b).
We clearly observe a transition scenario: below , the dynamics shows simply an
oscillation of around the same average value, while above the chaos
threshold , a clear convergence of is observed. The value depends
on the specific geometry of the chaotic resonator, and can be assessed by calculating the relative
area of the system phase space that encompasses chaos (see Materials).
The effect of this convergence towards a single lifetime of all the modes on the energy collected by the resonator can be readily
evaluated from Eq. (2). The total power transferred into the structure, in particular,
then becomes frequency independent ,
and every mode contributes to the same extent to storing energy inside the resonator.
When many modes are present in the resonator, their large number results in
a coherent buildup process that leads to a significant accumulation of energy (Fig. 1b and Fig. 2c).
In the non-chaotic case, conversely, much fewer modes are able to efficiently transfer energy
into the resonator due to the mismatch between and (Fig. 2c, inset) and
the system can store relatively less energy (Fig. 1b and Fig. 2d).
The chaos-assisted energy buildup process observed when originates from the fundamental thermodynamic principle of equipartition, which can be highlighted using Eq. (2). By substituting into the left hand of equations (2), and assuming a dense distribution of modes, with wavelength separation , we obtain:
| (3) |
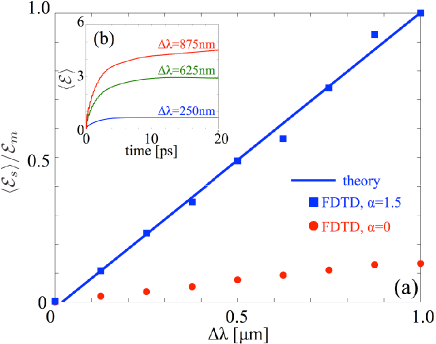
which can be regarded as an equipartition theorem, with the energy equally distributed among all degrees of freedom —i.e., the spectral wavelengths— due to the strongly chaotic nature of the system. Equipartition is at the foundation of classical statistical mechanics, and forms the basis for thermodynamic ensembles and the observation of different phases of matter Gallavotti (1999). Applied to Photonics, we have the remarkable opportunity of exploiting this principle for enhancing the energy confinement properties of photonic structures. As already discussed above, this opportunity was confirmed by calculating the energy stored for a broadband source in the two limiting conditions of a fully chaotic geometry (Fig. 3a square markers) and a non-chaotic geometry (Fig. 3a circle markers), and finding a six-fold enhancement in the chaotic case.
2D experiments: Controlling the convergence towards a single modal lifetime
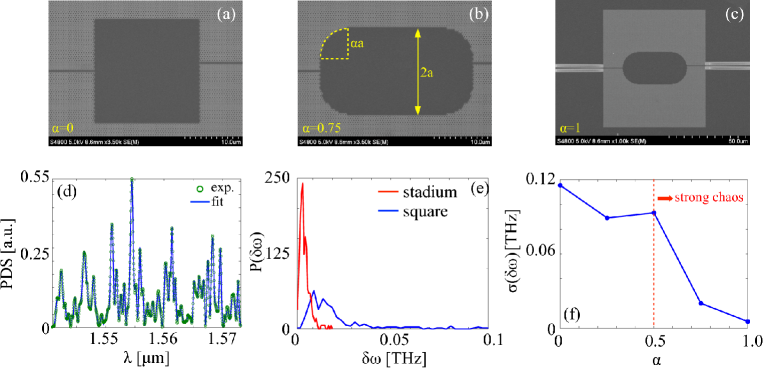
Energy equipartition and chaotic energy harvesting both originate in the convergence of the modal lifetimes towards a single value . We therefore begin our experimental campaign by investigating the occurrence of this phenomenon in real structures. We designed and experimentally realized a series of planar 2D stadium-shaped resonators in planar photonic crystals (PhCs) fabricated in Silicon on Insulator (SOI). The substrate consists of a nm thick silicon layer on a m thick insulator buried oxide. The patterns were written into ZEP resist on a modified LEO/RAITH system with 2 nm step-size and etched with a 50:50 mixture of SF6 and CHF3 gases in a reactive ion etching machine. After stripping the residual resist, the sample was cleaved for end-fire coupling. Figures (4)a-c show a set of SEM micrographs and illustrate how the shape of the resonator evolves with a change of the deformation parameter . The shape starts as a regular square (Fig. 4a) for =0 and turns into a fully chaotic stadium-shaped resonator (Fig. 4c) for =1.5, with strong chaos already developed for . The parameter guarantees a constant resonator area as is varied (Fig. 4b). As the PhC lattice was designed to exhibit a bandgap around m with a bandwidth of nm, any electromagnetic wave in this range is perfectly reflected at the PhC boundaries, and can only escape via the input/output waveguides of the structure or by scattering at imperfections. The system can therefore be described as a 2D resonator with measurable losses and the modal decay constants can be extracted from the transmitted spectrum. We employed the multiscale analysis described in Falco et al. (2012), which provides an excellent reconstruction technique even when the resonances overlap. The method fits the spectrum via a sum of suitable wavelet functions, allowing to compute the wavelength position and the width of each mode. The resonance widths are then inversely proportional to the modal decay rates Haus (1984). In order to collect statistically relevant data, we fabricated several samples with different areas: , and , and for each area we considered five different degrees of chaos, expressed via the deformation parameters , , , and . To characterize the samples, we used polarized light in the wavelength range nm to nm. Figure 4d shows a portion of one of the measured spectra, together with its reconstruction via multiscale analysis Falco et al. (2012), which shows a perfect reproduction of the experimental results. All spectra (not shown here) have been reconstructed with the same level of accuracy. We are able to extract resonances for each , which allows us to extract statistically relevant trends. Figure 4e displays the resonance linewidth probability distribution for (stadium) and (square). We note that for , the resonances are strongly converging towards a value of THz with only negligible contributions arising from the short lived modes that are characterized by a larger . Conversely, in the non chaotic regime, we observed the presence of many short lived resonances, indicated by the presence of data points up to, and even beyond 0.1 THz, as well as the wider probability distribution observed at low frequencies. In order to study the convergence of the lifetimes towards a single value, we group the data for different and the same together, and calculate the standard deviation of the resonances width . Figure 4f illustrates the results of this analysis. In perfect agreement with our theoretical predictions, we observed a significant narrowing of the linewidth distribution above the threshold for chaos. (Fig. 4d). It is worthwhile highlighting that this convergence of the linewidth towards a single value does not depend on , but only on , which is a clear experimental demonstration that the phenomenon relies entirely on the chaotic properties of the motion of light.
3D experiments with deformed microspheres: chaos-enhanced broadband absorption of light
A true comparison between model and experiment requires a direct measurement of the energy in the system.
We accomplished this final step in a three dimensional geometry, which incidentally also proves how the
physics of chaotic resonators is independent of the dimensionality of the problem.
We employed polystyrene
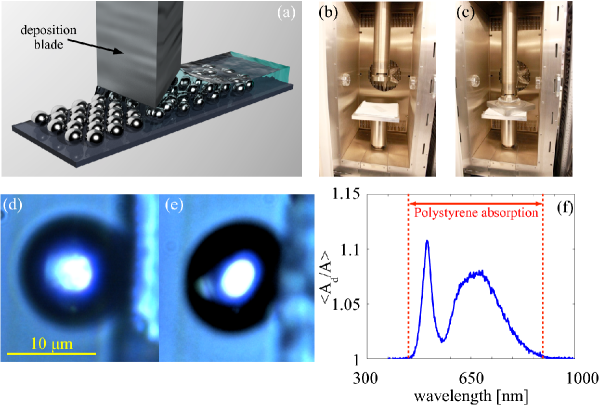
microspheres, and studied their absorption when their spherical shape gets deformed. Our sample consists of a low density monolayer of microspheres
(Fig. 5a), which are being deformed by mechanical compression (Fig. 5b) in order
to obtain an asymmetric shape such as that shown in Fig. 1b. The monolayer fabrication was performed by
employing convective assembly Malaquin et al. (2007); Li et al. (2011), where the microspheres are self-assembled on a substrate via a deposition blade (Fig. 5a). The blade height was
set at 12m from the substrate (the sphere size is m) to ensure the formation of a single layer. Following deposition,
a glass slide was placed on top of the microspheres for heating and applying mechanical pressure.
The deformation was realized by heating the system slightly beyond the glass transition temperature
of polystyrene ( Celsius Suh et al. (2004)), which softens the microspheres sufficiently to deform their shape (Fig. 5b-c).
Compression and heating were performed with an Instron 5960
dual column tabletop universal testing system. The pressure force was ramped to 500N over 2.5 mins. Figures 5d-e
show optical micrographs of a microsphere before (d) and after (e) compression,
highlighting the asymmetric deformation.
We evaluated the energy harvesting capacity of this system by performing absorption
measurements on a single sphere in both deformed and undeformed conditions. In order to acquire a sufficiently large statistics from different input conditions, we placed our sample on a goniometric stage and, through a series of pump and probe measurements, we calculated the absorption of the sphere at various illumination angles in the range of degrees. During each measurement, we illuminated the sphere with a broadband source (with bandwidth m centered at nm) and measured the absorption from the relation , being , transmittance and reflectance of the microsphere,
respectively. To properly collect the scattered light, transmission and reflection spectra were measured in the near field with a lens with a high numerical aperture. The data was acquired with an Ocean Optics QE65000-FL spectrometer.
Figure 5f shows the average absorption of the deformed system,
being and the absorption measured in the deformed and undeformed case, respectively. For every angle we obtained an increased absorption due to deformation, with a variance within a few percent. This originates from the larger
electromagnetic energy stored by the microsphere in the deformed case, which led to a higher absorption
in the entire absorption window of polystyrene (Fig. 5f). Near the wavelength nm,
in particular, the average absorption increases by , while in the region
where the optical spectrum contains the maximum power (), the absorption
shows a broadband increase of a approximatively . Outwith the absorption frequency
window of polystyrene (Fig. 5 solid lines), as expected, the chaotic energy accumulation
does not induce any measurable variation of the absorption.
Discussion
Our analytical, numerical and experimental results addressed the problem of light trapping in chaotically deformed resonators and demonstrate the possibility of exploiting chaos as a new avenue for energy
harvesting. Our work began with a single numerical ab-initio
experiment, where we demonstrated broadband energy accumulation in an optical
resonator once its shape was deformed to support the chaotic motion of light. We then developed an analytical approach based on a rigorous formulation of time dependent
coupled mode theory, which highlights the principal phenomena of chaotic
energy trapping. This approach allowed us to unveil the presence of the fundamental
thermodynamic principle of energy equipartition. Equipartition, in our case, is manifested by the uniform distribution
of energy among all degrees of freedom of the chaotic resonator, i.e. the cavity modes, and is evident from the convergence of the lifetime of the modes towards a single value. A single lifetime means that each mode can store the same amount of energy, which overall leads to a significant energy buildup in the resonator. The process is equivalent to the Brownian motion of particles in a liquid, where each particle carries the same amount of energy.
The analogy goes even further. In a liquid, the particles always reach a uniform distribution regardless of the shape of the vessel they are contained in. In our optical analogue, the steady state of chaotic modes also does not depend on the particular
realization of the resonator, but only on its ’macroscopic’ geometry, whose only requirement
is to support chaotic trajectories for the trapped light. A large series of
parallel ab-initio simulations perfectly confirmed our theoretical predictions.
We then conducted an experimental campaign to demonstrate both the main physical
principles and the possible applications of this concept. In particular, we started by employing
two-dimensional (2D) photonic crystals and realized stadium-shaped resonators with different degrees of chaoticity.
Using pump and probe experiments, we demonstrated the convergence of the modal decay
times towards a single value, which is at the basis of energy equipartition and chaotic energy harvesting.
We then considered the realization of a practical three-dimensional (3D) geometry where we demonstrated enhanced light trapping through shape deformation directly. We employed polystyrene microspheres and altered their shape through heating and mechanical compression. We then measured the absorption
of the system, and experimentally demonstrated a broadband increase across the entire
absorption window of the material by deforming the spheres form spherical to chaotic. The measured absorption increase was as high as , which is quite
remarkable considering the low absorption of polystyrene and the low refractive index of the material which only affords weak light trapping .
Besides the obvious implications at the fundamental level, where we demonstrate the existence of a fundamental principle of thermodynamics in the framework of Photonics, our results also have real-world practical implications.
The cost of many semiconductor devices, e.g. LEDs and solar cells, is determined to a significant extent by the cost of the material. We show that the functionality of a given geometry, here exemplified by the energy that can be trapped in the system, can be enhanced up to six-fold by changing the shape alone, i.e. without increasing the amount of material and without increasing the material costs. Furthermore, a chaotic system is easier to fabricate as the tolerances are relaxed; the only requirement is that the resonator supports chaotic lightpaths, which is much easier to achieve in practise than manufacturing a resonator which is perfectly regular.
Methods
Ab-initio computations. —
Numerical simulations were performed with our NANOCPP Maxwell solver (www.primalight.org). NANOCPP is a two/three-dimensional FDTD Maxwell code based on a parallel implementation of the Yee FDTD algorithm. The code employs uniaxial perfectly matched layers (UPML) to efficiently absorb outgoing waves and provides both hard and planewave sources [the latter via total field scattered field (TFSF) formulation]. NANOCPP efficiently scales over hundreds of thousands of processors, and is specifically designed for massively parallel electromagnetic computations. Our simulations consisted of a total of Million of single-cpu computational hours, with each simulation employing 4096-8192 computational cores on the KAUST Shaheen computational cluster and a resolution of at least points per internal wavelength.
Time dependent coupled mode equations. —
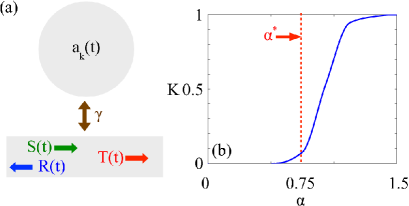
Figure 6a shows a TDCMT model of the light-resonator system. In this scheme, the environment is represented as a waveguide side coupled to the resonator. The input signal interacts with the resonator through the coupling coefficient and transfers energy to the modes of the cavity (), being the frequency, the lifetime, the amplitude and the energy carried by the th mode. The total energy stored in the resonator is . Decay rates can be further decomposed as follows , with the intrinsic decay constant of the mode and the decay constant due to coupling with the source. Cavity modes obey the following evolution equations Haus (1984):
| (4) |
with Haus (1984), while reflection and transmission are given by the following expressions:
| (5) |
with and the reflection and transmission of the th mode, respectively Haus (1984). In the presence of a single frequency excitation switched on at , with being the Heaviside function, Eqs. (4) are readily solved for each and read:
| (6) |
For a broadband source, , the total electromagnetic energy stored in the cavity is readily found to be:
| (7) |
Equation (7) can be further simplified as the integral yields significant contributions only for , and we obtain:
| (8) |
which represents the first of Eq. (2). The power transferred into the th mode is conversely evaluated from the energy balance equation:
| (9) |
that, in conjunction with Eqs. (5)-(6), yields the second of Eqs. (2).
Characterization of chaos. —
We quantitatively describe the chaoticity of light motion by evaluating the relative area of the resonator s phase space that encompasses chaos. This is achieved by first calculating the distribution of the Lyapunov exponent Ott (1997) in phase space, and then performing a weighted summation by assigning ’1’ if the Lyapunov exponent is positive, and ’0’ otherwise. The resulting quantity can be regarded as a normalized version of the Kolmogorov-Sinai entropy Boffetta et al. (2002); Ott (1997). In particular, when , the resonator dynamics exhibits no chaos and the resulting motion is totally reversible, while for the phase space is totally chaotic and all input conditions lead to chaos. Values of between these two limiting conditions indicate a phase space partially chaotic, with measuring the relative area of the chaotic sea with respect to the reversible portion of the dynamics. Figure 6b displays the behavior of for the billiard of Eq. 1. For lower than the threshold value , no chaos is observed in the structure, while for strong chaos is generated through the shape deformation. At , the structure is fully chaotic and the phase-space is totally dominated by a single chaotic sea.
Acknowledgments
For computer time, this research used the resources of the Supercomputing Laboratory at King Abdullah University of Science & Technology (KAUST) in Thuwal, Saudi Arabia.
Authors contributions
A. Fratalocchi initiated the work and developed the theory behind chaotic energy harvesting. C. Liu and D. Molinari carried out numerical FDTD simulations and performed data analysis. A. Di Falco and T. F. Krauss realized the PhC samples and performed the experiments on the 2D geometries. B. S. Ooi and Y. Khan performed experiments on 3D deformed microspheres. All authors contributed to the manuscript preparation.
References
- Mabuchi and Doherty (2002) H. Mabuchi and A. C. Doherty, Science 298, 1372 (2002).
- Bourzac (2012) K. Bourzac, Nature 483, 388 (2012).
- Kengo et al. (2012) N. Kengo, S. Akihiko, M. Shinji, S. Yasumasa, S. Toru, S. Tomonari, K. Yoshihiro, T. Ryo, and N. Masaya, Nature , 248 (2012).
- Leo et al. (2010) F. Leo, S. Coen, P. Kockaert, S. P. Gorza, P. Emplit, and M. Haelterman, Nat. Photon. 4, 471 (2010).
- Atwater and Polman (2010) H. A. Atwater and A. Polman, Nature Materials 9, 205 (2010).
- Chalcraft et al. (2007) A. R. A. Chalcraft, S. Lam, D. O’Brien, T. F. Krauss, M. Sahin, D. Szymanski, D. Sanvitto, R. Oulton, M. S. Skolnick, A. M. Fox, D. M. Whittaker, H.-Y. Liu, and M. Hopkinson, Applied Physics Letters 90, 241117 (2007).
- Campillo (1995) A. J. Campillo, ed., Optical Processes in Microcavities (World Scientific, Singapore, 1995).
- Gensty et al. (2005) T. Gensty, K. Becker, I. Fischer, W. Elsäßer, C. Degen, P. Debernardi, and G. P. Bava, Phys. Rev. Lett. 94, 233901 (2005).
- Nöckel and Stone (1997) J. U. Nöckel and A. D. Stone, Nature 385, 45 (1997).
- Harayama et al. (2003) T. Harayama, P. Davis, and K. S. Ikeda, Phys. Rev. Lett. 90, 063901 (2003).
- Gmachl et al. (1998) C. Gmachl, F. Capasso, E. E. Narimanov, J. U. Nöckel, A. D. Stone, J. Faist, D. L. Sivco, and A. Y. Cho, Science 280, 1556 (1998).
- Michel et al. (2007) C. Michel, V. Doya, O. Legrand, and F. Mortessagne, Phys. Rev. Lett. 99, 224101 (2007).
- Lee et al. (2008) T.-D. Lee, C.-Y. Chen, Y. Lin, M.-C. Chou, T.-h. Wu, and R.-K. Lee, Phys. Rev. Lett. 101, 084101 (2008).
- Chen et al. (2009) C. C. Chen, Y. T. Yu, R. C. C. Chen, Y. J. Huang, K. W. Su, Y. F. Chen, and K. F. Huang, Phys. Rev. Lett. 102, 044101 (2009).
- Brouwer et al. (1997) P. W. Brouwer, K. M. Frahm, and C. W. J. Beenakker, Phys. Rev. Lett. 78, 4737 (1997).
- Murugan et al. (2012) G. S. Murugan, J. S. Wilkinson, and M. N. Zervas, Appl. Phy. Lett. 101, 071106 (2012).
- Robnik (1983) M. Robnik, Journal of Physics A: Mathematical and General 16, 3971 (1983).
- Haus (1984) H. A. Haus, Waves and Fields in Optoelectronics (Prentice-Hall, Englewood Cliffs, N. J., 1984).
- Tijhuis (1987) A. G. Tijhuis, Electromagnetic inverse profiling (VNU Science Press, Utrecht, 1987).
- Beck and Schlögl (1993) C. Beck and F. Schlögl, Thermodynamics of chaotic systems (Cambridge University Press, Cambridge, 1993).
- Gallavotti (1999) G. Gallavotti, Statistical Mechanics: A Short Treatise (Springer, New York, 1999).
- Falco et al. (2012) A. D. Falco, T. F. Krauss, and A. Fratalocchi, Appl. Phys. Lett. 100, 184101 (2012).
- Malaquin et al. (2007) L. Malaquin, T. Kraus, H. Schmid, E. Delamarche, and H. Wolf, Langmuir 23, 11513 (2007).
- Li et al. (2011) X.-H. Li, R. Song, Y.-K. Ee, P. Kumnorkaew, J. Gilchrist, and N. Tansu, Photonics Journal, IEEE 3, 489 (2011).
- Suh et al. (2004) K. Y. Suh, H. Yoon, H. H. Lee, A. Khademhosseini, and R. Langer, Applied Physics Letters 85, 2643 (2004).
- Ott (1997) E. Ott, Chaos in Dynamical Systems (Cambridge University Press, Cambridge, 1997).
- Boffetta et al. (2002) G. Boffetta, M. Cencini, M. Falcioni, and A. Vulpiani, Physics Reports 356, 367 (2002).