Alignment and scaling of large-scale fluctuations in the solar wind
Abstract
We investigate the dependence of solar wind fluctuations measured by the Wind spacecraft on scale and on the degree of alignment between oppositely directed Elsasser fields. This alignment controls the strength of the non-linear interactions and, therefore, the turbulence. We find that at scales larger than the outer scale of the turbulence the Elsasser fluctuations become on average more anti-aligned as the outer scale is approached from above. Conditioning structure functions using the alignment angle reveals turbulent scaling of unaligned fluctuations at scales previously believed to lie outside the turbulent cascade in the ‘ range’. We argue that the range contains a mixture of non-interacting anti-aligned population of Alfvén waves and magnetic force-free structures plus a subdominant population of unaligned cascading turbulent fluctuations.
Introduction. The solar wind is a hot, tenuous plasma that flows away from the Sun at supersonic speeds. Turbulence transports energy from the driving ‘outer’ scale to smaller scales via non-linear magnetohydrodynamic (MHD) interactions of magnetic B and velocity V fields, until kinetic effects and dissipation become important close to the ion gyroscale. In fast solar wind ( km/s), a ‘’ scaling of magnetic-field power spectra is observed at low spacecraft frequencies, Goldstein et al. (1995); Horbury et al. (1996); Wicks et al. (2010). Slowly evolving structures are advected at supersonic speeds past spacecraft, so the observed spacecraft frequency of a fluctuation is proportional to its characteristic wave number (scale) (Taylor, 1938). The energy spectrum in the range is, therefore, expected to scale as . A steeper spectrum close to associated with turbulence is observed at higher spacecraft frequencies in the ‘inertial range’ and there is a spectral break between the two regimes (Matthaeus & Goldstein, 1986; Velli, Grappin & Mangeney, 1990; Horbury et al., 1996; Wicks et al., 2010); at AU this typically occurs at Hz. Studies have shown (Belcher & Davis, 1971; Matthaeus & Goldstein, 1986; Roberts et al., 1987; Bavassano & Bruno, 1992; Horbury et al., 1996; Matthaeus et al., 2007) that the power spectral density of fluctuations in the low-frequency band decreases with distance from the Sun as , consistent with these scales containing non-interacting Alfvén waves (Hollweg, 1990), and thus these large-scale fluctuations are thought to have originated at the Sun and travelled outwards with relatively little in-situ modification. In this Letter, we argue that this interpretation is incomplete as nonlinear interactions occur at larger scales than previously thought (see also Verdini et al., (2012)).
Recently the concept of scale-dependent alignment has become prominent in theoretical and numerical studies of MHD turbulence (Boldyrev, 2006; Mason et al., 2006; Perez & Boldyrev, 2009; Beresnyak & Lazarian, 2008, 2009; Beresnyak, 2011). Scale-dependent alignment is the tendency for the angle between fluctuations of B and V in the plane perpendicular to the mean magnetic field to decrease with increasing . Attempts to measure alignment in the inertial range of the solar wind produce no evidence of scaling (Podesta et al., 2009; Hnat et al., 2011), although the ability to measure the scale dependence is limited by instrument noise characteristics. These studies do, however, find a scaling of the alignment in the range, which is unexpected given the previous interpretations of these large-scale fluctuations as non-turbulent.
Here we study the alignment of Alfvénic fluctuations in the range. We use Elsasser variables (Elsasser, 1950; Tu et al.,, 1989, 1990) to characterize the Alfvén waves that travel sunward and anti-sunward in the plasma frame. We define the angle between fluctuations in the Elsasser fields in the plane perpendicular to as the alignment angle. This angle is geometrically related to the alignment angle between fluctuations and but is not completely determined by it. The alignment angle is important because it controls the strength of the non-linear interaction (Dobrowolny, Mangeney & Veltri, 1980) and, as we are about to see, allows one to sort the large-scale fluctuations into steep-scaling ‘turbulent’ and shallow-scaling ‘non-turbulent’ populations.
Data. We use Wind spacecraft observations of solar wind magnetic field B, velocity V, and proton number density at cadence s made by the MFI and 3DP instruments during a 6-day-long fast stream interval observed between days 14 and 20 of 2008. The average solar wind conditions were: km/s, nT, cm-3, Alfvén speed km/s, and the ratio of thermal to magnetic pressure for protons . Similar fast streams recurred five times in succession due to a long-lived, low-latitude coronal hole. A further three of these fast streams were also analyzed and provide quantitatively similar results to those shown here; one stream was excluded because it coincided with a large data gap. The same analysis performed on Ulysses spacecraft data when in fast wind over the poles of the Sun also shows qualitatively the same results as described below.
We use the Alfvén-normalized magnetic field . Elsasser variables, , are re-defined so that are anti-sunward and sunward propagating fluctuations in the plasma frame. We are interested in alignment, so we use only the projection of the fluctuating fields on to the plane perpendicular to the local mean magnetic field at a time scale :
| (1) | ||||
| (2) | ||||
| (3) |
where denotes unit vectors and X can be , V, or . In the plots presented below, the time scale is converted into a frequency in the spacecraft frame to facilitate comparison with Fourier spectra: . A logarithmically spaced range of time scales s s is used to investigate the inertial and ranges of the fast solar wind.
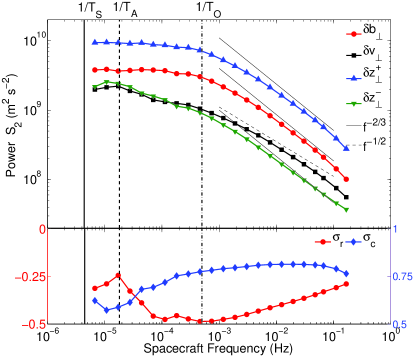
Structure functions. In Fig. 1, we show the second-order structure functions of all four vector fields perpendicular to the magnetic field:
| (4) |
where is the number of samples in the time period . The scaling exponent of the structure functions , where , is related to the Fourier spectral index by Monin & Yaglom (1975); Marsch & Tu (1997).
The vertical lines in Fig. 1 show important time scales for this period of solar wind. AU s is the approximate time the solar wind has taken to travel from the Sun to the Wind spacecraft. s is the approximate time scale associated with the outer scale, defined as the scale at which rolls over from flat in Fig. 1 ( corresponding to the spectral index , the range) to an inertial range scaling (). s is the approximate time scale associated with the advection past the spacecraft of the largest separation two counter-propagating Alfvén waves can have and still meet one another in the time the solar wind has taken to propagate from the Sun to the spacecraft. To calculate we estimate the dependence on heliocentric distance as follows: and and thus and solve for the distance from the Sun that the slower of the two Alfvén waves ( and ) must start so that the faster wave just meets it at 1 AU. Thus the spacecraft frequencies between and represent spatial structure between different source regions in the corona, since they cannot have interacted during transit from the Sun. The range of frequencies between and contains fluctuations that may have interacted; on these scales, all structure functions are relatively flat, with and . Frequencies higher than show all variables with scaling typical of turbulence in the fast solar wind: Roberts (2010); Boldyrev et al. (2011).
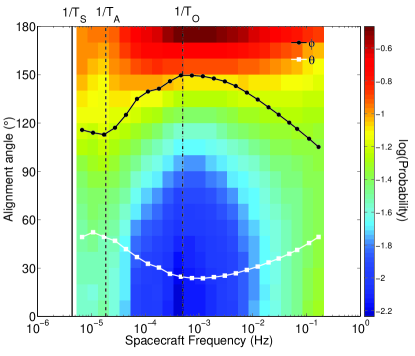
Alignment angle. In order to investigate correlations between Elsasser fluctuations, we calculate the local scale-dependent :
| (5) |
In Fig. 2, we show the mean (in black) and the probability distribution of at each scale. The distribution of has been discretized using wide bins. At all scales, the distribution of covers the full range of possible values and is peaked at . The mean is not the most probable value at any scale and is strongly dependent on the tail of the distribution that extends towards . The mean values of , the angle between and , calculated in a similar manner to , are also shown (in white).
The frequencies and both coincide with marked changes in behavior of the distribution and mean of in Fig. 2. The mean alignment angle, , increases between and , but then rolls over and decreases at higher frequencies, similar to previous observations of Podesta et al. (2009); Hnat et al. (2011). The peak in the distribution at grows as frequency increases in the range but then flattens and begins to decrease where instrument noise becomes important, as discussed below.
Relating alignment and spectral scaling. To investigate whether has any effect on the turbulence and what may be causing the change in with scale, we use structure functions conditioned on . Eq.(4) is modified to average over instances when is within a fixed range:
| (6) |
where is the number of points with .
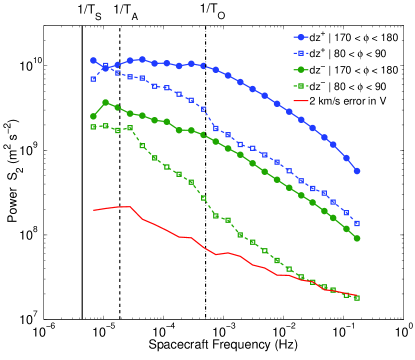
The structure functions calculated according to Eq. (6) are shown in Fig. 3 for the anti-aligned and perpendicularly aligned fluctuations: (filled symbols) and (open symbols), respectively. This allows us to investigate the effect that the alignment angle has on the turbulence by separating differently aligned fluctuations and observing their scaling in the and inertial ranges.
Between and , the anti-aligned anti-sunward structure functions scale with , giving a spectral index close to . These fluctuations are the most common (Fig. 2) and contain the most power and hence dominate the bulk average structure functions in Fig. 1 - and presumably all previously reported, unconditioned structure functions and spectra in this frequency range of fast solar wind. Perpendicularly aligned , however, have a steeper scaling , corresponding to a spectral index only slightly shallower than that at higher frequencies in the inertial range, .
The structure functions of perpendicularly aligned sunward fluctuations are steep from until the instrument noise floor (the solid red line; see discussion below) is reached, with in the range and in the inertial range, giving a spectral index close to in both frequency ranges. The anti-aligned structure functions are flatter in the range than in the inertial range, with and respectively. These scalings are summarized in Table 1.
Accuracy of measurements. Measurement noise is a potential concern in this analysis. The 3DP instrument is known to have noise in the high-cadence moments Podesta et al. (2009) with observations often appearing discretized. By differencing the raw velocity data and finding the most common value we estimate the noise amplitude during the periods we analyze to be approximately equivalent to a 2 km/s uncertainty in each component of V. A standard error analysis on Equation (4) leads to the frequency dependent noise represented by the red line in Fig. 3. This noise affects the structure functions of perpendicularly aligned sunward fluctuations the most, with the signal to noise ratio of un-aligned structure functions becoming significant () at Hz; this is our estimate of the frequency at which noise begins to render our results unreliable. We have, therefore, restricted the fitting of the structure functions scaling in the inertial range (Table 1) to the lowest frequency decade, Hz. This minimizes the effect of the noise on the scaling and we do not draw conclusions about the inertial range.
The noise will also affect the measurement of since it uses the values of and , which in turn contain V observations. The roll-over of at in Fig. 2 occurs at a frequency a factor of 4 lower than the frequency Hz, at which the signal to noise ratio of the weakest structure functions reaches a value of 2, and so cannot solely be attributed to noise. The strong decrease in and the flattening of the distribution at spacecraft frequencies above Hz is, however, likely to be caused by the noise.
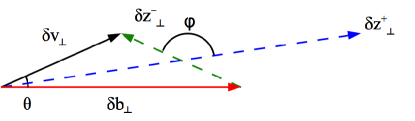
Alignment and geometry. Alignment of and is related to the alignment of and . Fig. 4 shows a typical geometry in the plane perpendicular to in the fast solar wind, assuming with only a small angle between the vectors, as suggested by Fig. 1 and 2. This results in with a large angle between them (anti-alignment). This simple geometry can be expressed in terms of the scale-dependent dimensionless parameters Footnote (2012) normalized cross helicity and normalized residual energy :
| (7) | |||||
| (8) |
The geometry in Fig. 4 is fixed by setting any two of , , and . Therefore, statements about alignment are also statements about normalized cross helicity and residual energy of individual fluctuations, and vice-versa. The fluctuations that scale steeply in Fig. 3 are those with and therefore meaning that .
While we note that the relations in Eq. (7, 8) are only strictly true for individual realizations it is interesting to look at our results concerning averages from this point of view Footnote2 (2012). In the range , is negative and decreases towards while increases towards (Fig. 1). So, in accordance with Eq. (7), the alignment angle tends towards (Fig. 2). Note that this situation is perhaps consistent with the idea that MHD turbulence would generate negative residual energy Boldyrev & Perez (2009). In the same vein, we conclude from Eq. (8) that the alignment between and intensifies in the range, as indeed seen in the solar wind (the angle is shown in white in Fig. 2 and was previously measured in Podesta et al. (2009); Hnat et al. (2011)).
Discussion. We have shown that in the fast solar wind, both the distribution and the mean of the angle between Elsasser fluctuations, are scale dependent. The probability of Elsasser fluctuations being anti-aligned () starts increasing at the scale at which Alfvén waves begin to interact, , and stops at the outer scale, .
In Fig. 3 and the attendant discussion, we showed that the scaling of spectra (flat scaling of structure functions) detected in numerous previous observations of fast solar wind is dominated by the anti-aligned subset of the anti-sunward Elsasser fluctuations (). Hidden beneath this energetically dominant sea of non-interacting (or weakly interacting) ‘non-turbulent’ fluctuations are the unaligned fluctuations, which exhibit steep spectral scalings symptomatic of a nonlinear cascade. We hypothesize that the steep scaling of unaligned fluctuations is caused by the increased in-situ non-linear interaction of these fluctuations, since both populations of fluctuations have similar and travel time from the Sun. The different behavior of these populations is reminiscent of the difference between slow and fast solar wind streams Grappin et al., (1991), however the fluctuations that scale steeply () do not resemble those characteristic of slow wind ().
It is an interesting question whether the anti-aligned ‘non-turbulent’ fluctuations are Alfvén waves or magnetically dominated force-free structures. The pure case of the former would require and so (, ); the pure case of the latter, and so (, ). The measured fluctuations appear to be in between these two extremes ( and ) and can perhaps be interpreted as a mixture of them Tu & Marsch (1991, 1993). Both types of fluctuation are slow to decay; this can be thought of in terms of conservation of cross helicity (Alfvén waves) and magnetic helicity (force-free structures, subject to the minimum-energy constant-helicity relaxation principle Taylor (1974); Woltjer (1958)). The generation of residual energy at low frequencies Boldyrev & Perez (2009) could then be interpreted as generation (or occurrence and persistence) of force-free structures.
We conclude that the turbulent cascade in the fast solar wind starts at larger scales than previously thought, although it is restricted to perpendicularly aligned fluctuations and energetically sub-dominant. Measured scale-dependent alignment in the range represents the change in the fractional populations with scale of turbulent, non-linearly interacting, perpendicularly aligned fluctuations versus non-interacting, anti-aligned fluctuations. We have identified a new, larger, outer scale (), which is consistent with an anti-sunward Alfvén wave requiring only one interaction with an oppositely directed wave to launch the perpendicularly aligned cascade. It is still uncertain what determines the frequency at which the spectral break between the and the inertial ranges occurs Matthaeus & Goldstein (1986); Bavassano & Bruno (1992); Matthaeus et al. (2007); Verdini et al., (2012); Grappin et al., (1991).
This research was supported by the NASA Postdoctoral Program at the Goddard Space Flight Center (RTW), STFC (RTW, AM, TSH), NASA grant NNX09AE41G (CHKC) and the Leverhulme Trust Network for Magnetized Plasma Turbulence. Wind data were obtained from the NSSDC website http://nssdc.gsfc.nasa.gov.
References
- Goldstein et al. (1995) M. L. Goldstein, D. A. Roberts, and W. H. Matthaeus, Annu. Rev. Astron. Astrophys. 33, 283, 1995.
- Horbury et al. (1996) T. S. Horbury, A. Balogh, R. J. Forsyth, and E. J. Smith, Astron. Astrophys., 316, 333, 1996.
- Wicks et al. (2010) R. T. Wicks, T. S. Horbury, C. H. K. Chen, and A. A. Schekochihin, Mon. Not. R. Astron. Soc. 407, L31, 2010.
- Taylor (1938) G. I. Taylor, Proc. Roy. Soc., 164, 919, 476, 1938.
- Matthaeus & Goldstein (1986) W. H. Matthaeus, and M. L. Goldstein, Phys. Rev. Lett., 57, 495, 1986.
- Velli, Grappin & Mangeney (1990) M. Velli, R. Grappin, and A. Mangeney, Computer Phys. Communications, 59, 153, 1990.
- Belcher & Davis (1971) J. W. Belcher, and L. J. Davis Jr., Geophys. Res., 76, 16, 3534, 1971.
- Roberts et al. (1987) D. A. Roberts, M. L. Goldstein, L. W. Klein, and W. H. Matthaeus, J. Geophys. Res., 92, A11, 12023, 1987.
- Bavassano & Bruno (1992) B. Bavassano, and R. Bruno, J. Geophys. Res., 97, A12, 19129, 1992.
- Matthaeus et al. (2007) W. H. Matthaeus, B. Breech, P. Dmitruk, A. Bemporad, G. Poletto, M. Velli, and M. Romoli, Astrophys. J., 657, L121, 2007.
- Hollweg (1990) J. V. Hollweg, J. Geophys. Res., 95, 14873, 1990.
- Verdini et al., (2012) A. Verdini, R. Grappin, R. Pinto, and M. Velli, Astrophys. J. Lett., 750:L33 (5pp), 2012.
- Boldyrev (2006) S. Boldyrev, Phys. Rev. Lett. 96, 115002, 2006.
- Mason et al. (2006) J. Mason, F. Cattaneo, and S. Boldyrev, Phys. Rev. Lett., 97, 255002, 2006.
- Perez & Boldyrev (2009) J. C. Perez, and S. Boldyrev, Phys. Rev. Lett. 102, 025003, 2009.
- Beresnyak & Lazarian (2008) A. Beresnyak, and A. Lazarian, Astrophys. J. 682, 1070, 2008.
- Beresnyak & Lazarian (2009) A. Beresnyak, and A. Lazarian, Astrophys. J. 702, 460, 2009.
- Beresnyak (2011) A. Beresnyak, Phys. Rev. Lett., 106, 075001, 2011.
- Podesta et al. (2009) J. J. Podesta, B. D. G. Chandran, A. Bhattacharjee, D. A. Roberts, and M. L. Goldstein, J. Geophys. Res., 114, A01107, 2009.
- Hnat et al. (2011) B. Hnat, S. C. Chapman, G. Gogoberidze, and R. T. Wicks, Phys. Rev. E, 84, 065401, 2011.
- Elsasser (1950) W. M. Elsasser, Phys. Rev. 79, 183, 1950.
- Tu et al., (1989) C.-Y. Tu, E. Marsch, and K. M. Thieme, J. Geophys. Res., Vol. 94, No. A9, 11,739-11,759, 1989
- Tu et al., (1990) C.-Y. Tu, E. Marsch, and H. Rosenbauer, Geophys. Res. Lett., Vol 17, No. 3, 283-286, 1990.
- Dobrowolny, Mangeney & Veltri (1980) M. Dobrowolny, A. Mangeney, and P. L. Veltri, Phys. Rev. Lett., 45, 144, 1980.
- Monin & Yaglom (1975) A. S. Monin, and A. M. Yaglom, Statistical Fluid Mechanics: Mechanics of Turbulence, Volume 2, edited by J. L. Lumley, (M.I.T. Press, Cambridge, Mass., 1975).
- Marsch & Tu (1997) E. Marsch, and C.-Y. Tu, Nonlinear Process. Geophys. 4, 101 124, 1997.
- Boldyrev et al. (2011) S. Boldyrev, J. C. Perez, J. E. Borovsky, and J. J. Podesta, Astrophys. J. 741:L19, 2011.
- Roberts (2010) D. A. Roberts, J. Geophys. Res., 115, A12101, 2010.
- Footnote (2012) Note that these relations have been used in previous studies of the character of solar wind turbulence Bavassano et al., (1998); Bavassano & Bruno (2006) where they are called ‘correlation functions’. There has also been a more recent study (Osman et al., 2011) which shows that the alignment angle depends directly on cross helicity, which can be clearly understood from Eq. (8).
- Bavassano et al., (1998) B. Bavassano, E. Pietropaolo, R. and Bruno, J. Geophys. Res., 103, A4, 6521-6529, 1998.
- Bavassano & Bruno (2006) B. Bavassano, and R. Bruno, Ann. Geophys., 24, 3179-3184, 2006.
- Osman et al. (2011) K. T. Osman, M. Wan, W. H. Matthaeus, B. Breech, and S. Oughton, Astrophys. J., 741, 75, 2011.
- Footnote2 (2012) General inferences can be made for the mean values because observations of the PDFs of and for , and (Podesta et al., 2009; Osman et al., 2011; Bavassano et al.,, 1998; Bavassano & Bruno, 2006) are singly peaked and the means follow the general trend of the distributions with scale.
- Boldyrev & Perez (2009) S. Boldyrev, and J. C. Perez, Phys. Rev. Lett., 103, 225001, 2009.
- Grappin et al., (1991) R. Grappin, M. Velli, and A. Mangeney, Annales Geophysicae 9, 416 426, 1991.
- Tu & Marsch (1991) C. -Y. Tu, and E. Marsch, Annales Geophysicae, 9, 5, 319-332, 1991.
- Tu & Marsch (1993) C. -Y. Tu, and E. Marsch, J. Geophys. Res., 98(A2), 1257 1276, 1993.
- Taylor (1974) J. B. Taylor, Phys. Rev. Lett., 33, 1139, 1974.
- Woltjer (1958) L. Woltjer, Proc. Nat. Acad. Sci., 44, 489, 1958.